Choosing the right mutual fund can be perplexing. With numerous options available, each with its unique investment style and performance track record, investors often face a dilemma. Now, Let’s compare the Kotak Emerging Equity Fund vs Nippon India Growth Fund and delve deep into a comprehensive comparative analysis of these funds to help you make an informed decision.
Investment Style
Regarding investment style, Kotak Emerging Equity Fund and Nippon India Growth Fund follow a blended approach. This means they invest in a mix of growth and value stocks, striving for a balanced portfolio with the potential for capital appreciation and stability.

Returns Analysis
Trailing Returns
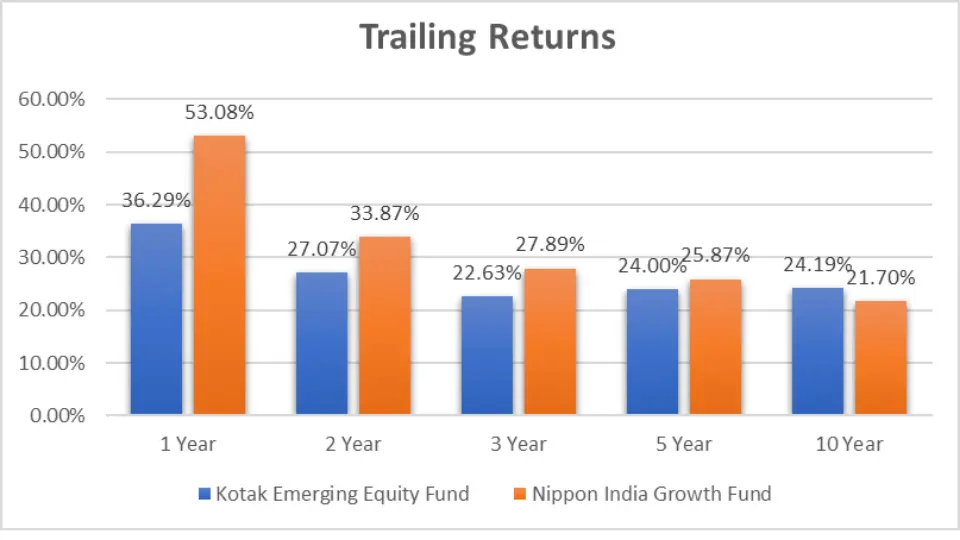
| Period Invested for | Kotak Emerging Equity Fund | Nippon India Growth Fund |
| 1 Year | 36.29% | 53.08% |
| 2 Year | 27.07% | 33.87% |
| 3 Year | 22.63% | 27.89% |
| 5 Year | 24.00% | 25.87% |
| 10 Year | 24.19% | 21.70% |
Analysis:
- 1 Year: Nippon India Growth Fund outperforms Kotak Emerging Equity Fund with a higher annualized return of 53.08% compared to 36.29%.
- 2 Years: A similar trend continues, with Nippon India Growth Fund yielding 33.87% compared to Kotak Emerging Equity Fund’s 27.07%.
- 3 Years: Nippon India Growth Fund maintains its lead with an annualized return of 27.89%, while Kotak Emerging Equity Fund stands at 22.63%.
- 5 Years: Kotak Emerging Equity Fund slightly closes the gap with an annualized return of 24.00% versus Nippon India Growth Fund’s 25.87%.
- 10 Years: Kotak Emerging Equity Fund surpasses Nippon India Growth Fund with an annualized return of 24.19% compared to 21.70%.
Lumpsum Investment Value
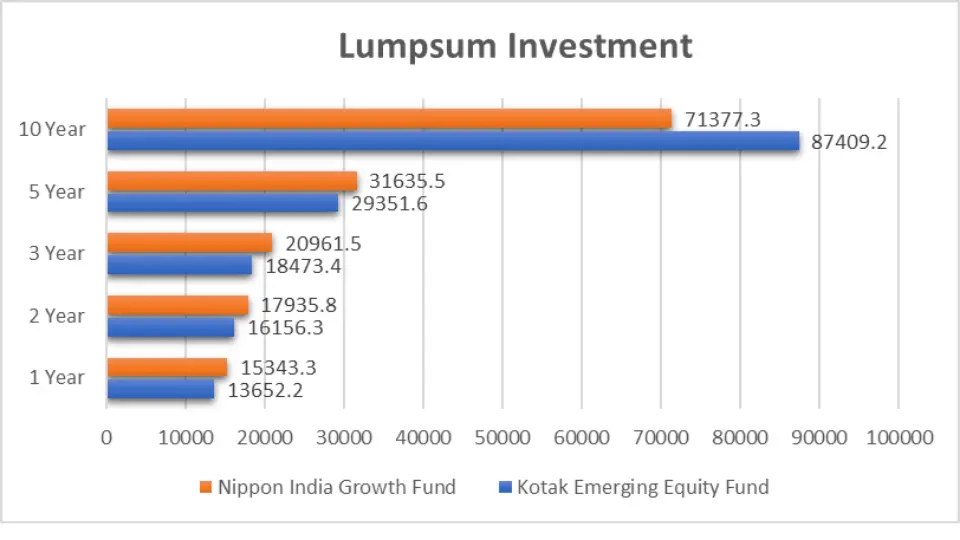
| Period Invested for | Kotak Emerging Equity Fund | Nippon India Growth Fund |
| 1 Year | ₹13,652.2 | ₹15,343.3 |
| 2 Year | ₹16,156.3 | ₹17,935.8 |
| 3 Year | ₹18,473.4 | ₹20,961.5 |
| 5 Year | ₹29,351.6 | ₹31,635.5 |
| 10 Year | ₹87,409.2 | ₹71,377.3 |
Analysis:
- 1 Year: Nippon India Growth Fund demonstrates a higher lumpsum investment value of ₹15,343.3 compared to Kotak Emerging Equity Fund’s ₹13,652.2.
- 2 Years: Similarly, Nippon India Growth Fund maintains its lead with ₹17,935.8 while Kotak Emerging Equity Fund stands at ₹16,156.3.
- 3 Years: Nippon India Growth Fund continues to outperform Kotak Emerging Equity Fund with ₹20,961.5 against ₹18,473.4.
- 5 Years: Kotak Emerging Equity Fund narrows the gap with ₹29,351.6 versus Nippon India Growth Fund’s ₹31,635.5.
- 10 Years: Kotak Emerging Equity Fund surpasses Nippon India Growth Fund with ₹87,409.2 compared to ₹71,377.3.
Key Takeaways
- Investment Style: Both funds adopt a blended approach, offering a balanced mix of growth and value stocks.
- Returns Analysis: Nippon India Growth Fund outperforms Kotak Emerging Equity Fund in shorter investment periods, while Kotak Emerging Equity Fund shows resilience over longer investment horizons.
- Lumpsum Investment Value: Nippon India Growth Fund generally exhibits higher lumpsum investment values than Kotak Emerging Equity Fund, especially in shorter investment durations.
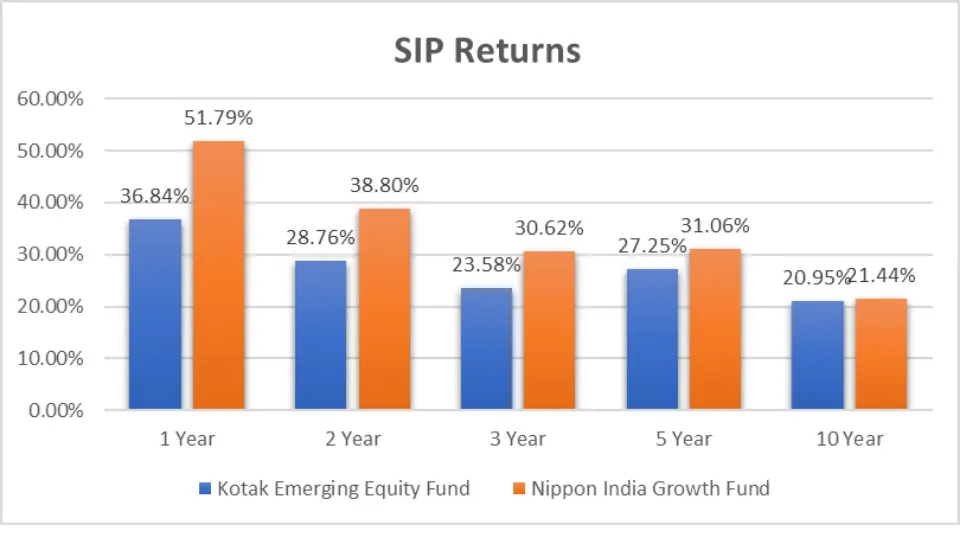
SIP Returns

| Period Invested for | Kotak Emerging Equity Fund | Nippon India Growth Fund |
| 1 Year | 36.84% | 51.79% |
| 2 Year | 28.76% | 38.80% |
| 3 Year | 23.58% | 30.62% |
| 5 Year | 27.25% | 31.06% |
| 10 Year | 20.95% | 21.44% |
Analysis:
- 1 Year: Nippon India Growth Fund outperforms Kotak Emerging Equity Fund with a higher SIP return of 51.79% compared to 36.84%.
- 2 Years: Again, Nippon India Growth Fund maintains its lead with a SIP return of 38.80%, while Kotak Emerging Equity Fund stands at 28.76%.
- 3 Years: Nippon India Growth Fund continues to outshine Kotak Emerging Equity Fund with a SIP return of 30.62% compared to 23.58%.
- 5 Years: Kotak Emerging Equity Fund narrows the gap slightly with a SIP return of 27.25% versus Nippon India Growth Fund’s 31.06%.
- 10 Years: Kotak Emerging Equity Fund shows resilience over the long term with a SIP return of 20.95% compared to Nippon India Growth Fund’s 21.44%.
SIP Investment Value
| Period Invested for | Investments | Kotak Emerging Equity Fund | Nippon India Growth Fund |
| 1 Year | ₹12,000 | ₹14,273.85 | ₹15,143.91 |
| 2 Years | ₹24,000 | ₹31,552.31 | ₹34,361.79 |
| 3 Years | ₹36,000 | ₹50,725.10 | ₹55,795.21 |
| 5 Years | ₹60,000 | ₹1,17,493.98 | ₹1,28,594.88 |
| 10 Years | ₹1,20,000 | ₹3,62,559.13 | ₹3,72,332.97 |
Analysis:
- 1 Year: Investing ₹12,000 in Nippon India Growth Fund yields a SIP investment value of ₹15,143.91. At the same time, the same amount in Kotak Emerging Equity Fund results in ₹14,273.85.
- 2 Years: Nippon India Growth Fund continues to lead, with ₹24,000 invested, growing to ₹34,361.79 compared to Kotak Emerging Equity Fund’s ₹31,552.31.
- 3 Years: Similarly, investing ₹36,000 in Nippon India Growth Fund results in a higher SIP investment value of ₹55,795.21, whereas Kotak Emerging Equity Fund stands at ₹50,725.10.
- 5 Years: Kotak Emerging Equity Fund narrows the gap slightly, with ₹60,000 growing to ₹1,17,493.98 versus Nippon India Growth Fund’s ₹1,28,594.88.
- 10 Years: Kotak Emerging Equity Fund surpasses Nippon India Growth Fund in SIP investment value, with ₹1,20,000 yielding ₹3,62,559.13 compared to ₹3,72,332.97.
Key Takeaways
- SIP Returns: Nippon India Growth Fund consistently outperforms Kotak Emerging Equity Fund in shorter investment periods, highlighting its potential for higher returns.
- SIP Investment Value: While Nippon India Growth Fund demonstrates higher SIP investment values in the short to medium term, Kotak Emerging Equity Fund emerges as the winner over longer investment horizons.
CAGR (Compounded Annual Growth Rate)

| Category | 1 Year | 3 Year | 5 Year | 9 Year |
| Kotak Emerging Equity Fund | 36.29% | 23.16% | 24.58% | 18.16% |
| Nippon India Growth Fund | 53.52% | 28.09% | 26.21% | 17.38% |
Analysis:
- 1 Year: Nippon India Growth Fund outperforms Kotak Emerging Equity Fund with a CAGR of 53.52% compared to 36.29%.
- 3 Years: Again, Nippon India Growth Fund maintains its lead with a CAGR of 28.09%, while Kotak Emerging Equity Fund stands at 23.16%.
- 5 Years: Nippon India Growth Fund continues to outshine Kotak Emerging Equity Fund with a CAGR of 26.21% compared to 24.58%.
- 9 Years: Kotak Emerging Equity Fund shows resilience over the long term with a CAGR of 18.16% compared to Nippon India Growth Fund’s 17.38%.
Rolling Returns

| Category | 1 Year | 3 Year | 5 Year | 9 Year |
| Kotak Emerging Equity Fund | 26.29% | 22.23% | 18.71% | 22.16% |
| Nippon India Growth Fund | 22.72% | 18.76% | 15.94% | 18.66% |
Analysis:
- 1 Year: Kotak Emerging Equity Fund exhibits higher rolling returns of 26.29% compared to Nippon India Growth Fund’s 22.72%.
- 3 Years: Again, Kotak Emerging Equity Fund leads with rolling returns of 22.23%, while Nippon India Growth Fund stands at 18.76%.
- 5 Years: Kotak Emerging Equity Fund maintains its lead with rolling returns of 18.71%, whereas Nippon India Growth Fund exhibits 15.94%.
- 9 Years: Kotak Emerging Equity Fund continues to outperform with rolling returns of 22.16%, compared to Nippon India Growth Fund’s 18.66%.
Annualized Results
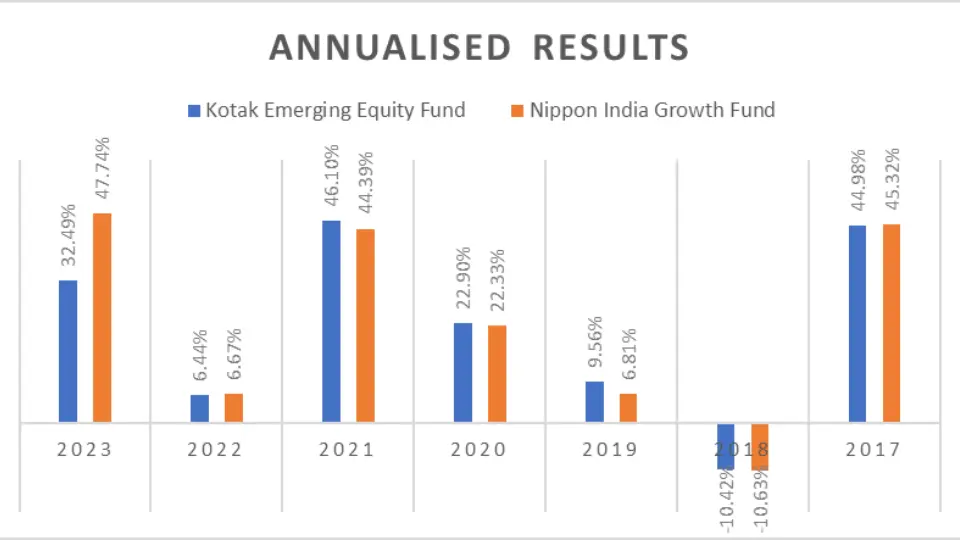
| Period | Kotak Emerging Equity Fund | Nippon India Growth Fund |
| 2023 | 32.49% | 47.74% |
| 2022 | 6.44% | 6.67% |
| 2021 | 46.10% | 44.39% |
| 2020 | 22.90% | 22.33% |
| 2019 | 9.56% | 6.81% |
| 2018 | -10.42% | -10.63% |
| 2017 | 44.98% | 45.32% |
Analysis:
- 2023: Nippon India Growth Fund outperforms Kotak Emerging Equity Fund with an annualized result of 47.74% compared to 32.49%.
- 2022: Both funds exhibit similar performance in 2022, with Kotak Emerging Equity Fund at 6.44% and Nippon India Growth Fund at 6.67%.
- 2021: Kotak Emerging Equity Fund leads in 2021 with an annualized result of 46.10%, slightly higher than Nippon India Growth Fund’s 44.39%.
- 2020: Again, Kotak Emerging Equity Fund outperforms Nippon India Growth Fund with 22.90% compared to 22.33%.
- 2019: Kotak Emerging Equity Fund exhibits a higher annualized result of 9.56%, whereas Nippon India Growth Fund stands at 6.81%.
- 2018: Both funds show negative annualized results, with Kotak Emerging Equity Fund at -10.42% and Nippon India Growth Fund at -10.63%.
- 2017: Nippon India Growth Fund marginally outperforms Kotak Emerging Equity Fund with an annualized result of 45.32% compared to 44.98%.
Number of Times Outperformance
| Kotak Emerging Equity Fund | Nippon India Growth Fund | |
| No. of times Outperformance | 4 | 3 |
Key Takeaways:
- CAGR: Nippon India Growth Fund exhibits higher CAGR across all periods, showcasing its potential for higher returns.
- Rolling Returns: Kotak Emerging Equity Fund consistently outperforms in rolling returns, indicating its stability over various time frames.
- Annualized Results: Performance varies over the years, with both funds showcasing strengths in different periods.
- Outperformance: Kotak Emerging Equity Fund outperforms Nippon India Growth Fund more times, consistently delivering superior returns.
Quarterly Results
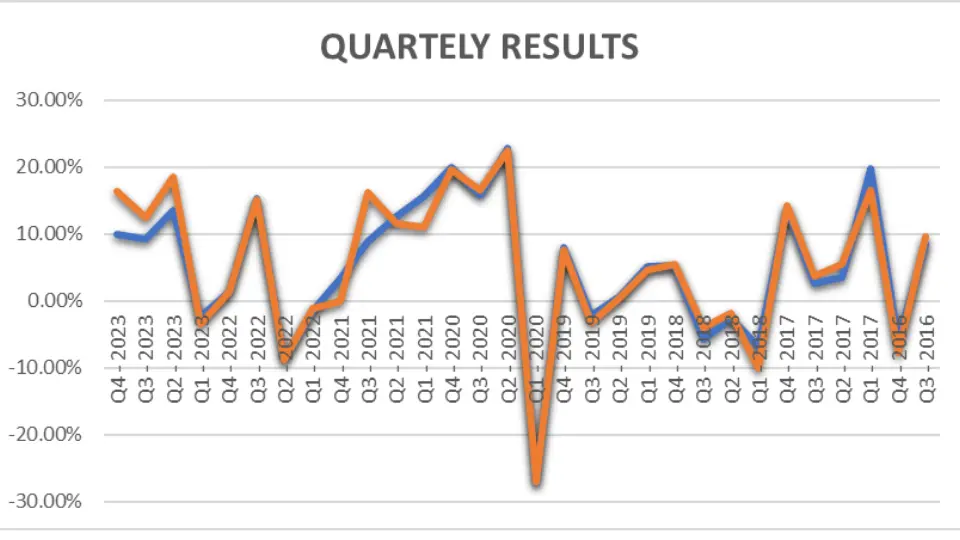
| Period | Kotak Emerging Equity Fund | Nippon India Growth Fund |
| Q4 – 2023 | 10.01% | 16.34% |
| Q3 – 2023 | 9.24% | 12.49% |
| Q2 – 2023 | 13.47% | 18.56% |
| Q1 – 2023 | -2.44% | -3.47% |
| Q4 – 2022 | 1.33% | 1.37% |
| Q3 – 2022 | 15.32% | 15.20% |
| Q2 – 2022 | -8.66% | -8.82% |
| Q1 – 2022 | -1.41% | -1.07% |
| Q4 – 2021 | 3.25% | -0.11% |
| Q3 – 2021 | 8.80% | 16.13% |
| Q2 – 2021 | 12.67% | 11.54% |
| Q1 – 2021 | 15.57% | 10.96% |
| Q4 – 2020 | 19.95% | 19.66% |
| Q3 – 2020 | 15.80% | 16.58% |
| Q2 – 2020 | 22.75% | 22.52% |
| Q1 – 2020 | -26.98% | -27.07% |
| Q4 – 2019 | 8.05% | 7.58% |
| Q3 – 2019 | -2.24% | -3.36% |
| Q2 – 2019 | 0.69% | 0.48% |
| Q1 – 2019 | 5.07% | 4.65% |
| Q4 – 2018 | 5.22% | 5.41% |
| Q3 – 2018 | -5.85% | -3.91% |
| Q2 – 2018 | -2.55% | -1.84% |
| Q1 – 2018 | -6.80% | -10.03% |
| Q4 – 2017 | 13.88% | 14.20% |
| Q3 – 2017 | 2.66% | 3.61% |
| Q2 – 2017 | 3.57% | 5.44% |
| Q1 – 2017 | 19.72% | 16.47% |
| Q4 – 2016 | -5.99% | -7.77% |
| Q3 – 2016 | 8.49% | 9.65% |
Analysis:
- Q4 – 2023: Nippon India Growth Fund outperforms Kotak Emerging Equity Fund with a quarterly return of 16.34% compared to 10.01%.
- Q3 – 2023: Nippon India Growth Fund maintains its lead with a quarterly return of 12.49%, while Kotak Emerging Equity Fund stands at 9.24%.
- Q2 – 2023: Nippon India Growth Fund continues to outshine Kotak Emerging Equity Fund with a quarterly return of 18.56% compared to 13.47%.
- Q1 – 2023: Both funds exhibit negative returns in Q1 – 2023, with Kotak Emerging Equity Fund at -2.44% and Nippon India Growth Fund at -3.47%.
Number of Times Outperformance
| Kotak Emerging Equity Fund | Nippon India Growth Fund | |
| Outperformance | 16 | 14 |
Key Takeaways:
- Quarterly Results: Nippon India Growth Fund showcases higher quarterly returns across various periods, indicating its potential for higher short-term gains.
- Number of Times Outperformance: Kotak Emerging Equity Fund outperforms Nippon India Growth Fund in quarterly returns more times, suggesting its consistency in delivering competitive results over time.
Best Quarters
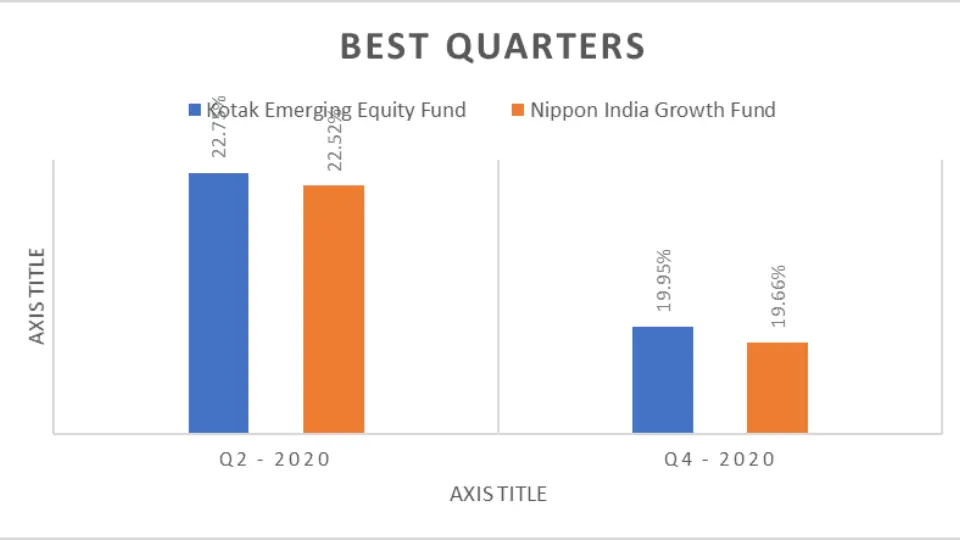
| Period | Kotak Emerging Equity Fund | Nippon India Growth Fund |
| Q2 – 2020 | 22.75% | 22.52% |
| Q4 – 2020 | 19.95% | 19.66% |
Analysis:
- Q2 – 2020: Both funds exhibited impressive performance in the second quarter of 2020, with Kotak Emerging Equity Fund at 22.75% and Nippon India Growth Fund at 22.52%.
- Q4 – 2020: Similarly, in the fourth quarter of 2020, both funds demonstrated strong returns, with Kotak Emerging Equity Fund at 19.95% and Nippon India Growth Fund at 19.66%.
Worst Quarters
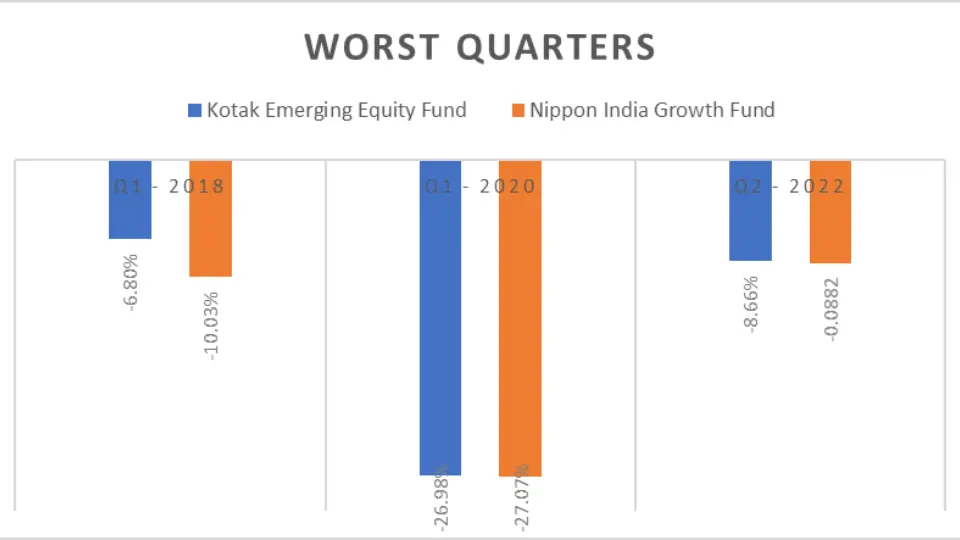
| Period | Kotak Emerging Equity Fund | Nippon India Growth Fund |
| Q1 – 2018 | -6.80% | -10.03% |
| Q1 – 2020 | -26.98% | -27.07% |
| Q2 – 2022 | -8.66% | -8.82% |
Analysis:
- Q1 – 2018: The first quarter of 2018 was challenging for both funds, with Kotak Emerging Equity Fund at -6.80% and Nippon India Growth Fund at -10.03%.
- Q1 – 2020: Both funds experienced significant downturns in the first quarter of 2020, with Kotak Emerging Equity Fund at -26.98% and Nippon India Growth Fund at -27.07%.
- Q2 – 2022: While both funds faced declines in the second quarter of 2022, Nippon India Growth Fund exhibited a slightly lower drawdown of -8.82% compared to Kotak Emerging Equity Fund’s -8.66%.
Risk Analysis
Maximum Drawdown
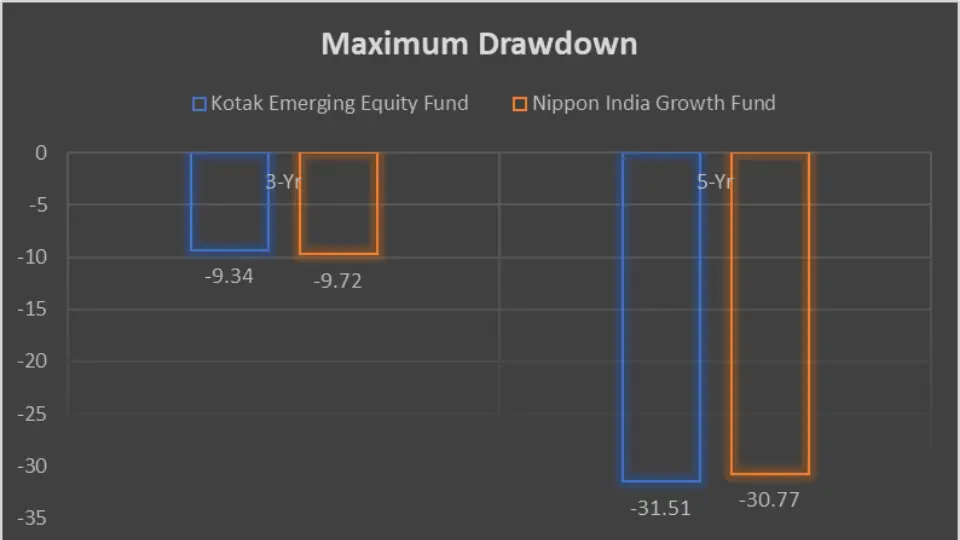
| 3-Year | 5-Year | |
| Kotak Emerging Equity Fund | -9.34 | -9.72 |
| Nippon India Growth Fund | -31.51 | -30.77 |
Analysis:
- 3-Year Maximum Drawdown: Kotak Emerging Equity Fund experienced a maximum drawdown of -9.34% over 3 years, while Nippon India Growth Fund faced a more significant drawdown of -31.51%.
- 5-Year Maximum Drawdown: Similarly, over 5 years, Kotak Emerging Equity Fund had a maximum drawdown of -9.72%, while Nippon India Growth Fund’s drawdown was slightly higher at -30.77%.
Key Takeaways:
- Best Quarters: Both funds showcased strong performance during certain quarters, reflecting their potential for generating significant returns during favourable market conditions.
- Worst Quarters: Investors should be prepared for periods of downturn, as evidenced by the significant drawdowns experienced by both funds during specific quarters.
- Maximum Drawdown: Nippon India Growth Fund exhibited higher maximum drawdowns over both 3-year and 5-year periods, indicating greater volatility than Kotak Emerging Equity Fund.
Mean Return, Sortino Ratio, and Treynor’s Ratio
Understanding the associated risks is as crucial as analyzing returns regarding mutual fund investments. Let’s delve into a comparative analysis of the risk metrics of Kotak Emerging Equity Fund and Nippon India Growth Fund to gain insights into their risk-adjusted performance.
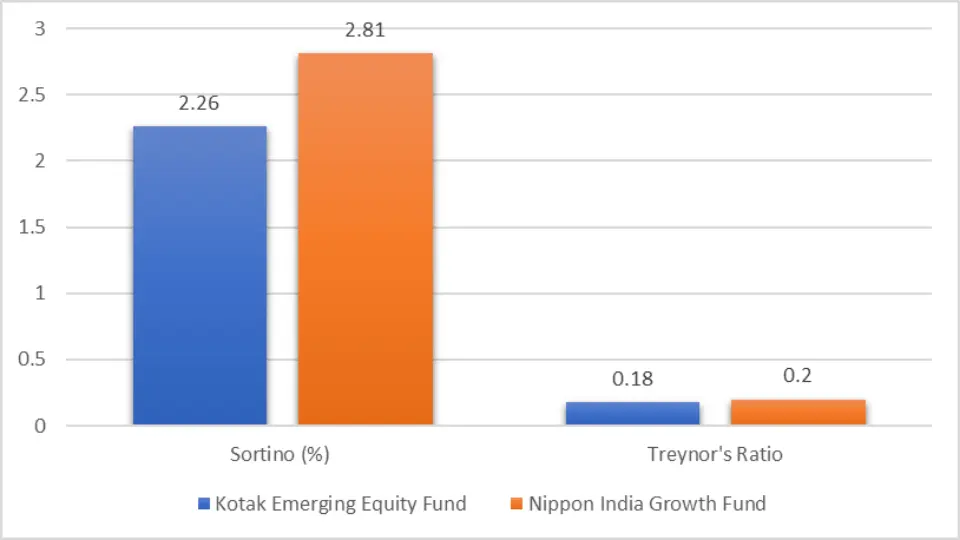
| Metric | Kotak Emerging Equity Fund | Nippon India Growth Fund |
| Mean Return (%) | 22.12 | 26.4 |
| Sortino Ratio | 2.26 | 2.81 |
| Treynor’s Ratio | 0.18 | 0.2 |
Analysis:
- Mean Return: Nippon India Growth Fund exhibits a higher mean return of 26.4% compared to Kotak Emerging Equity Fund’s 22.12%.
- Sortino Ratio: Both funds showcase strong Sortino ratios, indicating the risk-adjusted Return per unit of downside risk. Nippon India Growth Fund’s ratio stands slightly higher at 2.81, surpassing Kotak Emerging Equity Fund’s 2.26.
- Treynor’s Ratio: Nippon India Growth Fund also outperforms Kotak Emerging Equity Fund in terms of Treynor’s ratio, indicating superior risk-adjusted returns per unit of systematic risk.
Standard Deviation

| Metric | Kotak Emerging Equity Fund | Nippon India Growth Fund |
| Std Dev (%) 3Y | 11.85 | 13.98 |
| Std Dev (%) 5Y | 20.37 | 21.02 |
| Std Dev (%) 10Y | 18.52 | 19.16 |
Analysis:
- Standard Deviation: Kotak Emerging Equity Fund demonstrates a lower standard deviation across all time frames, indicating lower volatility than Nippon India Growth Fund.
Sharpe Ratio
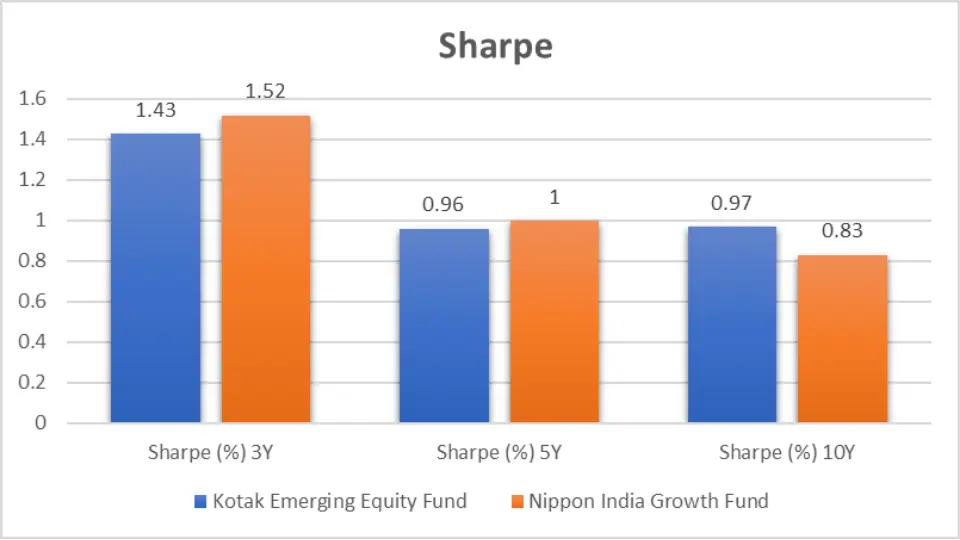
| Metric | Kotak Emerging Equity Fund | Nippon India Growth Fund |
| Sharpe (%) 3Y | 1.43 | 1.52 |
| Sharpe (%) 5Y | 0.96 | 1 |
| Sharpe (%) 10Y | 0.97 | 0.83 |
Analysis:
- Sharpe Ratio: Nippon India Growth Fund exhibits higher Sharpe ratios across all time frames, indicating better risk-adjusted returns per unit of risk than Kotak Emerging Equity Fund.
Beta

| Metric | Kotak Emerging Equity Fund | Nippon India Growth Fund |
| Beta (%) 3Y | 0.75 | 0.9 |
| Beta (%) 5Y | 0.92 | 0.96 |
| Beta (%) 10Y | 0.91 | 0.95 |
Analysis:
- Beta: Both funds showcase betas lower than 1, indicating lower volatility than the market. However, Nippon India Growth Fund’s beta values are slightly higher across all time frames, suggesting relatively higher volatility than Kotak Emerging Equity Fund.
Alpha
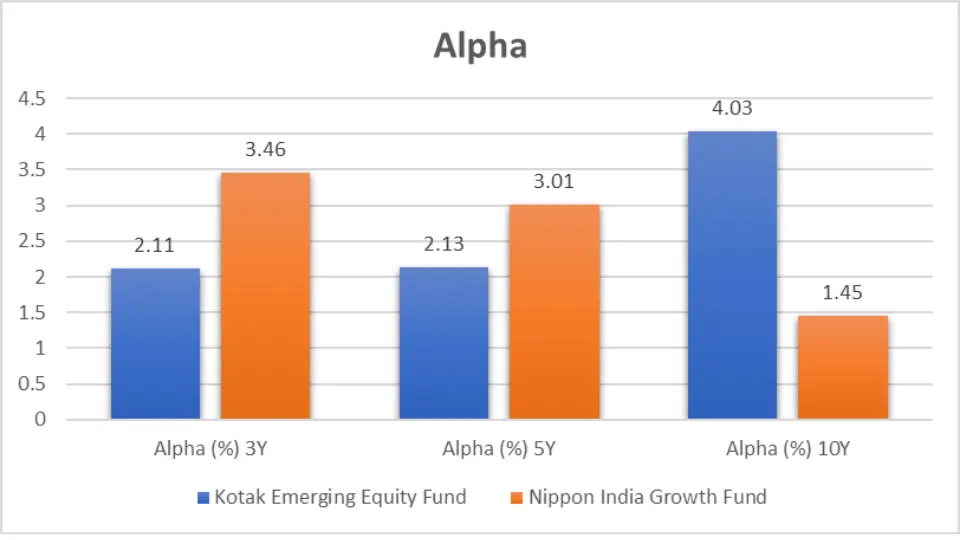
| Metric | Kotak Emerging Equity Fund | Nippon India Growth Fund |
| Alpha (%) 3Y | 2.11 | 3.46 |
| Alpha (%) 5Y | 2.13 | 3.01 |
| Alpha (%) 10Y | 4.03 | 1.45 |
Analysis:
- Alpha: Kotak Emerging Equity Fund demonstrates higher alpha values across all time frames, indicating its ability to generate excess returns above the market compared to the Nippon India Growth Fund.
Key Takeaways:
- Risk-Adjusted Returns: While Nippon India Growth Fund exhibits higher mean returns, Sortino and Treynor ratios, Kotak Emerging Equity Fund showcases lower volatility and higher alpha values, indicating its potential for generating excess returns.
- Volatility: Kotak Emerging Equity Fund demonstrates lower standard deviation and beta values, suggesting relatively lower volatility than Nippon India Growth Fund.
- Sharpe Ratio: Nippon India Growth Fund outperforms Kotak Emerging Equity Fund in terms of Sharpe ratio, indicating superior risk-adjusted returns per unit of risk.
Star Ratings Comparison
| Ratings Source | Kotak Emerging Equity Fund | Nippon India Growth Fund |
|---|---|---|
| CRISIL Ratings (as on 31st Mar 2024) | ⭐⭐☆☆☆ | ⭐⭐⭐⭐☆ |
| CRISIL Ratings (as on 31st Dec 2023) | ⭐⭐☆☆☆ | ⭐⭐⭐⭐⭐ |
| CRISIL Ratings (as on 30th Sep 2023) | ⭐⭐⭐☆☆ | ⭐⭐⭐⭐☆ |
| CRISIL Ratings (as on 30th Jun 2023) | ⭐⭐⭐⭐☆ | ⭐⭐⭐⭐☆ |
| CRISIL Ratings (as on 31st Mar 2023) | ⭐⭐⭐⭐☆ | ⭐⭐⭐⭐☆ |
| Value Research Ratings | ⭐⭐⭐⭐☆ | ⭐⭐⭐⭐☆ |
| Morning Star Ratings | ⭐⭐⭐⭐☆ | ⭐⭐⭐⭐☆ |
| Economic Times Ratings | ⭐⭐⭐⭐☆ | ⭐⭐⭐⭐☆ |
| Groww Ratings | ⭐⭐⭐⭐☆ | ⭐⭐⭐⭐☆ |
| AngelOne AQR Ratings | ⭐⭐⭐☆ | ⭐⭐⭐⭐☆ |
| 5Paisa Ratings | ⭐⭐⭐⭐☆ | ⭐⭐⭐⭐☆ |
| KUVERA ratings | ⭐⭐⭐⭐☆ | ⭐⭐⭐⭐☆ |
| Average Ratings | ⭐⭐⭐½ | ⭐⭐⭐⭐☆ |
Analysis:
- CRISIL Ratings: Kotak Emerging Equity Fund holds a lower CRISIL rating than Nippon India Growth Fund, indicating potentially higher risk associated with the former.
- Value Research and Morning Star Ratings: Both funds hold similar ratings from Value Research and Morning Star.
Portfolio Analysis
Portfolio Overlap
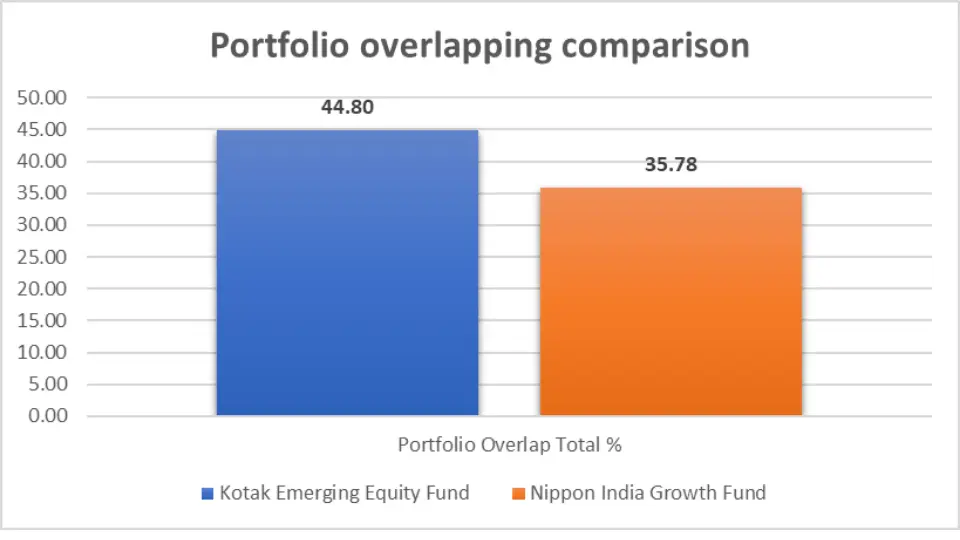
| Kotak Emerging Equity Fund | Nippon India Growth Fund | |
| Portfolio Overlap Total % | 44.80 | 35.78 |
Analysis:
- Portfolio Overlap: Kotak Emerging Equity Fund exhibits a higher portfolio overlap percentage than Nippon India Growth Fund, suggesting potentially similar holdings among different funds.
Asset Allocation
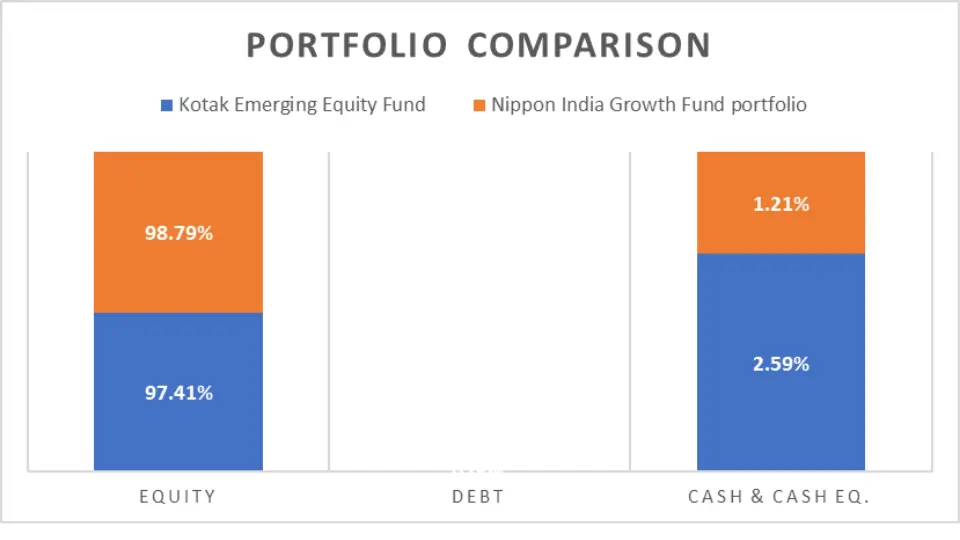
| Kotak Emerging Equity Fund | Nippon India Growth Fund | |
| Equity | 97.41% | 98.79% |
| Debt | 0.00% | 0.00% |
| Cash & Cash Eq. | 2.59% | 1.21% |
Analysis:
- Equity Allocation: Both funds primarily allocate their assets to equity, with Nippon India Growth Fund having a slightly higher allocation than Kotak Emerging Equity Fund.
- Debt and Cash Allocation: Both funds have negligible debt and cash equivalent allocations.
Market Cap Allocation

| Kotak Emerging Equity Fund | Nippon India Growth Fund | |
| No of Stocks | 78 | 95 |
| Large Cap | 6.66% | 13.79% |
| Mid Cap | 55.96% | 50.45% |
| Small Cap | 23.17% | 13.80% |
Analysis:
- Number of Stocks: Nippon India Growth Fund holds more stocks than Kotak Emerging Equity Fund, indicating potentially greater diversification.
- Market Cap Allocation: Both funds exhibit allocations across large, mid, and small-cap stocks, with varying percentages.
Sector Allocation

| Sector | Kotak Emerging Equity Fund | Nippon India Growth Fund |
| Capital Goods | 19.12% | 7.17% |
| Financial | 13.74% | 21.70% |
| Materials | 10.60% | 6.03% |
| Chemicals | 9.83% | 3.79% |
| Consumer Discretionary | 9.38% | 3.07% |
| Automobile | 7.65% | 10.34% |
| Healthcare | 6.38% | 12.13% |
| Technology | 6.02% | 4.66% |
| Metals & Mining | 4.13% | 1.60% |
| Construction | 2.96% | 2.65% |
| Energy | 2.31% | 4.65% |
| Consumer Staples | 1.64% | 4.11% |
| Services | 1.54% | 12.79% |
| Diversified | 1.06% | 0.85% |
| Textiles | 1.05% | 1.36% |
| Communication | NA | 1.42% |
| Insurance | NA | 0.47% |
Analysis:
- Sector Allocation: Both funds have varying sector allocations, with notable differences in sectors such as capital goods, financials, and healthcare.
Key Takeaways:
- Ratings: Nippon India Growth Fund holds higher CRISIL ratings, potentially indicating lower risk than Kotak Emerging Equity Fund.
- Portfolio Overlap: Kotak Emerging Equity Fund exhibits higher portfolio overlap than Nippon India Growth Fund.
- Sector Allocation: Both funds have diverse sector allocations, varying percentages across different sectors.
Fund Management
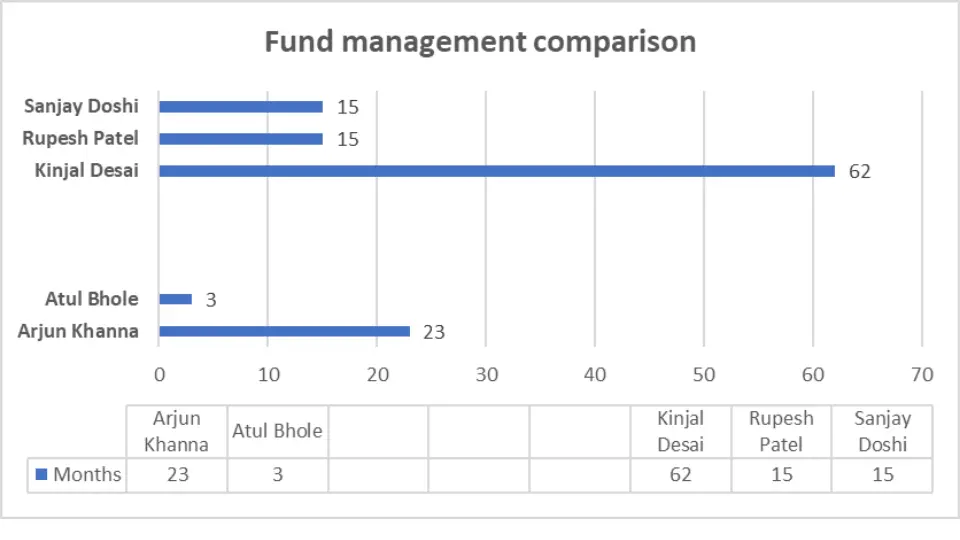
Analysis:
- Kotak Emerging Equity Fund: Managed by Arjun Khanna for 23 months and Atul Bhole for 3 months.
- Nippon India Growth Fund: Managed by Kinjal Desai for 62 months, Rupesh Patel for 15 months, and Sanjay Doshi for 15 months.
General Details

| Kotak Emerging Equity Fund | Nippon India Growth Fund | |
| NAV | ₹ 117.64 | ₹ 3535.82 |
| AUM (in Cr.) | ₹ 39738 | ₹ 24480 |
| Expense Ratio (%) | 0.38 | 0.86 |
| Turnover | 9.65% | 17% |
| Benchmark | Nifty Midcap 150 – TRI | Nifty Midcap 150 – TRI |
Analysis:
- Net Asset Value (NAV): Kotak Emerging Equity Fund has a lower NAV than Nippon India Growth Fund.
- Assets Under Management (AUM): Kotak Emerging Equity Fund has a higher AUM than Nippon India Growth Fund.
- Expense Ratio: Kotak Emerging Equity Fund has a lower expense ratio, potentially lowering investor costs.
- Turnover: Kotak Emerging Equity Fund has a lower turnover rate than Nippon India Growth Fund.
- Benchmark: Both funds benchmark against Nifty Midcap 150 – TRI.
Minimum Investment Amount

| Minimum Investment Amount | Kotak Emerging Equity Fund | Nippon India Growth Fund |
| SIP | ₹ 100 | ₹ 100 |
| Lumpsum | ₹ 100 | ₹ 100 |
Analysis:
- Kotak Emerging Equity Fund and Nippon India Growth Fund have the exact minimum requirements for SIP and lump sum investments.
Key Takeaways:
- Fund Management: Nippon India Growth Fund has a more experienced team of fund managers, with the lead manager having significantly more months of experience compared to Kotak Emerging Equity Fund.
- General Details: While Kotak Emerging Equity Fund has a lower NAV and higher AUM, it also boasts a lower expense ratio and turnover rate, potentially offering cost-effective investment opportunities.
- Minimum Investment: Both funds have the exact minimum investment requirements, providing accessibility to investors across different investment preferences.
Conclusion
In conclusion, the comparative analysis between Kotak Emerging Equity Fund and Nippon India Growth Fund reveals nuanced differences catering to various investor preferences. While Nippon India Growth Fund exhibits higher returns in shorter durations and holds favourable ratings, Kotak Emerging Equity Fund demonstrates resilience over longer horizons with lower volatility and higher alpha values.
Investors seeking short-term gains and lower risk may find Nippon India Growth Fund more appealing. In contrast, those with a longer investment horizon and a preference for stability might opt for Kotak Emerging Equity Fund. Choosing between these funds ultimately hinges on individual risk appetite, investment goals, and time horizon.

We hope you found this guide on mutual funds helpful.
If you have any mutual fund-related queries, feel free to comment below—we’re here to help! S.K. Singh, a registered professional with the Association of Mutual Funds in India (AMFI), will answer your queries and holds the ARN-251149.
Invest wisely!
FAQs – Kotak Emerging Equity Fund vs Nippon India Growth Fund
What is the investment style of Kotak Emerging Equity Fund and Nippon India Growth Fund?
Kotak Emerging Equity Fund and Nippon India Growth Fund follow a blended investment approach, investing in a mix of growth and value stocks for balanced portfolio growth.
Which fund shows better returns over various periods, Kotak Emerging Equity Fund or Nippon India Growth Fund?
Nippon India Growth Fund generally outperforms Kotak Emerging Equity Fund in shorter investment durations. At the same time, Kotak Emerging Equity Fund demonstrates resilience and higher returns over longer investment horizons.
For investors interested in SIPs, which fund offers better returns?
Nippon India Growth Fund consistently outperforms Kotak Emerging Equity Fund in SIP returns across various investment periods, indicating its potential for higher returns through systematic investments.
Which fund has lower volatility and higher alpha values?
Kotak Emerging Equity Fund demonstrates lower volatility and higher alpha values than Nippon India Growth Fund, suggesting it may be more suitable for investors seeking stability and excess returns.
Considering risk-adjusted performance, which fund stands out?
While Nippon India Growth Fund exhibits higher mean returns and superior Sortino and Treynor ratios, Kotak Emerging Equity Fund showcases lower volatility and higher alpha values, indicating better risk-adjusted performance.
How do the CRISIL ratings compare between Kotak Emerging Equity Fund and Nippon India Growth Fund?
Nippon India Growth Fund holds higher CRISIL ratings, potentially indicating lower risk than Kotak Emerging Equity Fund.
What are the critical differences in sector allocation between the two funds?
Both funds have diverse sector allocations, with notable differences in sectors such as capital goods, financials, and healthcare, reflecting their distinct investment strategies.
Which fund has a more experienced team of fund managers?
Nippon India Growth Fund has a more experienced team of fund managers, with the lead manager having significantly more months of experience than Kotak Emerging Equity Fund.
Are there any differences in the expense ratio and turnover rate between the two funds?
Yes, Kotak Emerging Equity Fund has a lower expense ratio and turnover rate than Nippon India Growth Fund, potentially offering cost-effective investment opportunities for investors.
Disclaimer:
The information provided in this article is solely the author/advertisers’ opinion and not investment advice – it is provided for educational purposes only. Using this, you agree that the information does not constitute any investment or financial instructions by Ace Equity Research/Mutual Fund Focus/IPO First and the team. Anyone wishing to invest should seek their own independent financial or professional advice. Conduct your research with registered financial advisors before making any investment decisions. Ace Equity Research/ Mutual Fund Focus / IPO First and the team are not accountable for the investment views provided in the article.
Mutual Fund investments are subject to market risks. Read all scheme-related documents carefully.
Investments in the securities market are subject to market risks. Read all the related documents carefully before investing.
