Introduction
If you are planning to invest in ELSS (Equity Linked Savings Scheme) tax saver funds and need clarification on the differences between SBI Long Term Equity Fund vs Quant ELSS Tax Saver Fund. In that case, you’ve come to the right place. This blog will resolve all your doubts with an in-depth, data-driven analysis of these two funds. We’ll dive deep into a comprehensive five-step comparative analysis to help you choose the most consistent and best ELSS tax-saver mutual funds for your long-term investment portfolio. We’ll focus on investment styles, returns, and more to ensure you make an informed decision.
Investment Style
Before we get into the nitty-gritty details, let’s understand the investment styles of these two funds.
| Fund | Investment Style |
| Quant ELSS Tax Saver Fund | Blend |
| SBI Long-Term Equity Fund | Blend |
Both funds follow a blended investment style, meaning they invest in a mix of growth and value stocks, providing a balanced approach to your investment.

Returns Analysis
Trailing Returns
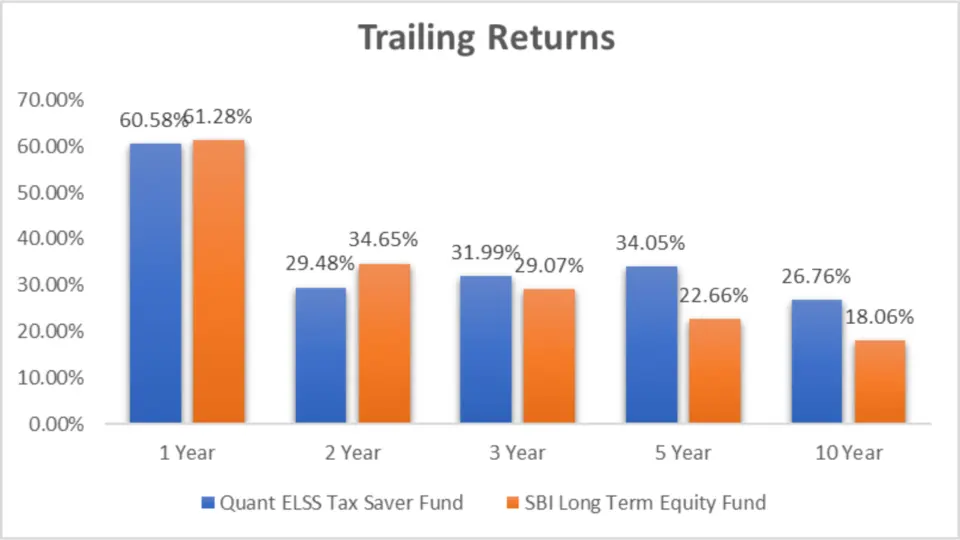
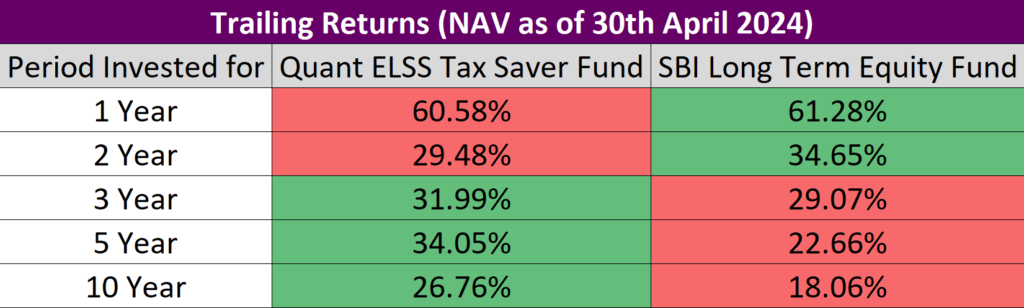
Returns are a crucial factor when it comes to mutual funds. Let’s analyze the trailing returns as of 30th April 2024.
Analysis
- 1 Year: Both funds performed exceptionally well, with SBI Long Term Equity Fund slightly edging out with 61.28% compared to Quant ELSS’s 60.58%.
- 2 Year: SBI Long Term Equity Fund leads 34.65%, while Quant ELSS shows 29.48%.
- 3 Year: Quant ELSS takes the lead here with 31.99%, surpassing SBI Long Term’s 29.07%.
- 5 Year: Quant ELSS continues its strong performance with 34.05%, significantly higher than SBI Long Term’s 22.66%.
- 10 Year: Over the long term, Quant ELSS shows a robust 26.76%, while SBI Long Term lags 18.06%.
Lumpsum Investment Value
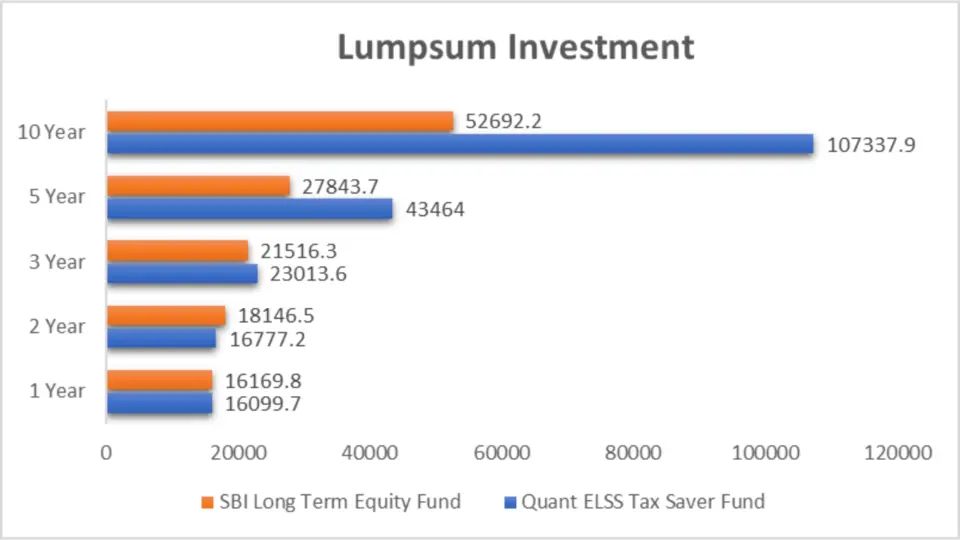
Let’s see how much your investment would be worth over different periods if you invested a lump sum.
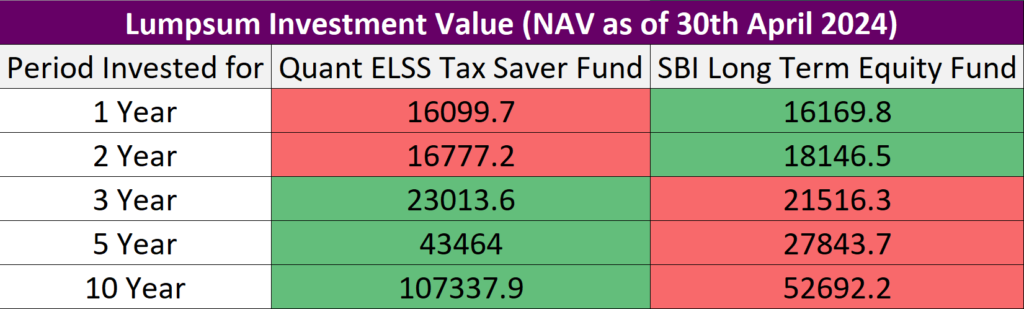
Analysis
- 1 Year: Small difference, with SBI Long Term Equity slightly ahead.
- 2 Year: SBI Long Term Equity takes the lead with a higher value.
- 3 Year: Quant ELSS outperforms with a value of ₹23,013.6.
- 5 Year: Quant ELSS shows a significant lead with ₹43,464.
- 10 Year: Quant ELSS more than doubles the value of SBI Long Term with ₹1,07,337.9 compared to ₹52,692.2.
Key Takeaways
- Short-term performance: Both funds show a solid short-term performance, but the SBI Long Term Equity Fund has a slight edge in the 1-year and 2-year periods.
- Medium to long-term performance: Quant ELSS Tax Saver Fund clearly outperforms SBI Long Term Equity Fund in the 3-year, 5-year, and 10-year periods.
- Investment value: Over extended periods, the Quant ELSS Tax Saver Fund provides significantly higher investment value than the SBI Long Term Equity Fund.
SIP Returns Analysis
Understanding SIP returns is crucial for evaluating the performance of mutual funds. Let’s look at the SIP returns as of 30th April 2024.
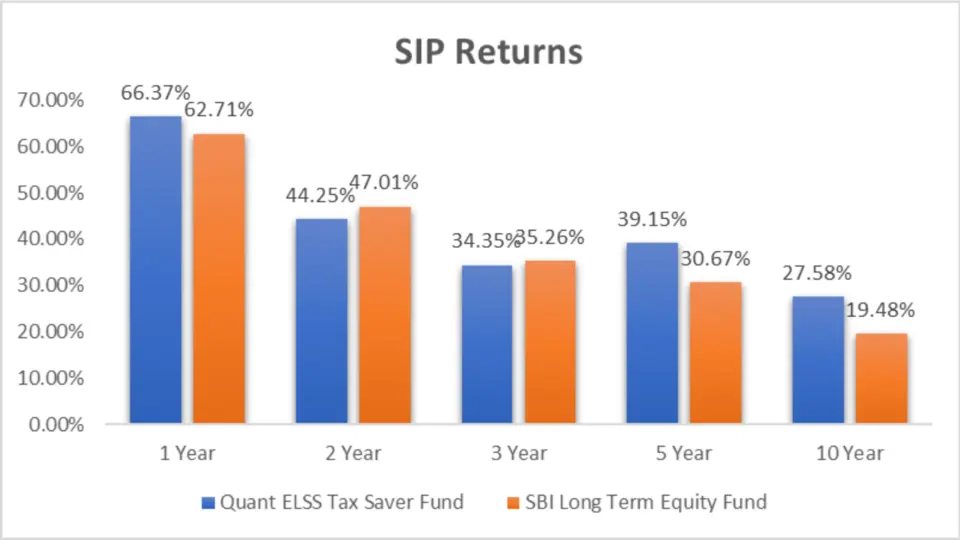
| Period Invested for | Quant ELSS Tax Saver Fund | SBI Long-Term Equity Fund |
| 1 Year | 66.37% | 62.71% |
| 2 Year | 44.25% | 47.01% |
| 3 Year | 34.35% | 35.26% |
| 5 Year | 39.15% | 30.67% |
| 10 Year | 27.58% | 19.48% |
Analysis
- 1 Year: Quant ELSS Tax Saver Fund slightly outperforms with a 66.37% return compared to SBI Long Term Equity Fund’s 62.71%.
- 2 Year: SBI Long Term Equity Fund takes the lead with a 47.01% return, while Quant ELSS shows 44.25%.
- 3 Year: Both funds are closely matched, but SBI Long Term Equity Fund edges ahead with 35.26% versus Quant ELSS’s 34.35%.
- 5 Year: Quant ELSS shines with a 39.15% return, significantly higher than SBI Long Term’s 30.67%.
- 10 Year: Quant ELSS provides a robust 27.58% return over the long term, outpacing SBI Long Term’s 19.48%.
SIP Investment Value
To better understand the impact of these returns, let’s look at how much your investments would be worth over different periods.
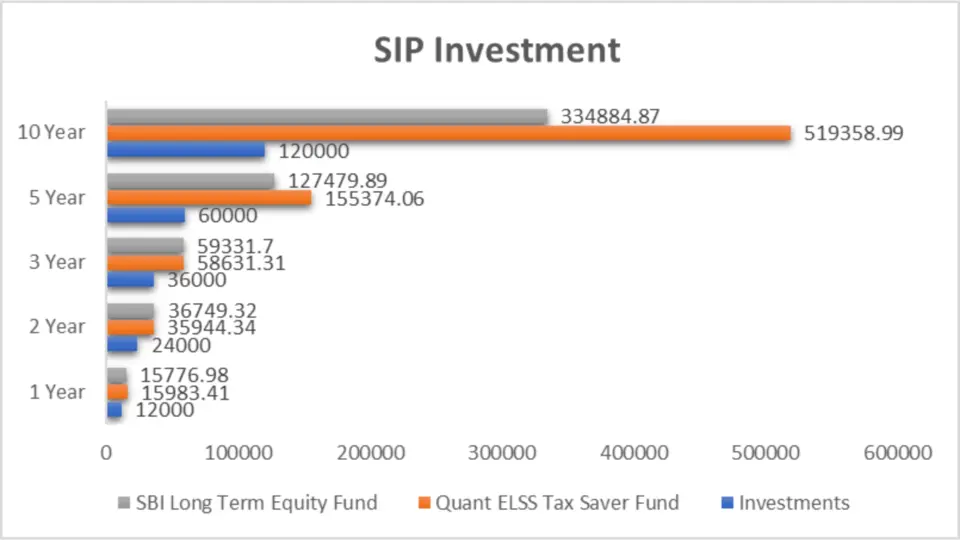
| Period Invested for | Investments (₹) | Quant ELSS Tax Saver Fund | SBI Long-Term Equity Fund |
| 1 Year | 12,000 | 15,983.41 | 15,776.98 |
| 2 Year | 24,000 | 35,944.34 | 36,749.32 |
| 3 Year | 36,000 | 58,631.31 | 59,331.7 |
| 5 Year | 60,000 | 1,55,374.06 | 1,27,479.89 |
| 10 Year | 1,20,000 | 5,19,358.99 | 3,34,884.87 |
Analysis
- 1 Year: Both funds offer similar value, with Quant ELSS slightly ahead at ₹15,983.41 versus SBI Long Term’s ₹15,776.98.
- 2 Year: SBI Long Term Equity Fund takes a small lead, providing ₹36,749.32 compared to Quant ELSS’s ₹35,944.34.
- 3 Year: SBI Long Term Equity Fund maintains a slight advantage with ₹59,331.7, while Quant ELSS offers ₹58,631.31.
- 5 Year: Quant ELSS significantly outperforms with a value of ₹1,55,374.06, compared to SBI Long Term’s ₹1,27,479.89.
- 10 Year: Quant ELSS stands out dramatically, offering ₹5,19,358.99 compared to SBI Long Term’s ₹3,34,884.87.
Key Takeaways
- Short-term performance: Quant ELSS Tax Saver Fund performs slightly better in the 1 year, but SBI Long Term Equity Fund takes the lead in the 2-year and 3-year periods.
- Medium-term performance: Quant ELSS starts to outperform from the 5 years onwards, showing its strength as a medium to long-term investment.
- Long-term performance: Over 10 years, Quant ELSS Tax Saver Fund significantly outperforms SBI Long Term Equity Fund, making it a strong choice for long-term investors.
- Investment value: The SIP investment value analysis highlights Quant ELSS’s superior performance over longer investment horizons, making it more attractive for those looking to invest for 5 years or more.
Compound Annual Growth Rate (CAGR)
CAGR helps in understanding an investment’s mean annual growth rate over a period longer than one year. Let’s examine the CAGR of these funds.

| Category | 1 Year | 3 Year | 5 Year | 9 Year |
| Quant ELSS Tax Saver Fund | 56.94% | 32.80% | 32.22% | 23.41% |
| SBI Long-Term Equity Fund | 60.28% | 27.69% | 21.49% | 14.71% |
Analysis
- 1 Year: SBI Long Term Equity Fund slightly outperforms with a 60.28% CAGR, compared to Quant ELSS’s 56.94%.
- 3 Year: Quant ELSS leads with a 32.80% CAGR, surpassing SBI Long Term’s 27.69%.
- 5 Year: Quant ELSS continues to dominate with a 32.22% CAGR, significantly higher than SBI Long Term’s 21.49%.
- 9 Year: Quant ELSS maintains its lead with a 23.41% CAGR, compared to SBI Long Term’s 14.71%.
Rolling Returns
Rolling returns provide a more dynamic view of performance by calculating returns over different periods starting at various points in time. Here’s a look at the rolling returns for both funds.
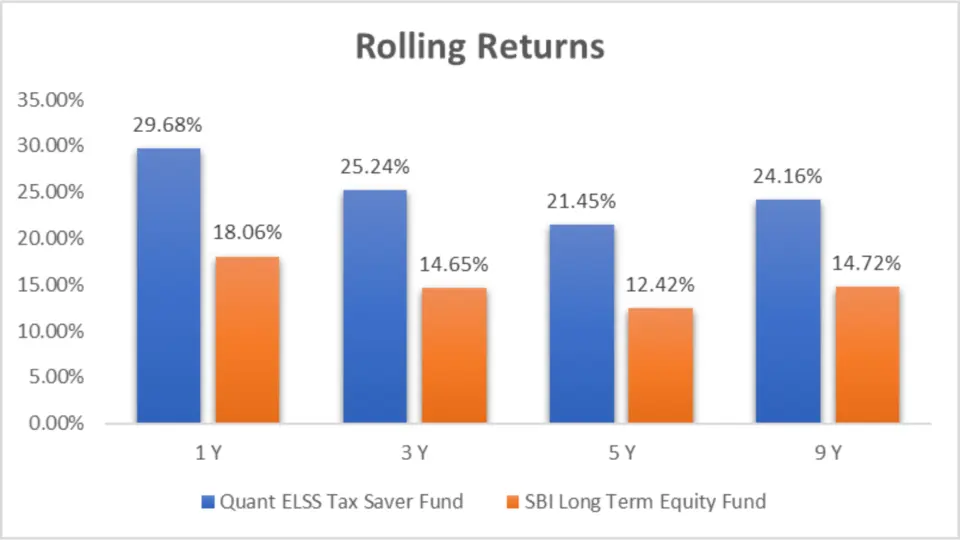
| Category | 1 Year | 3 Year | 5 Year | 9 Year |
| Quant ELSS Tax Saver Fund | 29.68% | 25.24% | 21.45% | 24.16% |
| SBI Long-Term Equity Fund | 18.06% | 14.65% | 12.42% | 14.72% |
Analysis
- 1 Year: Quant ELSS outshines with a 29.68% rolling return, while SBI Long Term shows 18.06%.
- 3 Year: Quant ELSS again leads with a 25.24% rolling return, compared to SBI Long Term’s 14.65%.
- 5 Year: Quant ELSS maintains a strong performance with a 21.45% rolling return, significantly higher than SBI Long Term’s 12.42%.
- 9 Year: Quant ELSS continues its superior performance with a 24.16% rolling return, compared to SBI Long Term’s 14.72%.
Key Takeaways
- Short-term performance: For 1 year, SBI Long Term Equity Fund has a slight edge in CAGR, but Quant ELSS Tax Saver Fund excels in rolling returns.
- Medium-term performance: Over 3 and 5 years, Quant ELSS Tax Saver Fund consistently outperforms SBI Long Term Equity Fund in both CAGR and rolling returns.
- Long-term performance: For periods up to 9 years, Quant ELSS Tax Saver Fund shows a clear advantage, making it a compelling choice for long-term investors.
Annualized/Calendar Year Returns
Understanding a fund’s yearly performance helps evaluate its consistency and resilience over different market conditions. Let’s look at these funds’ annualized returns as of 30th April 2024.
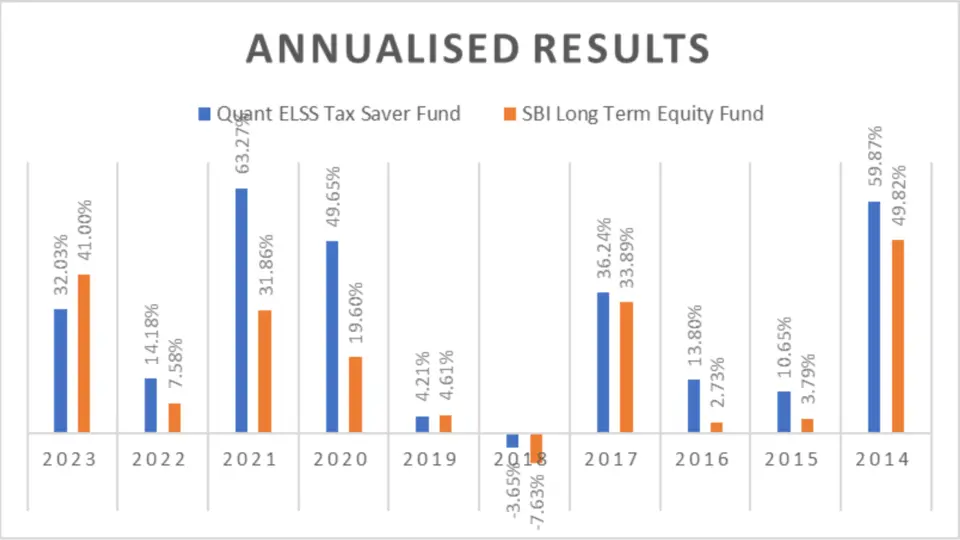
| Period | Quant ELSS Tax Saver Fund | SBI Long-Term Equity Fund |
| 2023 | 32.03% | 41.00% |
| 2022 | 14.18% | 7.58% |
| 2021 | 63.27% | 31.86% |
| 2020 | 49.65% | 19.60% |
| 2019 | 4.21% | 4.61% |
| 2018 | -3.65% | -7.63% |
| 2017 | 36.24% | 33.89% |
| 2016 | 13.80% | 2.73% |
| 2015 | 10.65% | 3.79% |
| 2014 | 59.87% | 49.82% |
Analysis
- 2023: SBI Long Term Equity Fund leads with a 41.00% return, compared to Quant ELSS’s 32.03%.
- 2022: Quant ELSS outperforms with 14.18%, while SBI Long Term shows 7.58%.
- 2021: Quant ELSS significantly outperforms with 63.27% versus SBI Long Term’s 31.86%.
- 2020: Quant ELSS excels with a 49.65% return, compared to SBI Long Term’s 19.60%.
- 2019: SBI Long Term edges ahead with 4.61%, while Quant ELSS shows 4.21%.
- 2018: Quant ELSS performs better at 3.65% compared to SBI Long Term’s 7.63%.
- 2017: Quant ELSS outperforms with 36.24%, while SBI Long Term has 33.89%.
- 2016: Quant ELSS leads with 13.80%, significantly higher than SBI Long Term’s 2.73%.
- 2015: Quant ELSS outperforms with 10.65%, compared to SBI Long Term’s 3.79%.
- 2014: Quant ELSS shines with a 59.87% return, surpassing SBI Long Term’s 49.82%.
Outperformance Summary
| Fund | No. of times Outperformance |
| Quant ELSS Tax Saver Fund | 8 |
| SBI Long-Term Equity Fund | 2 |
Best Quarters
Analysing the best-performing quarters can give insights into a fund’s potential during market upswings.

| Period | Quant ELSS Tax Saver Fund | SBI Long-Term Equity Fund |
| Q2 – 2020 | 35.17% | 25.58% |
Worst Quarters
Examining the worst-performing quarters helps understand how the funds react during market downturns.
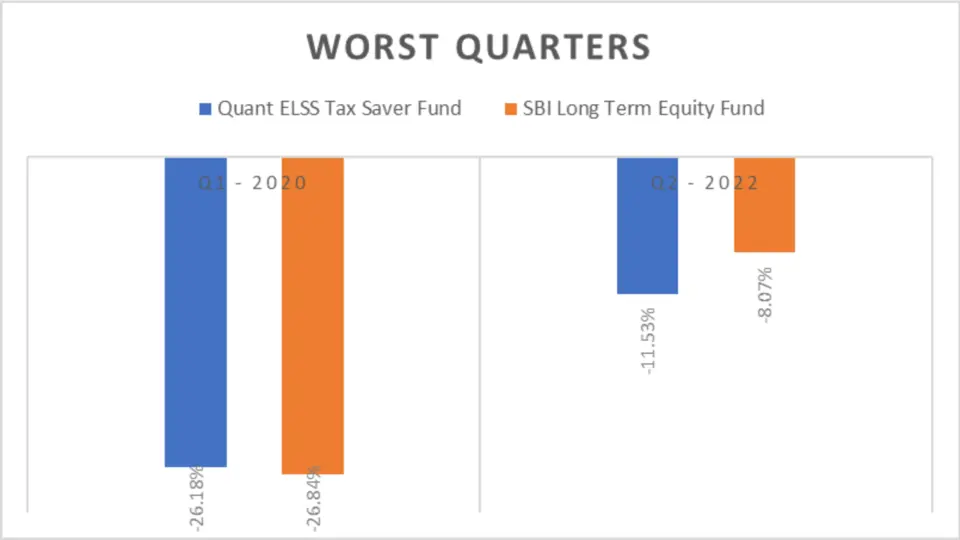
| Period | Quant ELSS Tax Saver Fund | SBI Long-Term Equity Fund |
| Q1 – 2020 | -26.18% | -26.84% |
| Q2 – 2022 | -11.53% | -8.07% |
Key Takeaways
- Short-term performance: In 2023, SBI Long Term Equity Fund outperformed Quant ELSS Tax Saver Fund. However, Quant ELSS has shown resilience and better returns in many of the preceding years.
- Medium-term performance: Quant ELSS Tax Saver Fund consistently outperforms SBI Long Term Equity Fund in most analyzed years, making it a robust choice for medium-term investments.
- Long-term performance: Over the long term, Quant ELSS Tax Saver Fund has demonstrated superior performance in terms of yearly returns, highlighting its potential for long-term growth.
- Best quarters: Quant ELSS Tax Saver Fund had a stellar performance in Q2 2020, indicating its capability to capitalize on market upswings.
- Worst quarters: Both funds experienced significant downturns in Q1 2020. Quant ELSS recovered better, showing lower losses in Q2 2022 than SBI Long Term Equity Fund.
Quarterly Results
Analysing quarterly returns provides insights into how funds perform over shorter periods, reflecting their ability to navigate market fluctuations.
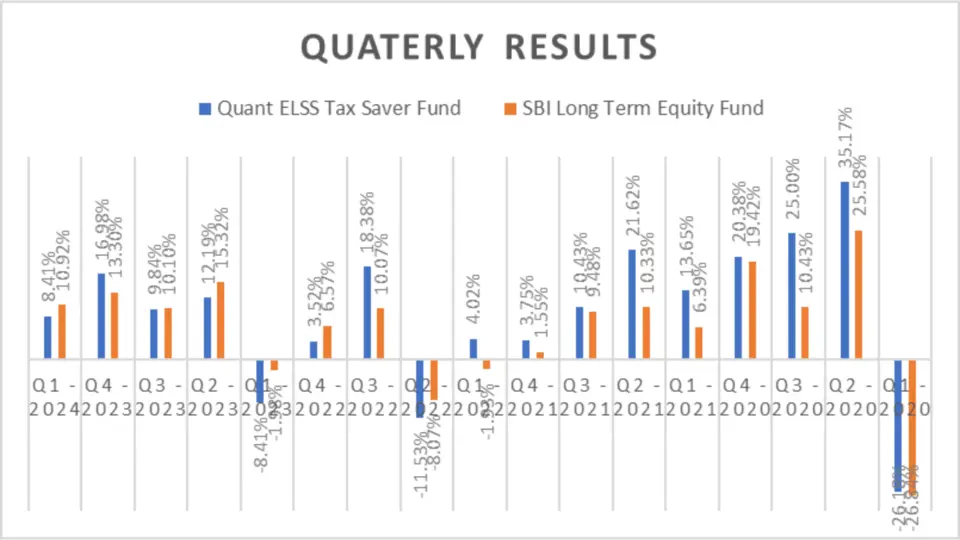
| Period | Quant ELSS Tax Saver Fund | SBI Long-Term Equity Fund |
| Q1 – 2024 | 8.41% | 10.92% |
| Q4 – 2023 | 16.98% | 13.30% |
| Q3 – 2023 | 9.84% | 10.10% |
| Q2 – 2023 | 12.19% | 15.32% |
| Q1 – 2023 | -8.41% | -1.98% |
| Q4 – 2022 | 3.52% | 6.57% |
| Q3 – 2022 | 18.38% | 10.07% |
| Q2 – 2022 | -11.53% | -8.07% |
| Q1 – 2022 | 4.02% | -1.93% |
| Q4 – 2021 | 3.75% | 1.55% |
| Q3 – 2021 | 10.43% | 9.48% |
| Q2 – 2021 | 21.62% | 10.33% |
| Q1 – 2021 | 13.65% | 6.39% |
| Q4 – 2020 | 20.38% | 19.42% |
| Q3 – 2020 | 25.00% | 10.43% |
| Q2 – 2020 | 35.17% | 25.58% |
| Q1 – 2020 | -26.18% | -26.84% |
Analysis
- 2024 (Q1): SBI Long Term Equity Fund outperformed Quant ELSS with 10.92% vs. 8.41%.
- 2023: SBI Long Term Equity Fund showed higher returns in Q2 and Q1, whereas Quant ELSS outperformed in Q4 and Q3.
- 2022: Quant ELSS outperformed in Q3 and Q1, but had significant negative returns in Q2.
- 2021: Quant ELSS showed consistent outperformance across all quarters.
- 2020: Quant ELSS had a stellar Q2, but both funds faced significant drawdowns in Q1.
Outperformance
| Fund | No. of Quarters Outperformed |
| Quant ELSS Tax Saver Fund | 11 |
| SBI Long-Term Equity Fund | 6 |
Key Takeaways
- Short-term performance: SBI Long Term Equity Fund showed better results in recent quarters, particularly in early 2024 and mid-2023.
- Medium-term performance: Quant ELSS Tax Saver Fund consistently outperformed across most quarters from 2020 to 2021, showcasing resilience and strong recovery during market upturns.
- Long-term performance: Despite higher volatility indicated by maximum drawdown, Quant ELSS Tax Saver Fund demonstrates robust performance, especially during market recoveries.


Risk Analysis
Maximum Drawdown
Maximum drawdown measures the most significant single drop from peak to trough in the value of a fund. It’s a critical metric for understanding the risk associated with an investment.
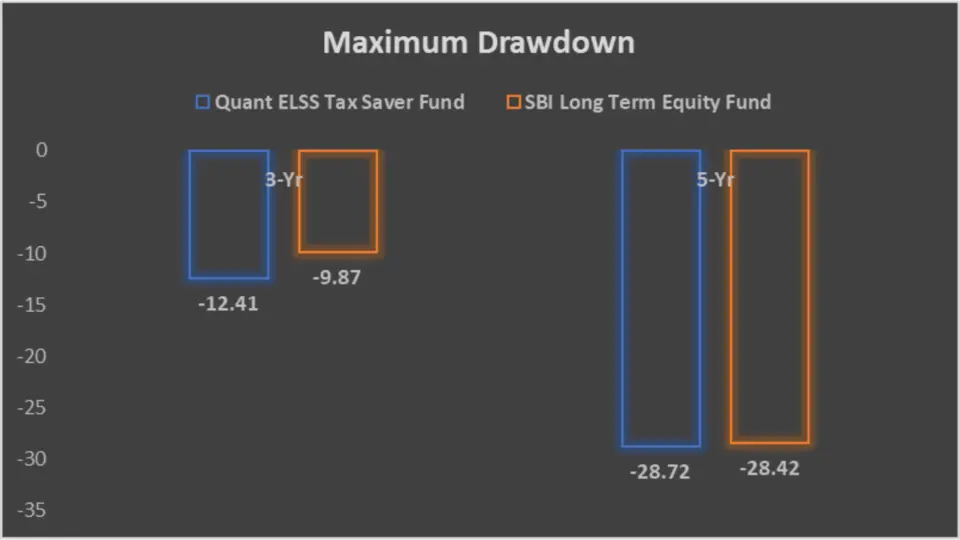
| Period | Quant ELSS Tax Saver Fund | SBI Long-Term Equity Fund |
| 3-Year | -12.41% | -9.87% |
| 5-Year | -28.72% | -28.42% |
Analysis
- 3-Year: SBI Long Term Equity Fund has a lower drawdown (-9.87%) than Quant ELSS (-12.41%), indicating slightly lower volatility over this period.
- 5-Year: Both funds exhibit similar maximum drawdowns, with Quant ELSS at -28.72% and SBI Long Term at -28.42%.
Mean Return, Sortino Ratio, and Treynor’s Ratio
These metrics help gauge a fund’s performance, considering returns and risks.

| Metric | Quant ELSS Tax Saver Fund | SBI Long-Term Equity Fund |
| Mean Return (%) | 30.06 | 25.54 |
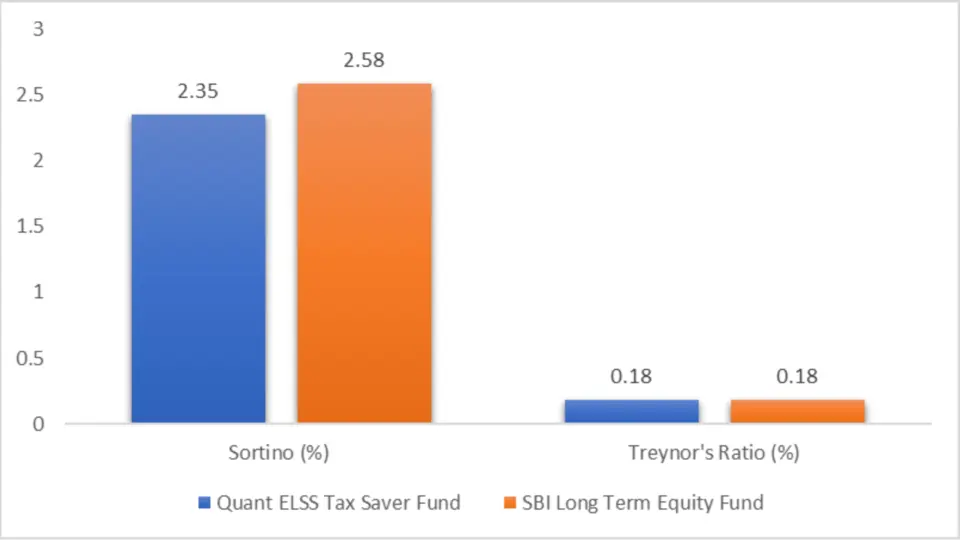
| Sortino Ratio (%) | 2.35 | 2.58 |
| Treynor’s Ratio (%) | 0.18 | 0.18 |
Analysis
- Mean Return: Quant ELSS Tax Saver Fund leads with a higher mean return of 30.06% compared to SBI Long Term Equity Fund’s 25.54%.
- Sortino Ratio: This metric indicates how well the fund compensates for the downside risk. SBI Long Term Equity Fund has a higher Sortino ratio (2.58%) than Quant ELSS (2.35%), suggesting it better manages downside risk relative to returns.
- Treynor’s Ratio: Both funds have an identical Treynor’s Ratio of 0.18, indicating similar performance when considering systematic risk.
Standard Deviation
Standard deviation measures the volatility of returns, with lower values indicating more stable performance.
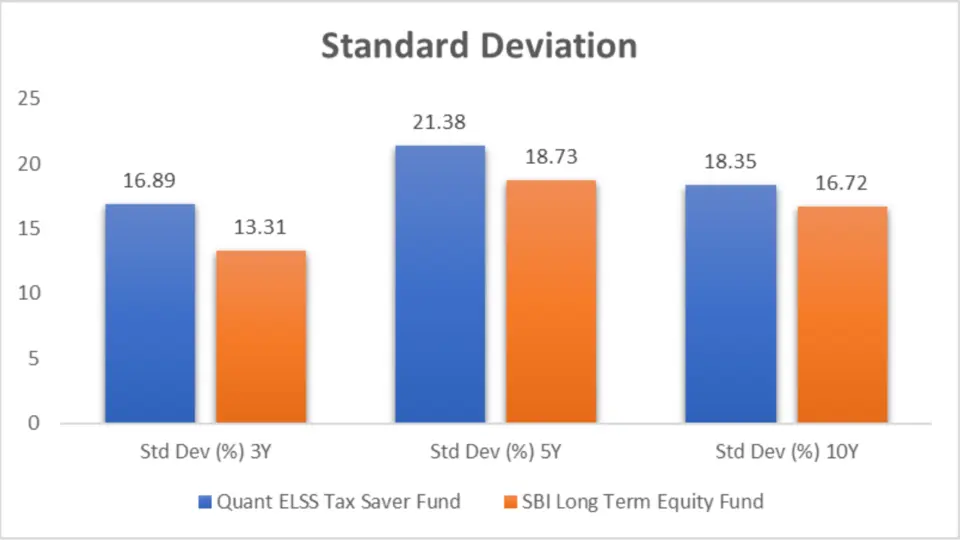
| Metric | Quant ELSS Tax Saver Fund | SBI Long-Term Equity Fund |
| Std Dev (%) 3Y | 16.89 | 13.31 |
| Std Dev (%) 5Y | 21.38 | 18.73 |
| Std Dev (%) 10Y | 18.35 | 16.72 |
Analysis
- 3-Year: SBI Long Term Equity Fund has a lower standard deviation (13.31%) compared to Quant ELSS (16.89%), indicating less volatility in the short term.
- 5-Year: Over 5 years, SBI Long Term shows lower volatility (18.73%) than Quant ELSS (21.38%).
- 10-Year: Similarly, for 10 years, SBI Long Term Equity Fund exhibits lower volatility (16.72%) than Quant ELSS (18.35%).
Key Takeaways
- Higher Returns with Higher Risk: Quant ELSS Tax Saver Fund offers higher mean returns but has greater volatility.
- Better Downside Risk Management: SBI Long Term Equity Fund performs better in managing downside risks, as indicated by the higher Sortino Ratio.
- Stability: SBI Long Term Equity Fund demonstrates lower volatility across all periods, making it a more stable option than Quant ELSS Tax Saver Fund.
Sharpe Ratio
The Sharpe ratio is a tool to measure the performance of a mutual fund investment compared to a risk-free asset after amending its risk. The higher the Sharpe ratio, the better the fund’s risk-adjusted performance.

| Metric | Quant ELSS Tax Saver Fund | SBI Long-Term Equity Fund |
| Sharpe (%) 3Y | 1.47 | 1.53 |
| Sharpe (%) 5Y | 1.19 | 0.87 |
| Sharpe (%) 10Y | 1.05 | 0.71 |
Analysis
- 3-Year: SBI Long Term Equity Fund has a slightly higher Sharpe ratio (1.53) compared to Quant ELSS (1.47), indicating better risk-adjusted returns in the short term.
- 5-Year: Quant ELSS takes the lead with a Sharpe ratio of 1.19, outperforming SBI Long Term’s 0.87.
- 10-Year: Quant ELSS maintains a higher Sharpe ratio (1.05) over the long term than SBI Long Term’s 0.71.
Beta
Beta measures a fund’s volatility relative to the market. A beta value of less than 1 indicates lower volatility than the stock market. In comparison, a beta greater than 1 indicates higher volatility.

| Metric | Quant ELSS Tax Saver Fund | SBI Long-Term Equity Fund |
| Beta (%) 3Y | 0.98 | 0.93 |
| Beta (%) 5Y | 1.00 | 0.96 |
| Beta (%) 10Y | 0.98 | 0.98 |
Analysis
- 3-Year: SBI Long Term Equity Fund exhibits lower volatility (Beta of 0.93) than Quant ELSS (0.98).
- 5-Year: SBI Long Term shows lower volatility (Beta of 0.96) than Quant ELSS (1.00).
- 10-Year: Both funds have an identical Beta of 0.98, indicating similar market volatility over the long term.
Alpha
Alpha measures a fund’s performance relative to a benchmark index. A positive alpha indicates outperformance, while a negative alpha indicates underperformance.
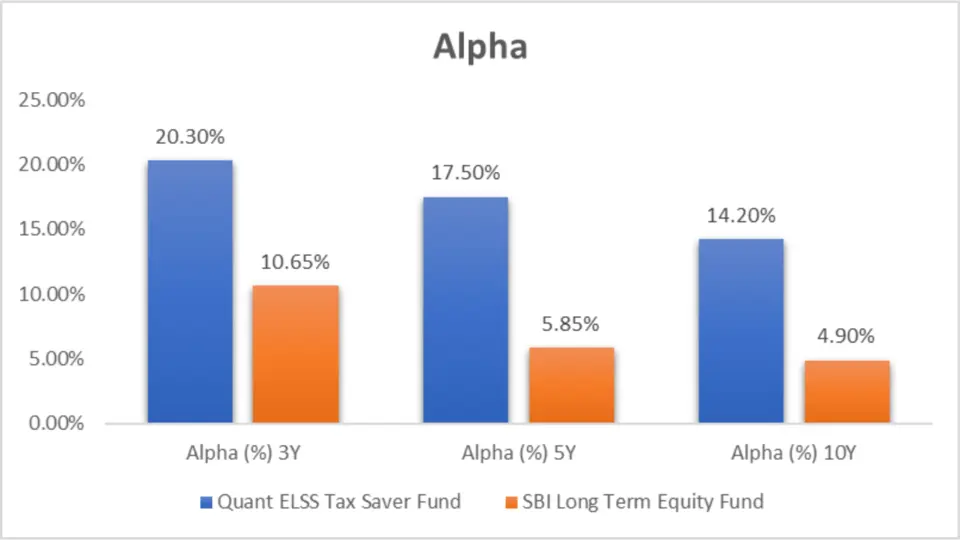
| Metric | Quant ELSS Tax Saver Fund | SBI Long-Term Equity Fund |
| Alpha (%) 3Y | 20.30% | 10.65% |
| Alpha (%) 5Y | 17.50% | 5.85% |
| Alpha (%) 10Y | 14.20% | 4.90% |
Analysis
- 3-Year: Quant ELSS Tax Saver Fund has a significantly higher alpha (20.30%) than SBI Long Term Equity Fund (10.65%), indicating better outperformance than the benchmark.
- 5-Year: Quant ELSS maintains a strong lead with an alpha of 17.50%, compared to SBI Long Term’s 5.85%.
- 10-Year: Quant ELSS continues to outperform over the long term with an alpha of 14.20%, significantly higher than SBI Long Term’s 4.90%.
Key Takeaways
- Risk-Adjusted Returns: Quant ELSS Tax Saver Fund generally provides better risk-adjusted returns over more extended periods, as indicated by its higher Sharpe ratios for the 5-year and 10-year periods.
- Volatility: SBI Long Term Equity Fund shows lower volatility (lower Beta) in the short and medium terms, making it a more stable option than Quant ELSS.
- Benchmark Performance: Quant ELSS Tax Saver Fund consistently outperforms the benchmark by a significant margin, as shown by its higher alpha across all periods.
Ratings
Ratings from reputed agencies can provide valuable insights into mutual funds’ overall performance and reliability. Here’s a comparison of the ratings for both funds.

| Ratings | Quant ELSS Tax Saver Fund | SBI Long-Term Equity Fund |
| CRISIL (as on 31st Mar 2024) | 5 | 5 |
| CRISIL (as on 31st Dec 2023) | 5 | 5 |
| CRISIL (as on 30th Sep 2023) | 4 | 5 |
| CRISIL (as on 30th Jun 2023) | 5 | 5 |
| CRISIL (as on 31st Mar 2023) | 5 | 4 |
| Value Research Ratings | 5 | 5 |
| Morning Star Ratings | 5 | 5 |
Analysis
- CRISIL Ratings: Both funds have consistently received high ratings. Quant ELSS had a slight dip in September 2023 with a rating of 4 but recovered to a 5 by the end of 2023. SBI Long Term Equity Fund had maintained a consistent rating of 5 except for March 2023, when it received a 4.
- Value Research Ratings and Morning Star Ratings: Both funds have the highest ratings of 5, indicating overall solid performance.
Portfolio Analysis
Understanding the portfolio composition is crucial to gauge a fund’s investment strategy and risk exposure.
Portfolio Overlapping Comparison
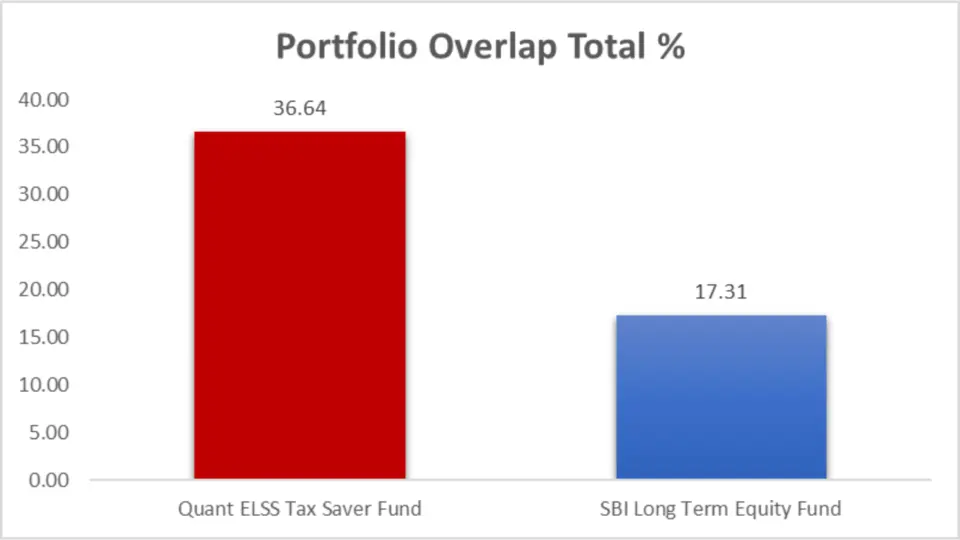
| Metric | Quant ELSS Tax Saver Fund | SBI Long-Term Equity Fund |
| Portfolio Overlap Total % | 36.64 | 17.31 |
Analysis
- The portfolio overlap percentage indicates the extent to which the holdings of one fund overlap with the other. Quant ELSS Tax Saver Fund has a higher overlap percentage (36.64%) than the SBI Long Term Equity Fund (17.31%). This means Quant ELSS may have more common investments, potentially leading to similar performance trends as other funds in the market.
Portfolio Composition Comparison

| Category | Quant ELSS Tax Saver Fund | SBI Long-Term Equity Fund |
| Equity | 98.32% | 90.19% |
| Debt | 0% | 0% |
| Cash & Cash Equivalents | 1.68% | 9.81% |
Analysis
- Equity Allocation: Quant ELSS Tax Saver Fund has a significantly higher equity allocation (98.32%) than the SBI Long Term Equity Fund (90.19%). This suggests that Quant ELSS is more aggressively invested in equities.
- Cash & Cash Equivalents: SBI Long Term Equity Fund holds a higher percentage of its assets in cash and cash equivalents (9.81%) than Quant ELSS (1.68%). This can provide more liquidity and lower risk during market volatility but may also result in lower returns during bullish markets.
Key Takeaways
- Consistent High Ratings: Both funds have consistently received high ratings from CRISIL, Value Research, and Morning Star, indicating strong performance and reliability.
- Higher Equity Exposure: Quant ELSS Tax Saver Fund has a higher exposure to equities, which can lead to higher returns but also raises risk.
- Higher Cash Holdings: SBI Long Term Equity Fund maintains significant cash and cash equivalents, offering more liquidity and potentially lower risk.
- Portfolio Overlap: Quant ELSS Tax Saver Fund has a higher portfolio overlap, indicating it may share more common investments with other funds, leading to similar market performance trends.
Market Cap Allocation
Understanding the market cap allocation of a fund gives insight into the type of companies the fund invests in. This can affect the fund’s performance and risk profile.
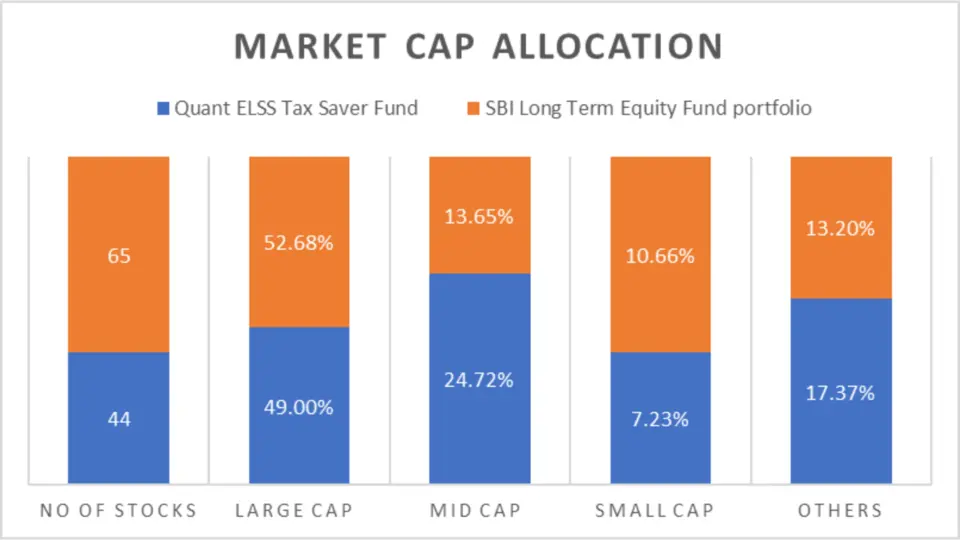
| Category | Quant ELSS Tax Saver Fund | SBI Long-Term Equity Fund |
| No of Stocks | 44 | 65 |
| Large Cap | 49.00% | 52.68% |
| Mid Cap | 24.72% | 13.65% |
| Small Cap | 7.23% | 10.66% |
| Others | 17.37% | 13.20% |
Analysis
- Number of Stocks: SBI Long Term Equity Fund holds a more diversified portfolio with 65 stocks than Quant ELSS’s 44 stocks.
- Large Cap: SBI Long Term Equity Fund has a higher allocation to large-cap stocks (52.68%) than Quant ELSS (49.00%).
- Mid Cap: Quant ELSS has a significantly higher allocation to mid-cap stocks (24.72%) than SBI Long Term (13.65%).
- Small Cap: SBI Long Term Equity Fund has a higher allocation to small-cap stocks (10.66%) than Quant ELSS (7.23%).
- Others: Quant ELSS has a higher allocation to other categories (17.37%) than SBI Long Term (13.20%).
Sector Allocation
Sector allocation provides insight into the industries the fund is invested in, which can influence the fund’s performance based on sector-specific trends.

| Sector | Quant ELSS Tax Saver Fund | SBI Long-Term Equity Fund |
| Energy & Utilities | 24.60% | 14.93% |
| Materials | 19.45% | 7.16% |
| Financial | 19.15% | 24.75% |
| Technology | 8.80% | 9.38% |
| Consumer Discretionary | 8.73% | 10.10% |
| Industrials | 6.73% | 11.81% |
| Healthcare | 5.76% | 8.41% |
| Consumer Staples | 4.49% | 2.86% |
| Diversified | 0.61% | NA |
| Real Estate | NA | 0.79% |
Analysis
- Energy & Utilities: Quant ELSS has a higher allocation to energy and utilities (24.60%) than SBI Long Term (14.93%).
- Materials: Quant ELSS has a significantly higher allocation to materials (19.45%) than SBI Long Term (7.16%).
- Financial: SBI Long Term Equity Fund has a higher allocation to financials (24.75%) than Quant ELSS (19.15%).
- Technology: Both funds have similar allocations to technology, with SBI Long Term slightly ahead.
- Consumer Discretionary and Industrials: SBI Long Term Equity Fund has higher allocations to consumer discretionary (10.10%) and industrials (11.81%) than Quant ELSS.
- Healthcare and Consumer Staples: Quant ELSS has a lower allocation to healthcare (5.76%) but a higher allocation to consumer staples (4.49%) compared to SBI Long Term.
- Diversified and Real Estate: Quant ELSS has a small allocation to diversified (0.61%) and no allocation to real estate, while SBI Long Term has no allocation to diversified but a small allocation to real estate (0.79%).
Fund Management Comparison
Fund management plays a critical role in the performance and stability of a mutual fund. Here’s a look at the experience of the fund managers for both funds.
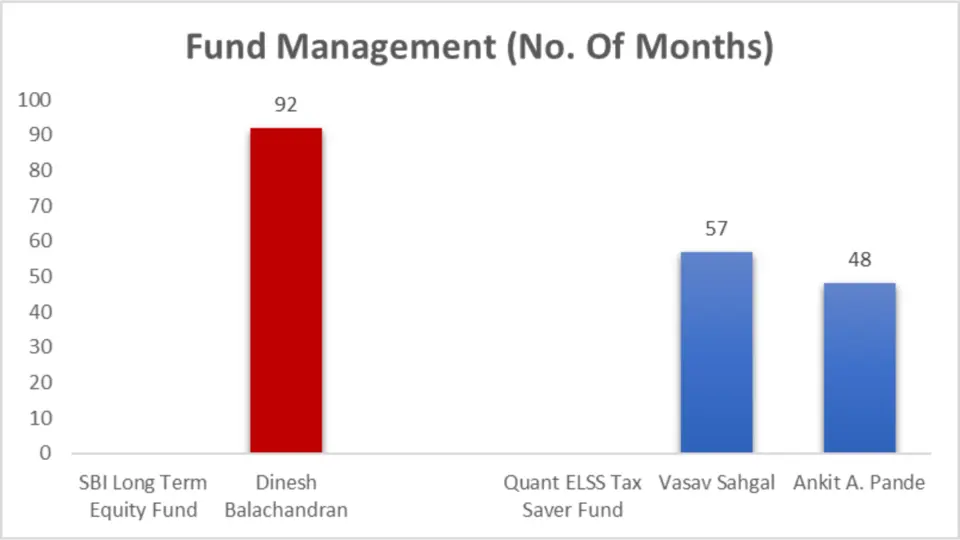
| Fund | Fund Manager | No. of Months |
| SBI Long-Term Equity Fund | Dinesh Balachandran | 92 |
| Quant ELSS Tax Saver Fund | Vasav Sahgal | 57 |
| Quant ELSS Tax Saver Fund | Ankit A. Pande | 48 |
Analysis
- SBI Long-Term Equity Fund: Managed by Dinesh Balachandran for 92 months, providing stability and a long-term perspective.
- Quant ELSS Tax Saver Fund: Managed by Vasav Sahgal for 57 months and Ankit A. Pande for 48 months, offering a blend of insights and strategies.
Other Important General Details
Understanding critical metrics like NAV, AUM, expense ratio, and turnover is essential for evaluating the efficiency and scale of a fund.

| Metric | Quant ELSS Tax Saver Fund | SBI Long-Term Equity Fund |
| NAV | 414.64 | 418.13 |
| AUM (in Cr.) | 8341 | 21976 |
| Expense Ratio (%) | 0.76 | 0.96 |
| Turnover | 170.00% | 15.00% |
| Benchmark | NIFTY 50 | NIFTY 100 |
Analysis
- NAV: Both funds have similar NAVs, indicating comparable fund unit prices.
- AUM: SBI Long Term Equity Fund has a significantly higher AUM (₹21976 Cr.) than Quant ELSS (₹8341 Cr.), suggesting a larger fund size.
- Expense Ratio: Quant ELSS Tax Saver Fund has a lower expense ratio (0.76%) than SBI Long Term Equity Fund (0.96%), indicating lower investor costs.
- Turnover: Quant ELSS has a higher turnover rate (170.00%), which may indicate more frequent trading than SBI Long Term’s 15.00%.
- Benchmark: Quant ELSS tracks the NIFTY 50, while SBI Long Term tracks the NIFTY 100, which includes more stocks and thus broader market exposure.
Minimum Investment Amount
Knowing the minimum investment requirements helps you plan your investment strategy.
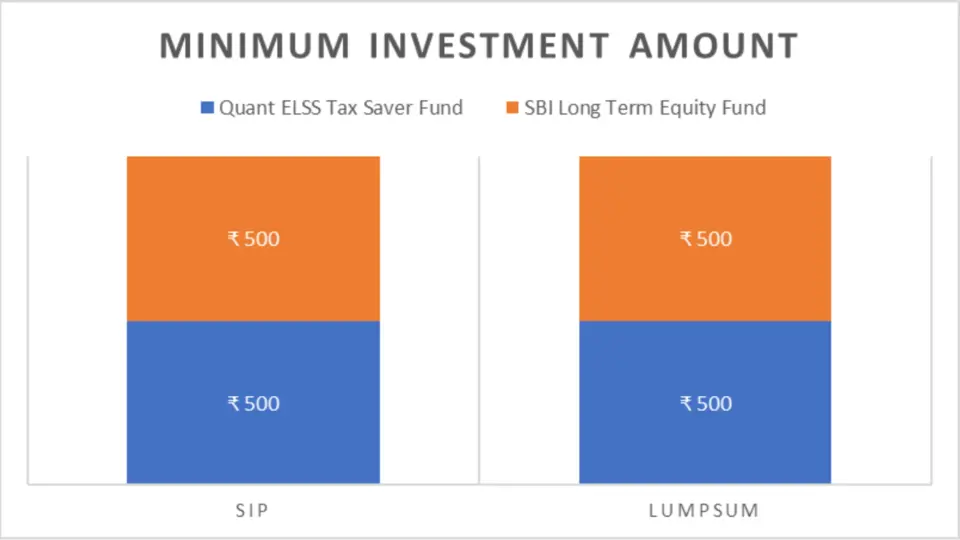
| Minimum Investment Amount | SIP | Lumpsum |
| Quant ELSS Tax Saver Fund | ₹ 500 | ₹ 500 |
| SBI Long-Term Equity Fund | ₹ 500 | ₹ 500 |
Analysis
- SIP and Lumpsum: Both funds have identical minimum investment requirements, making them equally accessible for regular and lump sum investors.
Key Takeaways
- Experienced Management: SBI Long Term Equity Fund benefits from longer fund manager tenure.
- Lower Costs: Quant ELSS Tax Saver Fund has a lower expense ratio, making it more cost-effective.
- Higher Turnover: Quant ELSS indicates more active management with a higher turnover rate.
- Diverse Sector Allocation: SBI Long Term Equity Fund is more diversified across various sectors, potentially reducing risk.
- Accessible Investment: Both funds have low minimum investment amounts, making them accessible to many investors.
Conclusion
Both Quant ELSS Tax Saver Fund and SBI Long Term Equity Fund are solid choices for ELSS investments, each excelling in different areas. The Quant ELSS Tax Saver Fund offers higher equity exposure, lower expense ratio, and potentially higher returns, making it an attractive option for aggressive investors seeking growth.
On the other hand, the SBI Long Term Equity Fund, with its larger AUM, longer fund manager tenure, and greater sector diversification, is better suited for conservative investors prioritizing stability and lower risk. Ultimately, choosing between the two funds should align with your risk appetite and financial goals, ensuring a well-rounded investment strategy.

We hope you found this guide on mutual funds helpful.
If you have any mutual fund-related queries, feel free to comment below—we’re here to help! S.K. Singh, a registered professional with the Association of Mutual Funds in India (AMFI), will answer your queries and holds the ARN-251149.
Invest wisely!
FAQs-Quant ELSS Tax Saver Fund vs SBI Long Term Equity Fund
Which fund has a lower expense ratio, Quant ELSS Tax Saver Fund or SBI Long Term Equity Fund?
The Quant ELSS Tax Saver Fund has a lower expense ratio of 0.76% compared to the SBI Long Term Equity Fund’s 0.96%, making it more cost-effective for investors.
How do the fund managers’ tenures compare between Quant ELSS Tax Saver Fund and SBI Long Term Equity Fund?
The SBI Long Term Equity Fund is managed by Dinesh Balachandran, who has been at the helm for 92 months, providing stability and experience. The Quant ELSS Tax Saver Fund is managed by Vasav Sahgal and Ankit A. Pande, with tenures of 57 and 48 months, respectively.
Which fund is better for investors with a high-risk appetite?
Investors with a high-risk appetite might prefer the Quant ELSS Tax Saver Fund due to its higher equity exposure, mid-cap allocation, and lower expense ratio, potentially offering higher returns.
What are the sector allocations for Quant ELSS Tax Saver Fund and SBI Long Term Equity Fund?
The Quant ELSS Tax Saver Fund has significant allocations in Energy & Utilities (24.60%), Materials (19.45%), and Financials (19.15%). In contrast, the SBI Long Term Equity Fund is heavily invested in Financials (24.75%), Industrials (11.81%), and Consumer Discretionary (10.10%).
How does the portfolio overlap compare between Quant ELSS Tax Saver Fund and SBI Long Term Equity Fund?
The Quant ELSS Tax Saver Fund has a higher portfolio overlap of 36.64% compared to the SBI Long Term Equity Fund’s 17.31%, indicating more common investments with other funds.
What are these funds’ minimum investment amounts for SIP and lump sum?
Both the Quant ELSS Tax Saver Fund and the SBI Long Term Equity Fund require a minimum investment amount of ₹500 for both SIP and lump sum investments.
Which fund is more suitable for conservative investors?
Conservative investors may prefer the SBI Long Term Equity Fund due to its greater diversification, larger AUM, and more stable sector allocations, providing a balanced approach with lower risk.
What benchmarks do these funds follow?
The Quant ELSS Tax Saver Fund tracks the NIFTY 50, while the SBI Long Term Equity Fund follows the NIFTY 100, providing broader market exposure.
How do the NAV and AUM of these funds compare?
As of the latest data, the NAV of Quant ELSS Tax Saver Fund is ₹414.64 with an AUM of ₹8341 Cr., while the SBI Long Term Equity Fund has a NAV of ₹418.13 and a significantly larger AUM of ₹21976 Cr.
Which fund has a higher turnover rate, and what does it imply?
The Quant ELSS Tax Saver Fund has a higher turnover rate of 170.00% compared to the SBI Long Term Equity Fund’s 15.00%, implying more active management and frequent trading within the fund.
Q
Disclaimer:
The information provided in this article is solely the author/advertisers’ opinion and not investment advice – it is provided for educational purposes only. Using this, you agree that the information does not constitute any investment or financial instructions by Ace Equity Research/Mutual Fund Focus/IPO First and the team. Anyone wishing to invest should seek their own independent financial or professional advice. Conduct your research with registered financial advisors before making any investment decisions. Ace Equity Research/ Mutual Fund Focus / IPO First and the team are not accountable for the investment views provided in the article.
Mutual Fund investments are subject to market risks. Read all scheme-related documents carefully.
Investments in the securities market are subject to market risks. Read all the related documents carefully before investing.