
Suppose you’re diving into small-cap mutual funds and are confused about choosing between Tata Small Cap Fund vs Nippon India Small Cap Fund. In that case, you’ve landed in the right place. This article will help you clear up any doubts you have. We’ll comprehensively compare these two small-cap funds, focusing on their SIP (Systematic Investment Plan) returns and investment values. By the end, you’ll clearly understand which fund might be the best fit for your investment goals.
Investment Style
Tata Small Cap Fund: Growth
Nippon India Small Cap Fund: Growth
Both funds follow a growth investment style, which targets stocks expected to grow at an above-average rate compared to other companies.

Returns Analysis
Trailing Returns
Let’s break down the trailing returns for both funds over different periods to understand how they have performed over time.
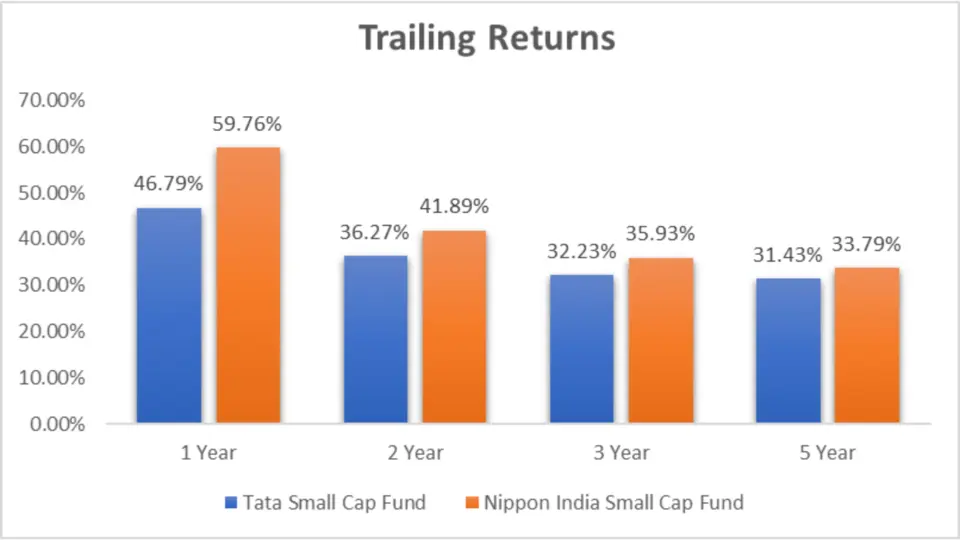
| Period Invested | Tata Small Cap Fund | Nippon India Small Cap Fund |
| 1 Year | 46.79% | 59.76% |
| 2 Year | 36.27% | 41.89% |
| 3 Year | 32.23% | 35.93% |
| 5 Year | 31.43% | 33.79% |
Key Takeaways:
- 1-Year Performance: Nippon India Small Cap Fund outperformed Tata Small Cap Fund by approximately 12.97%.
- 2-Year Performance: Nippon India Small Cap Fund again took the lead with a 5.62% higher return than Tata Small Cap Fund.
- 3-Year Performance: The gap narrows with Nippon India Small Cap Fund ahead by 3.70%.
- 5-Year Performance: Nippon India Small Cap Fund maintains a 2.36% higher return than Tata Small Cap Fund.
Nippon India Small Cap Fund consistently delivers higher returns across all periods than Tata Small Cap Fund, making it a potentially more attractive option for higher returns.
Lumpsum Investment Value
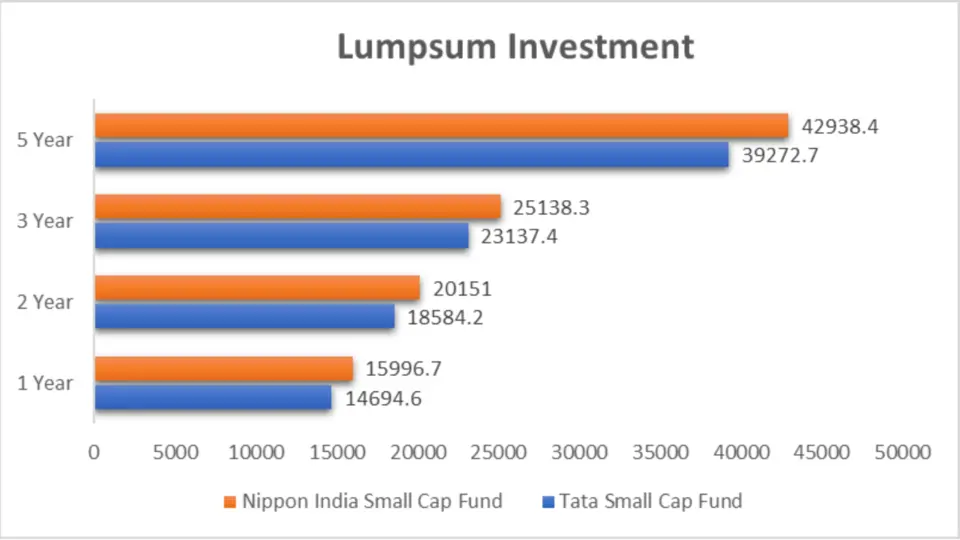
Next, look at the value of a lumpsum investment in both funds over different periods.
Lumpsum Investment Value Comparison
| Period Invested | Tata Small Cap Fund | Nippon India Small Cap Fund |
| 1 Year | ₹14,694.6 | ₹15,996.7 |
| 2 Year | ₹18,584.2 | ₹20,151.0 |
| 3 Year | ₹23,137.4 | ₹25,138.3 |
| 5 Year | ₹39,272.7 | ₹42,938.4 |
Key Takeaways:
- 1-Year Investment: An investment in Nippon India Small Cap Fund would have grown to ₹15,996.7, which is ₹1,302.1 more than Tata Small Cap Fund.
- 2-Year Investment: Nippon India Small Cap Fund grows your money by ₹1,566.8 more than Tata Small Cap Fund.
- 3-Year Investment: Nippon India Small Cap Fund yields ₹2,000.9 more than Tata Small Cap Fund.
- 5-Year Investment: Nippon India Small Cap Fund increases your investment by ₹3,665.7 more than Tata Small Cap Fund.
Nippon India Small Cap Fund shows a higher investment value across all periods, indicating better growth prospects for lumpsum investors.
Analysis
1 Year Performance
The 1-year trailing return for Nippon India Small Cap Fund is 59.76%, while Tata Small Cap Fund is 46.79%. The difference in Performance, which is 12.97%, suggests that Nippon India Small Cap Fund had a significantly better year. This can be due to better stock selection, market conditions, or management efficiency.
2 Year Performance
Over the 2 years, Nippon India Small Cap Fund returns 41.89%, whereas Tata Small Cap Fund is 36.27%. The 5.62% difference showcases Nippon India Small Cap Fund’s consistent ability to outperform Tata Small Cap Fund, possibly due to a more robust portfolio or better market timing.
3 Year Performance
The 3-year returns see Nippon India Small Cap Fund at 35.93% and Tata Small Cap Fund at 32.23%, a 3.70% difference. While both funds show strong Performance, Nippon India Small Cap Fund’s slight edge indicates its resilience and robust growth strategy over a medium-term period.
5 Year Performance
SIP Returns
Let’s break down the SIP returns for both funds over different periods to understand their performance over time.
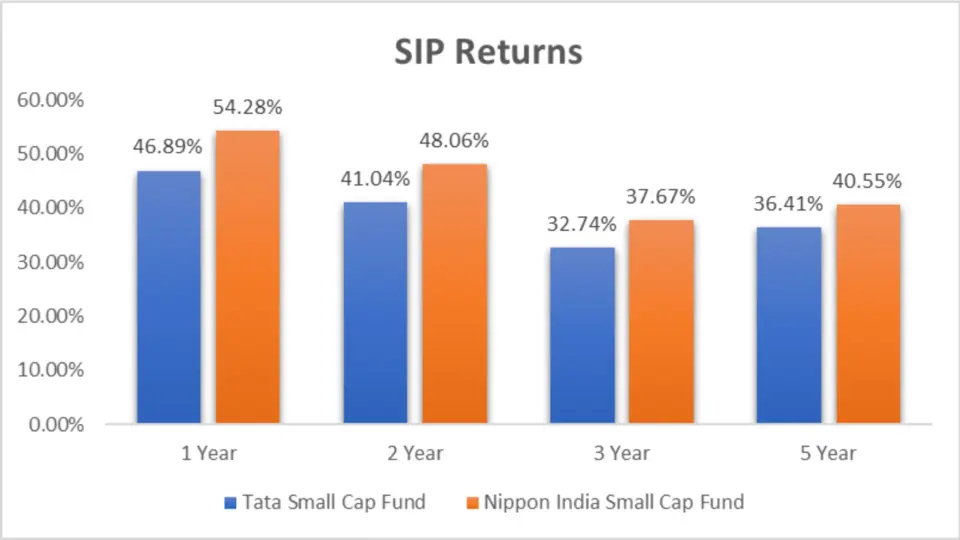
| Period Invested | Tata Small Cap Fund | Nippon India Small Cap Fund |
| 1 Year | 46.89% | 54.28% |
| 2 Year | 41.04% | 48.06% |
| 3 Year | 32.74% | 37.67% |
| 5 Year | 36.41% | 40.55% |
Key Takeaways:
- 1-Year Performance: Nippon India Small Cap Fund outperformed Tata Small Cap Fund by approximately 7.39%.
- 2-Year Performance: Nippon India Small Cap Fund leads with a 7.02% higher return than Tata Small Cap Fund.
- 3-Year Performance: Nippon India Small Cap Fund again has an edge with a 4.93% higher return.
- 5-Year Performance: Nippon India Small Cap Fund maintains a 4.14% higher return than Tata Small Cap Fund.
Nippon India Small Cap Fund consistently delivers higher returns across all periods than Tata Small Cap Fund, making it a potentially more attractive option for higher returns.
SIP Investment Value
Next, look at the value of SIP investments in both funds over different periods.
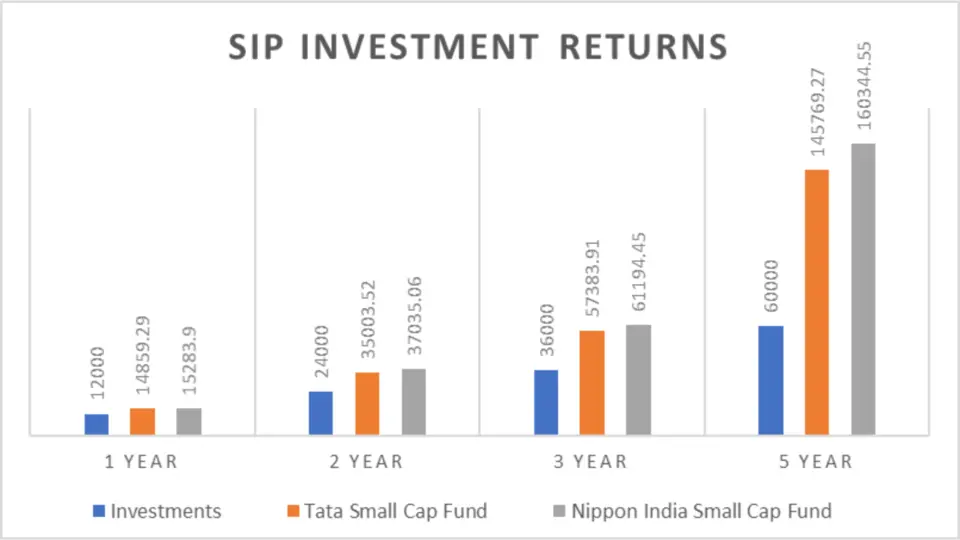
| Period Invested | Investments | Tata Small Cap Fund | Nippon India Small Cap Fund |
| 1 Year | ₹12,000 | ₹14,859.29 | ₹15,283.90 |
| 2 Year | ₹24,000 | ₹35,003.52 | ₹37,035.06 |
| 3 Year | ₹36,000 | ₹57,383.91 | ₹61,194.45 |
| 5 Year | ₹60,000 | ₹145,769.27 | ₹160,344.55 |
Key Takeaways:
- 1-Year Investment: An investment in Nippon India Small Cap Fund would have grown to ₹15,283.90, which is ₹424.61 more than Tata Small Cap Fund.
- 2-Year Investment: Nippon India Small Cap Fund grows your money by ₹2,031.54 more than Tata Small Cap Fund.
- 3-Year Investment: Nippon India Small Cap Fund yields ₹3,810.54 more than Tata Small Cap Fund.
- 5-Year Investment: Nippon India Small Cap Fund increases your investment by ₹14,575.28 more than Tata Small Cap Fund.
Nippon India Small Cap Fund shows a higher investment value across all periods, indicating better growth prospects for SIP investors.
Analysis
1 Year performance
The 1-year SIP return for Nippon India Small Cap Fund is 54.28%, while Tata Small Cap Fund is 46.89%. The difference in performance, which is 7.39%, suggests that Nippon India Small Cap Fund had a significantly better year. This can be due to better stock selection, market conditions, or management efficiency.
2 Year performance
Over the 2 years, Nippon India Small Cap Fund returns 48.06%, whereas Tata Small Cap Fund is 41.04%. The 7.02% difference showcases Nippon India Small Cap Fund’s consistent ability to outperform Tata Small Cap Fund, possibly due to a more robust portfolio or better market timing.
3 Year performance
The 3-year returns see Nippon India Small Cap Fund at 37.67% and Tata Small Cap Fund at 32.74%, a 4.93% difference. While both funds show strong Performance, Nippon India Small Cap Fund’s slight edge indicates its resilience and robust growth strategy over a medium-term period.
5 Year performance
Finally, over the 5 years, Nippon India Small Cap Fund returns 40.55%, while Tata Small Cap Fund returns 36.41%. The 4.14% difference is minor but still significant, indicating that Nippon India Small Cap Fund has maintained a steady performance advantage over Tata Small Cap Fund.
CAGR Comparison
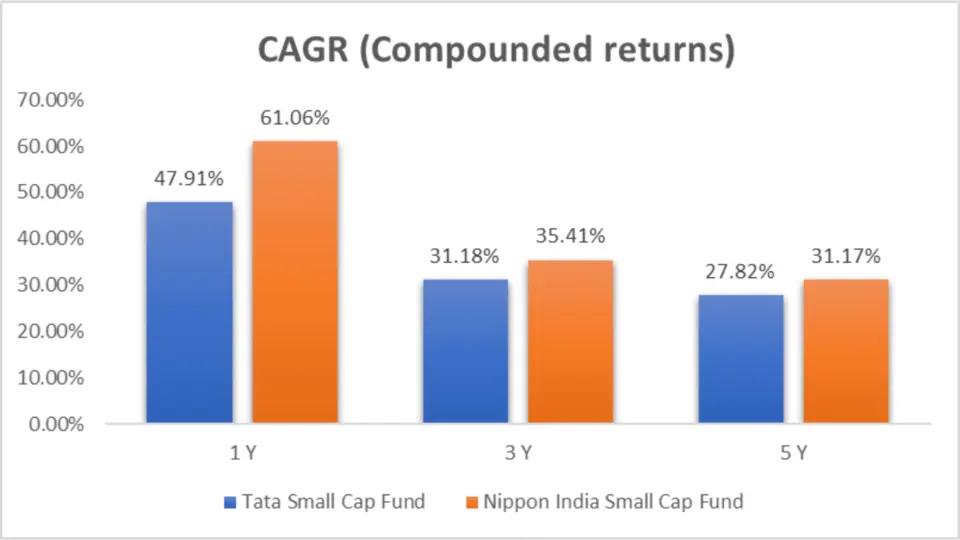
| Category | 1 Y | 3 Y | 5 Y |
| Tata Small Cap Fund | 47.91% | 31.18% | 27.82% |
| Nippon India Small Cap Fund | 61.06% | 35.41% | 31.17% |
Key Takeaways:
- 1-Year CAGR: Nippon India Small Cap Fund has a significantly higher CAGR of 61.06% compared to Tata Small Cap Fund’s 47.91%.
- 3-Year CAGR: Nippon India Small Cap Fund again leads with a CAGR of 35.41% compared to Tata Small Cap Fund’s 31.18%.
- 5-Year CAGR: Nippon India Small Cap Fund maintains an edge with a CAGR of 31.17% over Tata Small Cap Fund’s 27.82%.
Rolling Returns
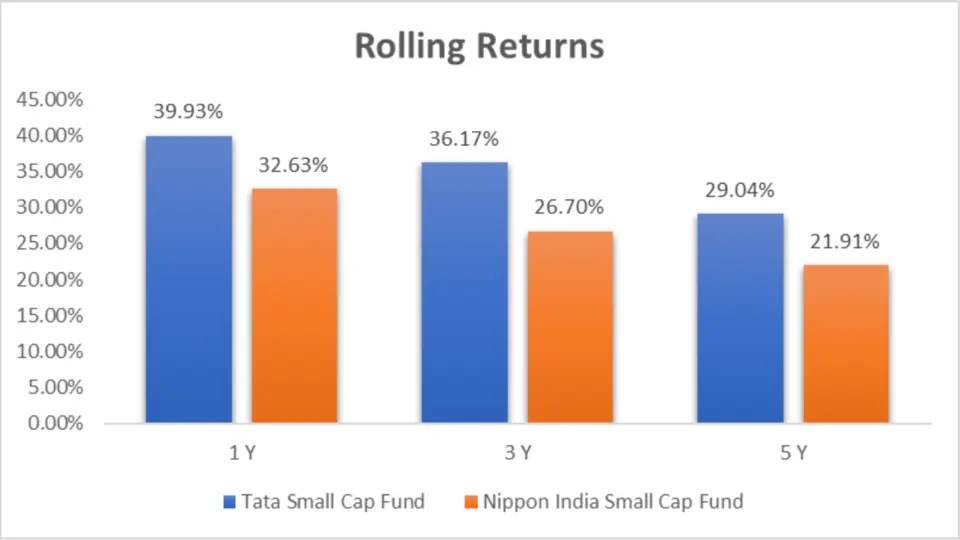
| Category | 1 Y | 3 Y | 5 Y |
| Tata Small Cap Fund | 39.93% | 36.17% | 29.04% |
| Nippon India Small Cap Fund | 32.63% | 26.70% | 21.91% |
Key Takeaways:
- 1-Year Rolling Returns: Tata Small Cap Fund has a higher rolling return of 39.93% compared to Nippon India Small Cap Fund’s 32.63%.
- 3-Year Rolling Returns: Tata Small Cap Fund again leads with a rolling return of 36.17% over Nippon India Small Cap Fund’s 26.70%.
- 5-Year Rolling Returns: Tata Small Cap Fund maintains an advantage with a rolling return of 29.04% compared to Nippon India Small Cap Fund’s 21.91%.
Analysis
1 Year performance
In the 1-year SIP returns, Nippon India Small Cap Fund outperformed Tata Small Cap Fund by 7.39%, highlighting its short-term solid performance. This can be attributed to its better stock selection and market strategy.
2 Year performance
Over 2 years, the Nippon India Small Cap Fund has shown a higher return of 7.02% than the Tata Small Cap Fund. This indicates its consistent performance and robust portfolio management.
3 Year performance
For the 3-year SIP returns, Nippon India Small Cap Fund leads by 4.93%. This suggests that Nippon India Small Cap Fund’s strategy works well in the medium term, providing better returns to investors.
5 Year performance
Nippon India Small Cap Fund maintains a 4.14% higher return over 5 years, showing its resilience and firm performance in the long term.
Nippon India Small Cap Fund’s higher CAGR across 1, 3, and 5 years demonstrates its strong growth potential and effective management. This is a crucial factor for investors looking for compounded growth over time
Rolling Returns Analysis
| Category | 1 Y | 3 Y | 5 Y |
| Tata Small Cap Fund | 39.93% | 36.17% | 29.04% |
| Nippon India Small Cap Fund | 32.63% | 26.70% | 21.91% |
Key Takeaways:
- 1-Year Rolling Returns: Tata Small Cap Fund has a higher rolling return of 39.93% compared to Nippon India Small Cap Fund’s 32.63%.
- 3-Year Rolling Returns: Tata Small Cap Fund again leads with a rolling return of 36.17% over Nippon India Small Cap Fund’s 26.70%.
- 5-Year Rolling Returns: Tata Small Cap Fund maintains an advantage with a rolling return of 29.04% compared to Nippon India Small Cap Fund’s 21.91%.
Annualized/Calendar Year Returns
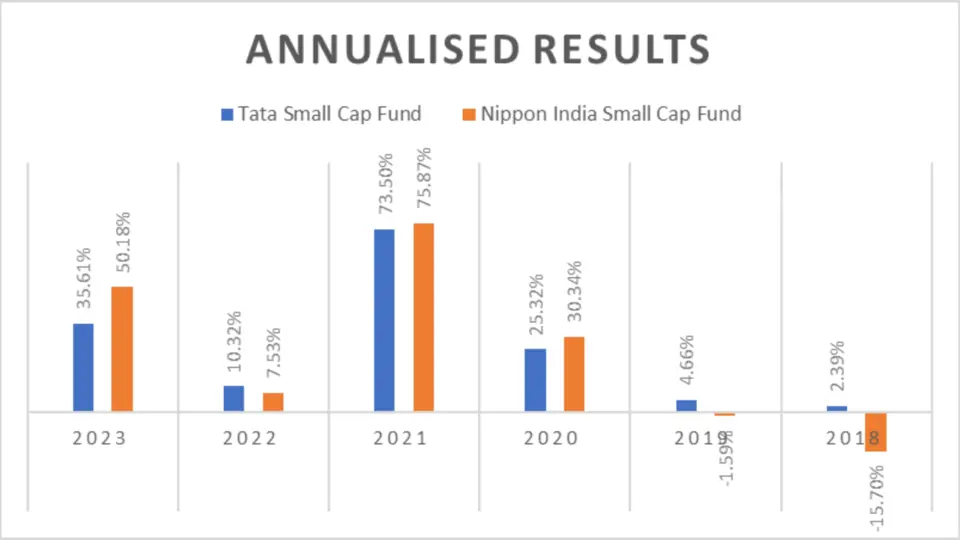
| Period | Tata Small Cap Fund | Nippon India Small Cap Fund |
| 2023 | 35.61% | 50.18% |
| 2022 | 10.32% | 7.53% |
| 2021 | 73.50% | 75.87% |
| 2020 | 25.32% | 30.34% |
| 2019 | 4.66% | -1.59% |
| 2018 | 2.39% | -15.70% |
| Total Return | 151.80% | 146.63% |
| Ave Return | 25.30% | 24.44% |
| No. of times Outperformance | 3 | 3 |
Key Takeaways:
- 2023 Performance: Nippon India Small Cap Fund outperformed Tata Small Cap Fund by 14.57%.
- 2022 Performance: Tata Small Cap Fund slightly outperformed Nippon India Small Cap Fund by 2.79%.
- 2021 Performance: Both funds had exceptional years, with Nippon India Small Cap Fund slightly ahead.
- 2020 Performance: Nippon India Small Cap Fund leads by 5.02%.
- 2019 and 2018 Performance: Tata Small Cap Fund outperformed, especially in 2019, by 6.25%.
Best Quarters
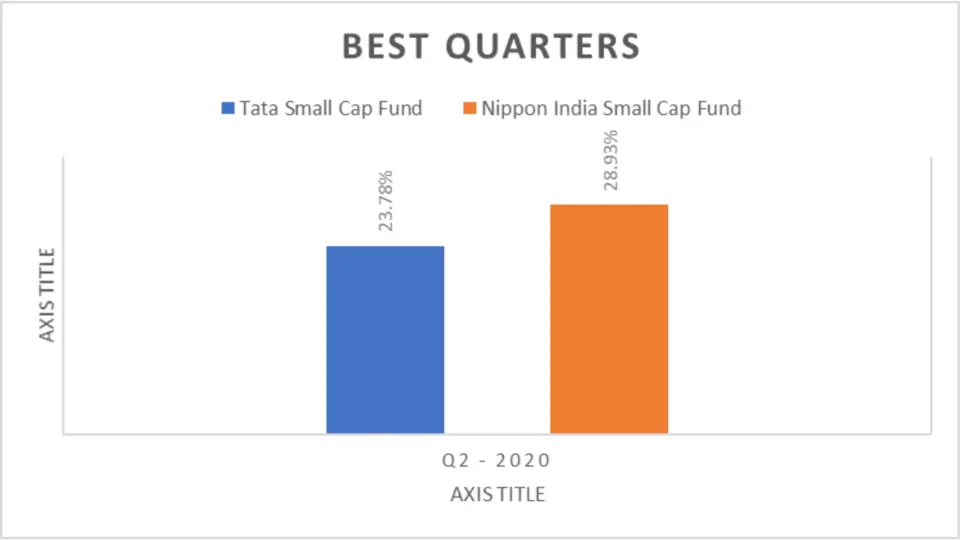
| Period | Tata Small Cap Fund | Nippon India Small Cap Fund |
| Q2 – 2020 | 23.78% | 28.93% |
Key Takeaway:
Nippon India Small Cap Fund performed better during its best quarter, outperforming Tata Small Cap Fund by 5.15%.
Worst Quarters
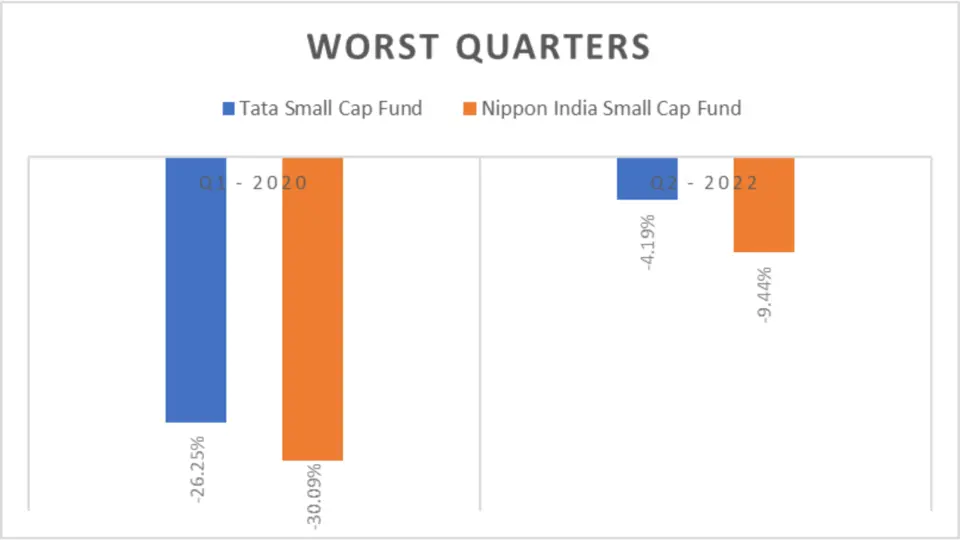
| Period | Tata Small Cap Fund | Nippon India Small Cap Fund |
| Q1 – 2020 | -26.25% | -30.09% |
| Q2 – 2022 | -4.19% | -9.44% |
Key Takeaways
- Q1 – 2020: Tata Small Cap Fund had a less severe drop than Nippon India Small Cap Fund.
- Q2 – 2022: Tata Small Cap Fund also performed better during this period of negative returns.
Analysis
1 Year performance
In the 1-year SIP returns, Nippon India Small Cap Fund outperformed Tata Small Cap Fund by 7.39%, highlighting its short-term solid performance. This can be attributed to its better stock selection and market strategy.
2 Year performance
Over 2 years, the Nippon India Small Cap Fund has shown a higher return of 7.02% than the Tata Small Cap Fund. This indicates its consistent performance and robust portfolio management.
3 Year performance
For the 3-year SIP returns, Nippon India Small Cap Fund leads by 4.93%. This suggests that Nippon India Small Cap Fund’s strategy works well in the medium term, providing better returns to investors.
5 Year performance
Nippon India Small Cap Fund maintains a 4.14% higher return over 5 years, showing its resilience and firm performance in the long term.
Quarterly Returns Analysis
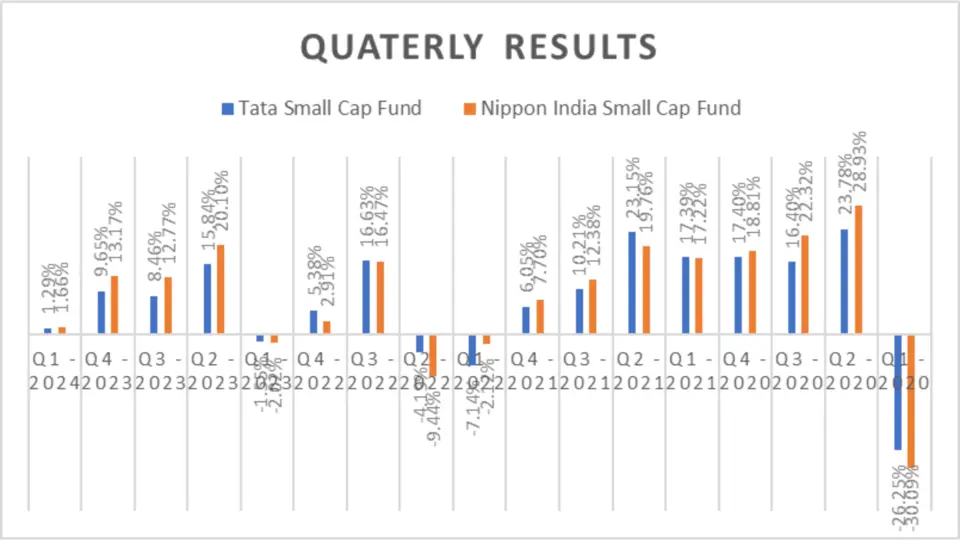
| Period | Tata Small Cap Fund | Nippon India Small Cap Fund |
| Q1 – 2024 | 1.29% | 1.66% |
| Q4 – 2023 | 9.65% | 13.17% |
| Q3 – 2023 | 8.46% | 12.77% |
| Q2 – 2023 | 15.84% | 20.10% |
| Q1 – 2023 | -1.55% | -2.02% |
| Q4 – 2022 | 5.38% | 2.91% |
| Q3 – 2022 | 16.63% | 16.47% |
| Q2 – 2022 | -4.19% | -9.44% |
| Q1 – 2022 | -7.14% | -2.12% |
| Q4 – 2021 | 6.05% | 7.70% |
| Q3 – 2021 | 10.21% | 12.38% |
| Q2 – 2021 | 23.15% | 19.76% |
| Q1 – 2021 | 17.39% | 17.22% |
| Q4 – 2020 | 17.40% | 18.81% |
| Q3 – 2020 | 16.40% | 22.32% |
| Q2 – 2020 | 23.78% | 28.93% |
| Q1 – 2020 | -26.25% | -30.09% |
Key Takeaways:
- Q1 – 2024: Nippon India Small Cap Fund outperformed Tata Small Cap Fund by 0.37%.
- Q4 – 2023: Nippon India Small Cap Fund leads with a return 3.52% higher than Tata Small Cap Fund.
- Q3 – 2023: Nippon India Small Cap Fund again shows better performance with a 4.31% higher return.
- Q2 – 2023: Nippon India Small Cap Fund outperforms by 4.26%.
- Q1 – 2023: Both funds show negative returns, but Tata Small Cap Fund performs slightly better.
- Q4 – 2022: Tata Small Cap Fund performs better by 2.47%.
- Q3 – 2022: Both funds are nearly neck and neck.
- Q2 – 2022: Tata Small Cap Fund outperforms Nippon India Small Cap Fund by 5.25%.
- Q1 – 2022: Nippon India Small Cap Fund shows a smaller negative return.
- Q4 – 2021 to Q1 – 2020: Varied Performance, each fund showing strengths in different quarters.
Total and Average Returns
| Metric | Tata Small Cap Fund | Nippon India Small Cap Fund |
| Total Return | 132.50% | 150.53% |
| Average Return | 7.79% | 8.85% |
Key Takeaways:
- Total Return: Nippon India Small Cap Fund has a total return of 150.53%, 18.03% higher than Tata Small Cap Fund.
- Average Return: Nippon India Small Cap Fund has a higher average return of 8.85%, compared to Tata Small Cap Fund’s 7.79%.
Outperformance Analysis
| Metric | Tata Small Cap Fund | Nippon India Small Cap Fund |
| Outperformance | 7 | 10 |


Risk Analysis
Maximum Drawdown Analysis
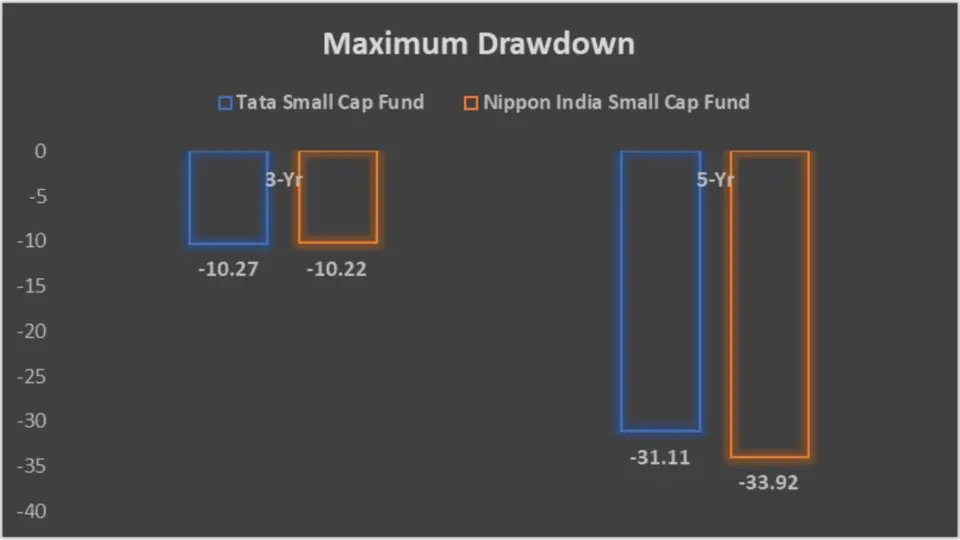
| Metric | 3-Yr | 5-Yr |
| Tata Small Cap Fund | -10.27% | -31.11% |
| Nippon India Small Cap Fund | -10.22% | -33.92% |
Key Takeaways:
- 3-Yr Drawdown: Tata Small Cap Fund has a slightly higher drawdown than Nippon India Small Cap Fund.
- 5-Yr Drawdown: Nippon India Small Cap Fund experienced a higher drawdown than Tata Small Cap Fund.
Mean Return, Sortino And Treynor’s Ratio
| Metric | Tata Small Cap Fund | Nippon India Small Cap Fund |
| Mean Return (%) | 30.23 | 32.66 |
| Sortino (%) | 2.91 | 3.04 |
| Treynor’s Ratio (%) | 0.29 | 0.29 |
Key Takeaways:
- Mean Return: Nippon India Small Cap Fund shows a higher mean return.
- Sortino Ratio: Nippon India Small Cap Fund has a slightly higher Sortino ratio, indicating better risk-adjusted returns.
- Treynor’s Ratio: Both funds have the same Treynor’s Ratio, suggesting similar performance relative to market risk.
Standard Deviation Analysis
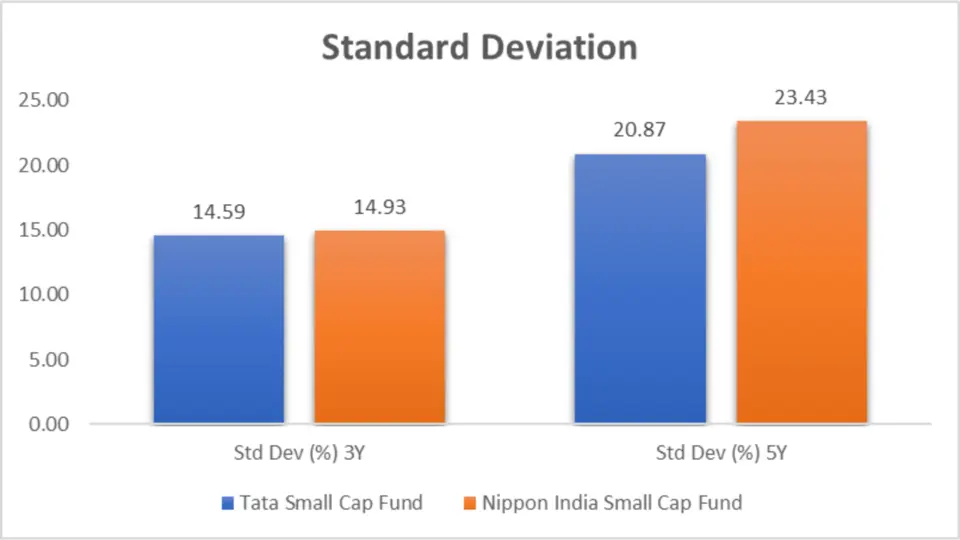
| Metric | 3-Yr | 5-Yr |
| Tata Small Cap Fund | 14.59% | 20.87% |
| Nippon India Small Cap Fund | 14.93% | 23.43% |
Key Takeaways:
- 3-Yr Standard Deviation: Tata Small Cap Fund has a lower standard deviation than Nippon India Small Cap Fund.
- 5-Yr Standard Deviation: Tata Small Cap Fund again shows a lower standard deviation, indicating less volatility.
Sharpe Ratio Analysis
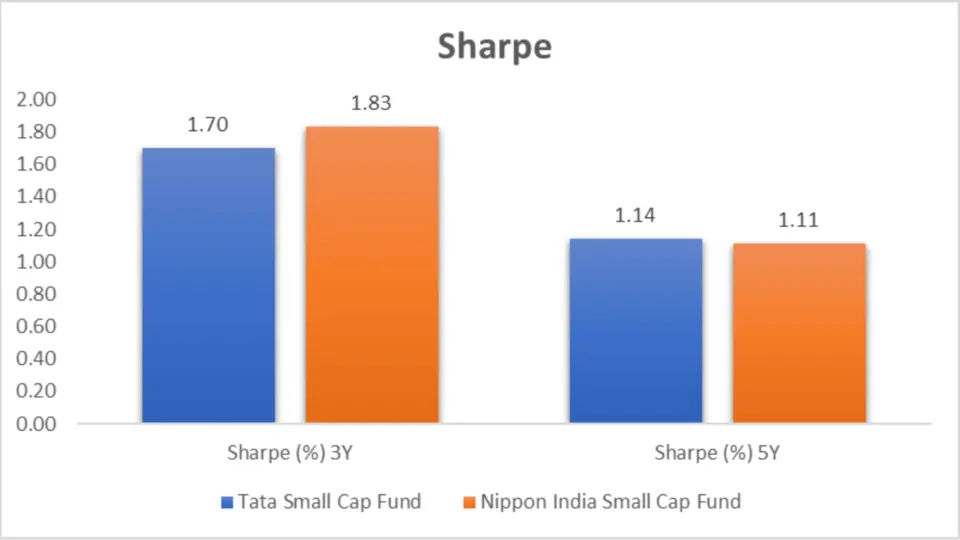
| Metric | 3-Yr | 5-Yr |
| Tata Small Cap Fund | 1.70 | 1.14 |
| Nippon India Small Cap Fund | 1.83 | 1.11 |
Key Takeaways:
- 3-Yr Sharpe Ratio: Nippon India Small Cap Fund has a higher Sharpe ratio, indicating better risk-adjusted returns.
- 5-Yr Sharpe Ratio: Tata Small Cap Fund shows a slightly higher Sharpe ratio, indicating better performance over the long term.
Beta Analysis

| Metric | 3-Yr | 5-Yr |
| Tata Small Cap Fund | 0.75 | 0.82 |
| Nippon India Small Cap Fund | 0.83 | 0.95 |
Key Takeaways:
- 3-Yr Beta: Tata Small Cap Fund has a lower beta, indicating less volatility than Nippon India Small Cap Fund.
- 5-Yr Beta: Tata Small Cap Fund shows a lower beta, suggesting it is less sensitive to market movements.
Alpha
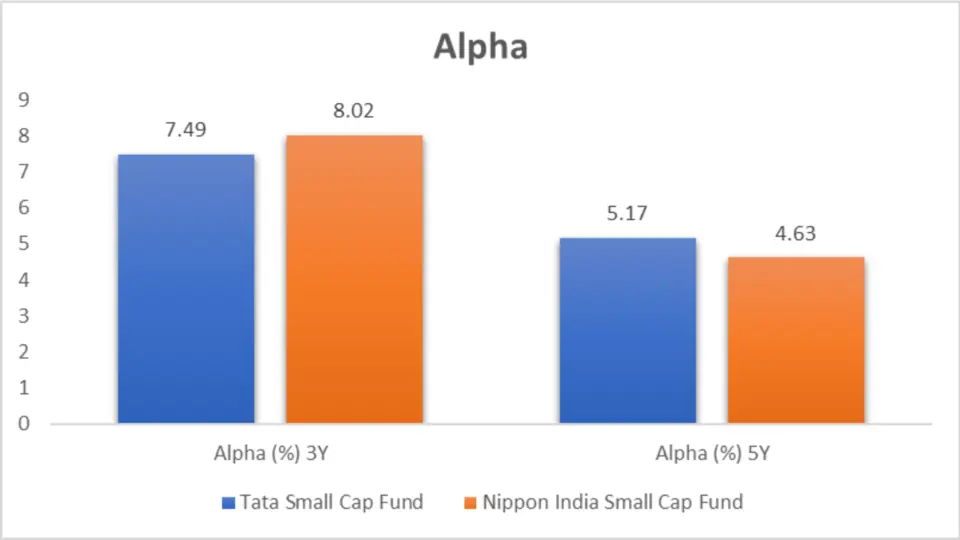
| Metric | 3-Yr | 5-Yr |
| Tata Small Cap Fund | 7.49% | 5.17% |
| Nippon India Small Cap Fund | 8.02% | 4.63% |
Key Takeaways:
- 3-Yr Alpha: Nippon India Small Cap Fund has a higher alpha, indicating better performance than the market.
- 5-Yr Alpha: Tata Small Cap Fund shows a higher alpha, suggesting better long-term performance.
Ratings
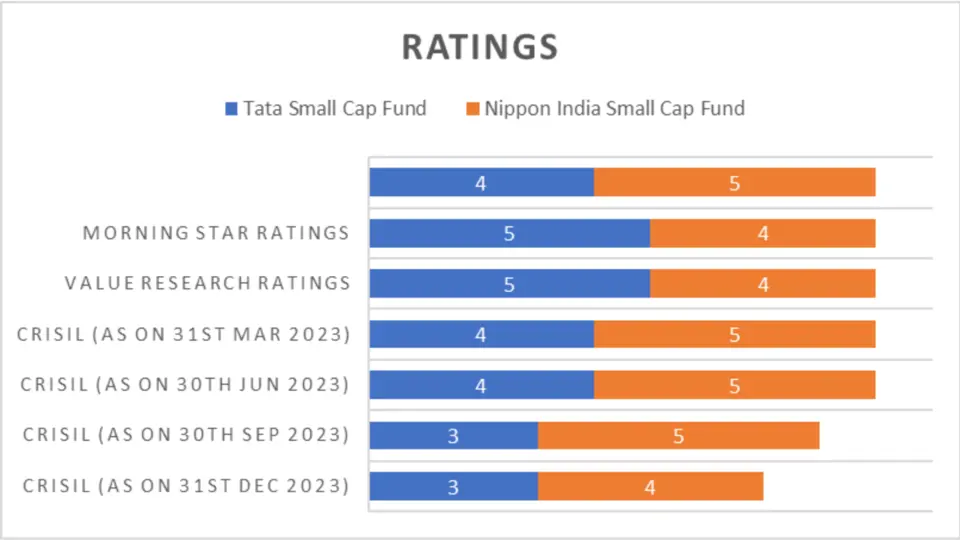
| Rating Date | Tata Small Cap Fund | Nippon India Small Cap Fund |
| CRISIL (as on 31st Mar 2024) | 3 | 4 |
| CRISIL (as on 31st Dec 2023) | 3 | 5 |
| CRISIL (as on 30th Sep 2023) | 4 | 5 |
| CRISIL (as on 30th Jun 2023) | 4 | 5 |
| CRISIL (as on 31st Mar 2023) | 5 | 4 |
| Value Research Ratings | 5 | 4 |
| Morning Star Ratings | 4 | 5 |
Key Takeaways:
- Recent Ratings: Nippon India Small Cap Fund has generally received higher CRISIL ratings in recent quarters compared to Tata Small Cap Fund.
- Value Research Ratings: Tata Small Cap Fund scores higher with a rating of 5 compared to Nippon India’s 4.
- Morning Star Ratings: Nippon India Small Cap Fund scores a 5, whereas Tata Small Cap Fund scores a 4.
Portfolio Analysis
Portfolio Overlapping Comparison
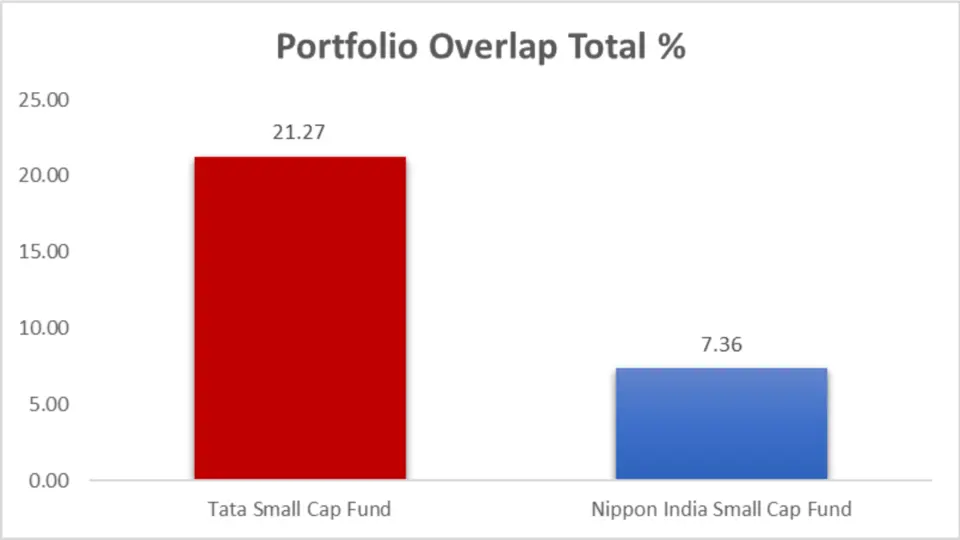
| Metric | Tata Small Cap Fund | Nippon India Small Cap Fund |
| Portfolio Overlap Total % | 21.27% | 7.36% |
Key Takeaways:
Overlap Percentage: Tata Small Cap Fund has a higher portfolio overlap of 21.27%, suggesting it might share more common investments with other funds than Nippon India Small Cap Fund’s 7.36%.
Portfolio Composition
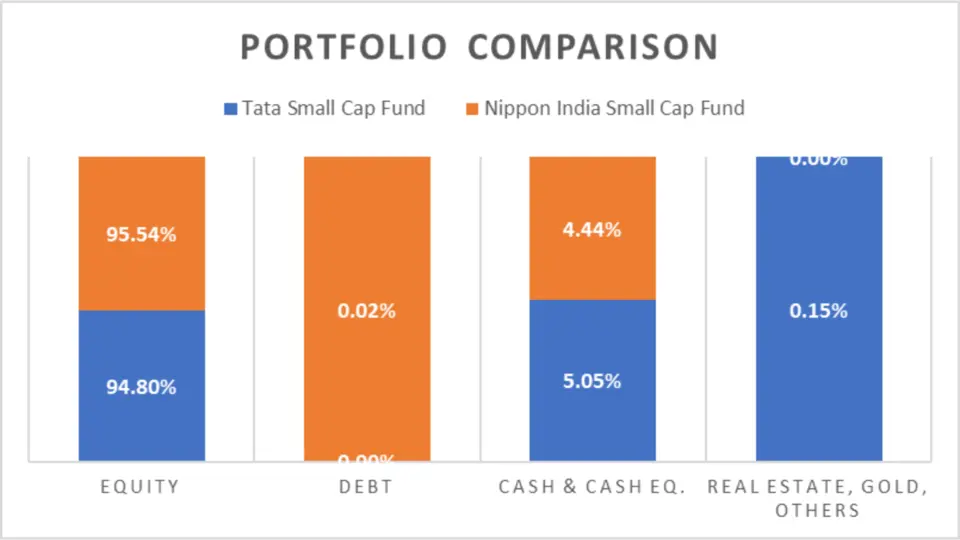
| Asset Type | Tata Small Cap Fund | Nippon India Small Cap Fund |
| Equity | 94.80% | 95.54% |
| Debt | 0.00% | 0.02% |
| Cash & Cash Eq. | 5.05% | 4.44% |
| Real Estate, Gold, Others | 0.15% | 0.00% |
Key Takeaways:
- Equity Allocation: Nippon India Small Cap Fund has a slightly higher equity allocation at 95.54% compared to Tata Small Cap Fund’s 94.80%.
- Debt Allocation: Only Nippon India Small Cap Fund has a minor allocation to debt at 0.02%.
- Cash Holdings: Tata Small Cap Fund has a higher cash holding at 5.05%.
Market Cap Allocation

| Metric | Tata Small Cap Fund | Nippon India Small Cap Fund |
| No of Stocks | 51 | 202 |
| Large Cap | 0.00% | 17.47% |
| Mid Cap | 35.28% | 43.45% |
| Small Cap | 64.72% | 39.07% |
Key Takeaways:
- Stock Diversification: Nippon India Small Cap Fund is more diversified with 202 stocks than Tata Small Cap Fund’s 51 stocks.
- Large Cap Allocation: Nippon India Small Cap Fund includes 17.47% large-cap stocks, while Tata Small Cap Fund has none.
- Mid and Small Cap Allocation: Tata Small Cap Fund focuses more on small-cap stocks (64.72%). Nippon India Small Cap Fund has a higher mid-cap allocation (43.45%).
Sector Allocation
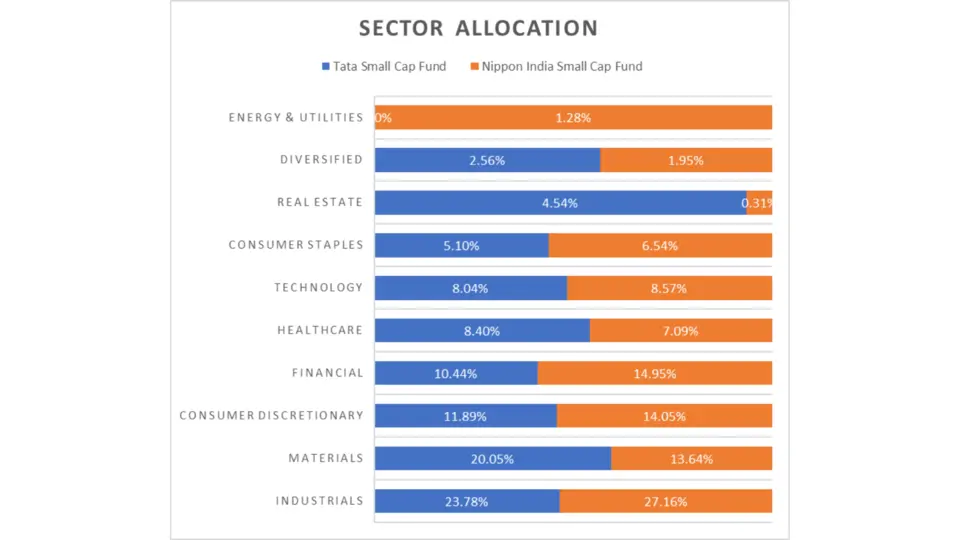
| Sector | Tata Small Cap Fund | Nippon India Small Cap Fund |
| Industrials | 23.78% | 27.16% |
| Materials | 20.05% | 13.64% |
| Consumer Discretionary | 11.89% | 14.05% |
| Financial | 10.44% | 14.95% |
| Healthcare | 8.40% | 7.09% |
| Technology | 8.04% | 8.57% |
| Consumer Staples | 5.10% | 6.54% |
| Real Estate | 4.54% | 0.31% |
| Diversified | 2.56% | 1.95% |
| Energy & Utilities | NA | 1.28% |
Key Takeaways:
- Sector Exposure: Both funds have significant exposure to Industrials, but Nippon India Small Cap Fund has a higher allocation.
- Materials and Real Estate: Tata Small Cap Fund has more exposure to the Materials and Real Estate sectors than Nippon India Small Cap Fund.
- Financial and Consumer Discretionary: Nippon India Small Cap Fund has a higher allocation to the Financial and Consumer Discretionary sectors.
Fund Management Comparison
| Fund | Fund Manager | Months | Till Date |
| Nippon India Small Cap Fund | Samir Rachh | 89 | 02 January 2017 |
| Nippon India Small Cap Fund | Kinjal Desai | 72 | 25 May 2018 |
| Tata Small Cap Fund | Chandraprakash Padiyar | 67 | 13 November 2018 |
| Tata Small Cap Fund | Jeetendra Khatri | 8 | 03 October 2023 |
Key Takeaways:
- Nippon India Small Cap Fund: Samir Rachh has managed for 89 months, providing stability and continuity. Kinjal Desai has been on board for 72 months, adding to the robust management team.
- Tata Small Cap Fund: Chandraprakash Padiyar has managed for 67 months, while Jeetendra Khatri recently joined, bringing fresh perspectives.
General Details
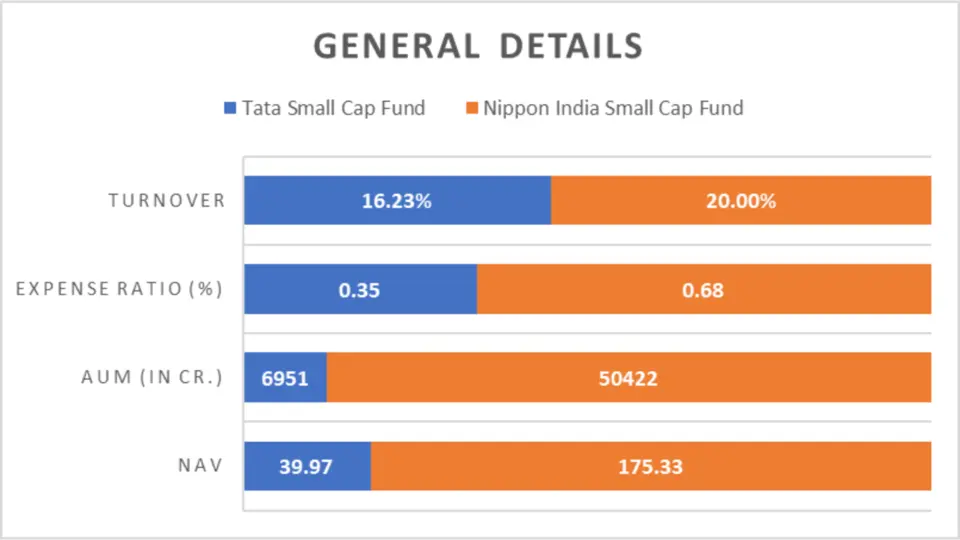
| Metric | Tata Small Cap Fund | Nippon India Small Cap Fund |
| NAV | ₹39.97 | ₹175.33 |
| AUM (in Cr.) | ₹6951 | ₹50422 |
| Expense Ratio (%) | 0.35 | 0.68 |
| Turnover | 16.23% | 20.00% |
| Benchmark | Nifty Small-cap 250 – TRI | Nifty Small-cap 250 – TRI |
Key Takeaways:
- NAV: Nippon India Small Cap Fund has a significantly higher NAV at ₹175.33 compared to Tata Small Cap Fund’s ₹39.97.
- AUM: Nippon India Small Cap Fund manages a much larger AUM of ₹50422 Cr., indicating higher investor confidence and scale.
- Expense Ratio: Tata Small Cap Fund has a lower expense ratio of 0.35%, making it more cost-effective for investors.
- Turnover: Nippon India Small Cap Fund has a higher turnover rate at 20.00%, suggesting more active portfolio management.
Minimum Investment Amount
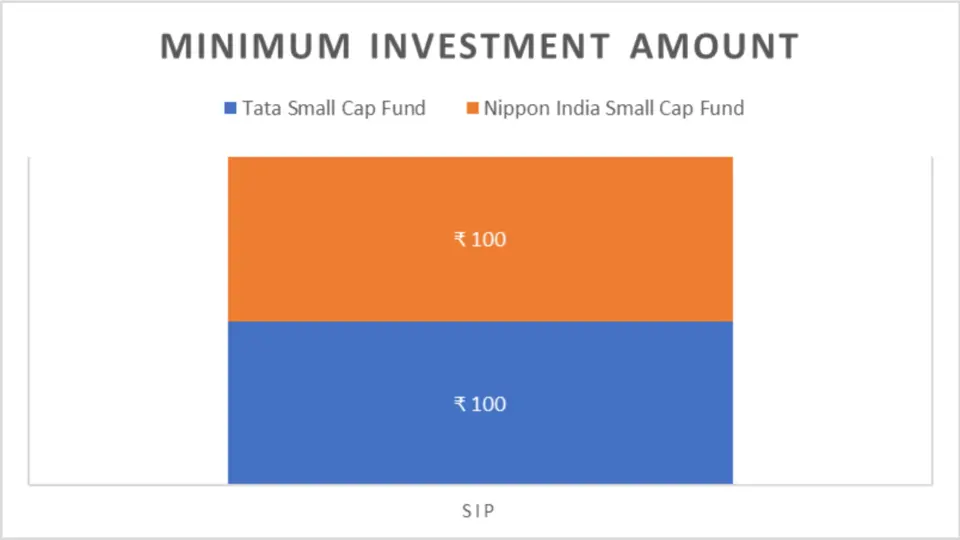
| Investment Type | Tata Small Cap Fund | Nippon India Small Cap Fund |
| SIP | ₹100 | ₹100 |
| Lumpsum | This Fund Doesn’t Support One-Time Investment | This Fund Doesn’t Support One-Time Investment |
Key Takeaways:
- SIP Investment: Both funds have an accessible SIP investment requirement of ₹100.
- Lumpsum Investment: Neither fund supports one-time investments, making SIP the primary investment mode.
Conclusion
In conclusion, both Tata Small Cap Fund and Nippon India Small Cap Fund have their unique strengths and are well-suited for different types of investors. Nippon India Small Cap Fund excels in returns, portfolio diversification, and fund management stability, making it an ideal choice for investors looking for higher growth potential and willing to take on more risk.
With its lower expense ratio and stable performance during downturns, Tata Small Cap Fund is better suited for cost-conscious investors or those with a lower risk appetite. Therefore, Nippon India Small Cap Fund is the better option for those prioritizing higher returns and robust management. In contrast, Tata Small Cap Fund may appeal more to conservative investors looking for cost efficiency and stability.

We hope you found this guide on mutual funds helpful.
If you have any mutual fund-related queries, feel free to comment below—we’re here to help! S.K. Singh, a registered professional with the Association of Mutual Funds in India (AMFI), will answer your queries and holds the ARN-251149.
Invest wisely!
FAQ-Tata Small Cap Fund vs Nippon India Small Cap Fund
What is the investment style of Tata Small Cap Fund and Nippon India Small Cap Fund?
Tata Small Cap Fund and Nippon India Small Cap Fund follow a growth investment style. This means they focus on stocks expected to grow above average compared to other companies.
Which fund has performed better in the past year?
Nippon India Small Cap Fund has outperformed Tata Small Cap Fund in the past year. As of 20 May 2024, Nippon India Small Cap Fund returned 59.76%, while Tata Small Cap Fund returned 46.79%
How do the trailing returns compare over different periods?
1 Year: Nippon India Small Cap Fund outperformed Tata Small Cap Fund by approximately 12.97%.
2 Years: Nippon India Small Cap Fund led with a 5.62% higher return.
3 Years: The gap narrows with Nippon India Small Cap Fund ahead by 3.70%.
5 Years: Nippon India Small Cap Fund maintains a 2.36% higher return.
Which fund shows a higher investment value for lumpsum investments?
Nippon India Small Cap Fund shows a higher value across all periods for lumpsum investments. For instance, over 5 years, an investment in Nippon India Small Cap Fund would have grown to ₹42,938.4 compared to Tata Small Cap Fund’s ₹39,272.7
What are the SIP returns for both funds over different periods?
1 Year: Nippon India Small Cap Fund returned 54.28%, while Tata Small Cap Fund returned 46.89%.
2 Years: Nippon India Small Cap Fund led with a 7.02% higher return.
3 Years: Nippon India Small Cap Fund had a 4.93% higher return.
5 Years: Nippon India Small Cap Fund outperformed by 4.14%.
How do the funds compare regarding CAGR (Compound Annual Growth Rate)?
1 Year: Nippon India Small Cap Fund has a CAGR of 61.06%, significantly higher than Tata Small Cap Fund’s 47.91%.
3 Years: Nippon India Small Cap Fund’s CAGR is 35.41%, compared to Tata Small Cap Fund’s 31.18%.
5 Years: Nippon India Small Cap Fund maintains an edge with a CAGR of 31.17% over Tata Small Cap Fund’s 27.82%.
Which fund shows better rolling returns?
Tata Small Cap Fund shows better-rolling returns across 1, 3, and 5 years, indicating more stable performance during these periods.
What are the annualized returns for both funds?
Nippon India Small Cap Fund has generally shown more vital individual years, such as 2023 and 2021. Still, Tata Small Cap Fund has outperformed in 2019 and 2018.
Which fund has higher total and average returns?
Nippon India Small Cap Fund has a higher total return of 150.53% and an average return of 8.85%, compared to Tata Small Cap Fund’s 132.50% total return and 7.79% average return.
How do the funds compare regarding maximum drawdown and volatility?
3-Year Drawdown: Tata Small Cap Fund had a slightly higher drawdown than Nippon India Small Cap Fund.
5-Year Drawdown: Nippon India Small Cap Fund experienced a higher drawdown.
Volatility: Tata Small Cap Fund has lower volatility (standard deviation) over 3-year and 5-year periods.
What is the expense ratio for both funds?
Tata Small Cap Fund has a lower expense ratio of 0.35% compared to Nippon India Small Cap Fund’s 0.68%.
Which fund is better for aggressive investors?
For aggressive investors with a high-risk appetite, Nippon India Small Cap Fund might be a better investment option due to its higher returns and robust management.
Which fund is better for conservative investors?
Tata Small Cap Fund is more suitable for conservative investors looking for cost efficiency and stability due to its lower expense ratio and stable performance during market downturns.
What is the minimum SIP investment amount for both funds?
Both funds have a minimum SIP investment requirement of ₹100.
What is each fund’s AUM (Assets Under Management)?
Nippon India Small Cap Fund: ₹50,422 crores.
Tata Small Cap Fund: ₹6,951 crores.
What benchmarks do these funds follow?
Both funds follow the Nifty Small Cap 250 – TRI benchmark.
Which fund has better fund management tenure?
Nippon India Small Cap Fund benefits from longer fund management tenure, with Samir Rachh managing for 89 months and Kinjal Desai for 72 months. Tata Small Cap Fund’s Chandraprakash Padiyar has worked for 67 months, with Jeetendra Khatri joining recently for 8 months.
Disclaimer:
The information provided in this article is solely the author/advertisers’ opinion and not investment advice – it is provided for educational purposes only. Using this, you agree that the information does not constitute any investment or financial instructions by Ace Equity Research/Mutual Fund Focus/IPO First and the team. Anyone wishing to invest should seek their own independent financial or professional advice. Conduct your research with registered financial advisors before making any investment decisions. Ace Equity Research/ Mutual Fund Focus / IPO First and the team are not accountable for the investment views provided in the article.
Mutual Fund investments are subject to market risks. Read all scheme-related documents carefully.
Investments in the securities market are subject to market risks. Read all the related documents carefully before investing. Investments in the securities market are subject to market risks. Read all the related documents carefully before investing.