
Introduction
Hey there, fellow investors! If you are planning to dive into PSU funds but are confused about choosing between Aditya Birla Sun Life PSU Equity Fund vs Invesco India PSU Equity Fund. In that case, you’ve come to the right place. In this blog, we’ll break down the nitty-gritty details of these two funds and help you make an informed decision. We’ll look at their investment styles, returns, and overall performance. So let’s get started!
Investment Style
First, let’s talk about the investment styles of these two funds. Understanding their approach can give you a clear idea of what to expect.
| Fund Name | Investment Style |
| Aditya Birla Sun Life PSU Equity Fund | Growth |
| Invesco India PSU Equity Fund | Blend |

Returns Analysis
Now, let’s get into the meat of the discussion – returns. After all, that’s what we’re all here for, right?
Trailing Returns
Here’s a quick look at the trailing returns of both funds over different periods.

| Period Invested for | Aditya Birla Sun Life PSU Equity Fund | Invesco India PSU Equity Fund |
| 1 Year | 102.24% | 105.44% |
| 2 Year | 57.94% | 61.88% |
| 3 Year | 44.03% | 42.22% |
Analysis
- 1 Year: Both funds have performed exceptionally well over the past year. However, Invesco India PSU Equity Fund takes the lead with a return of 105.44%, compared to Aditya Birla Sun Life PSU Equity Fund’s 102.24%.
- 2 Years: Again, Invesco India PSU Equity Fund outshines with a return of 61.88%. At the same time, Aditya Birla Sun Life PSU Equity Fund follows closely at 57.94%.
- 3 Years: The tables turn slightly here, with Aditya Birla Sun Life PSU Equity Fund returning 44.03%, just ahead of Invesco India PSU Equity Fund’s 42.22%.
Lumpsum Investment Value
Let’s see how your lumpsum investments would have grown over the years with each fund.
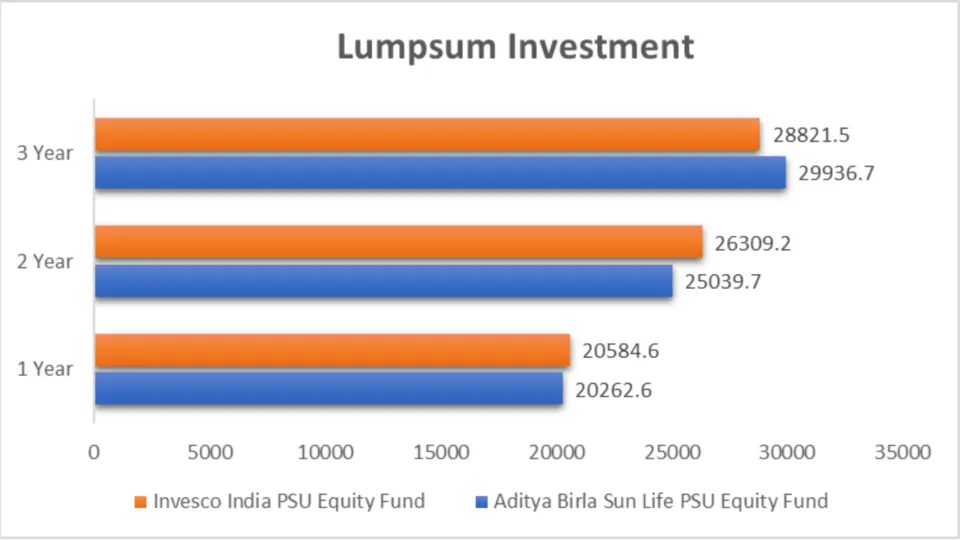
| Period Invested for | Aditya Birla Sun Life PSU Equity Fund (₹) | Invesco India PSU Equity Fund (₹) |
| 1 Year | 20,262.6 | 20,584.6 |
| 2 Year | 25,039.7 | 26,309.2 |
| 3 Year | 29,936.7 | 28,821.5 |
Analysis
- 1 Year: If you had invested a lumpsum amount, your investment in Invesco India PSU Equity Fund would be worth ₹20,584.6 today, slightly higher than ₹20,262.6 with Aditya Birla Sun Life PSU Equity Fund.
- 2 Years: The trend continues with Invesco India PSU Equity Fund growing your investment to ₹26,309.2, compared to ₹25,039.7 in Aditya Birla Sun Life PSU Equity Fund.
- 3 Years: However, over three years, Aditya Birla Sun Life PSU Equity Fund edges ahead, growing your investment to ₹29,936.7, whereas Invesco India PSU Equity Fund would be worth ₹28,821.5.
Key Takeaways
- Short-term Performance: In the short term (1-2 years), Invesco India PSU Equity Fund has shown slightly better performance in both returns and investment value growth.
- Medium-term Performance: Aditya Birla Sun Life PSU Equity Fund has outperformed its counterpart over three years.
- Investment Style: Aditya Birla Sun Life PSU Equity Fund’s growth style might suit investors seeking aggressive capital appreciation. Invesco India PSU Equity Fund’s blend style offers a balanced approach.
SIP Returns
Let’s get straight into the performance with SIP returns over different periods. SIPs are a popular investment route; knowing the returns can help gauge the fund’s performance.

| Period Invested for | Aditya Birla Sun Life PSU Equity Fund | Invesco India PSU Equity Fund |
| 1 Year | 109.75% | 120.24% |
| 2 Year | 76.89% | 80.23% |
| 3 Year | 57.57% | 57.78% |
Analysis
- 1 Year: The Invesco India PSU Equity Fund has delivered a remarkable return of 120.24%, outshining Aditya Birla Sun Life PSU Equity Fund, which returned 109.75%.
- 2 Years: Over two years, Invesco India PSU Equity Fund again leads with an 80.23% return, compared to 76.89% from Aditya Birla Sun Life PSU Equity Fund.
- 3 Years: The difference narrows significantly over three years, with Invesco India PSU Equity Fund at 57.78% and Aditya Birla Sun Life PSU Equity Fund at 57.57%.
SIP Investment Value
Let’s now see the value of investments made via SIPs over different periods. This will help visualize how much your money could have grown.

| Period Invested for | Investments (₹) | Aditya Birla Sun Life PSU Equity Fund (₹) | Invesco India PSU Equity Fund (₹) |
| 1 Year | 12,000 | 18,322.9 | 18,870.48 |
| 2 Year | 24,000 | 45,853.99 | 46,920.81 |
| 3 Year | 36,000 | 78,299.47 | 78,494.98 |
Analysis
- 1 Year: A ₹12,000 investment in Aditya Birla Sun Life PSU Equity Fund would have grown to ₹18,322.9, while in Invesco India PSU Equity Fund, it would be ₹18,870.48.
- 2 Years: Over two years, a ₹24,000 investment would have become ₹45,853.99 in Aditya Birla Sun Life PSU Equity Fund and ₹46,920.81 in Invesco India PSU Equity Fund.
- 3 Years: After three years, a ₹36,000 investment would grow to ₹78,299.47 in Aditya Birla Sun Life PSU Equity Fund, compared to ₹78,494.98 in Invesco India PSU Equity Fund.
Compound Annual Growth Rate (CAGR)
The CAGR provides a smoothed annual return rate over a specific period. Let’s see how both funds have performed in terms of CAGR.

| Category | 1 Year | 3 Year |
| Aditya Birla Sun Life PSU Equity Fund | 96.58% | 44.84% |
| Invesco India PSU Equity Fund | 89.94% | 38.99% |
Analysis
- 1 Year: Aditya Birla Sun Life PSU Equity Fund boasts a higher CAGR of 96.58% compared to Invesco India PSU Equity Fund’s 89.94%.
- 3 Years: Over the three years, Aditya Birla Sun Life PSU Equity Fund again leads with a CAGR of 44.84%, while Invesco India PSU Equity Fund stands at 38.99%.
Rolling Returns
Rolling returns measure the performance consistency of a fund over a period. Let’s look at the 1-year and 3-year rolling returns for both funds.

| Category | 1 Year | 3 Year |
| Aditya Birla Sun Life PSU Equity Fund | 43.71% | 37.82% |
| Invesco India PSU Equity Fund | 21.34% | 15.98% |
Analysis
- 1 Year: Aditya Birla Sun Life PSU Equity Fund shows a rolling return of 43.71%, significantly higher than Invesco India PSU Equity Fund’s 21.34%.
- 3 Years: The trend continues over three years, with Aditya Birla Sun Life PSU Equity Fund delivering 37.82% compared to 15.98% by Invesco India PSU Equity Fund.
Key Takeaways
- CAGR: Aditya Birla Sun Life PSU Equity Fund shows a higher CAGR over 1-year and 3-year periods, indicating better annualized growth.
- Rolling Returns: Aditya Birla Sun Life PSU Equity Fund displays more robust rolling returns, showcasing its consistency and reliability over different time frames.
Annualized/Calendar Year Returns
Annualized or calendar year returns clearly show how the funds performed each year. Let’s examine the yearly performance.
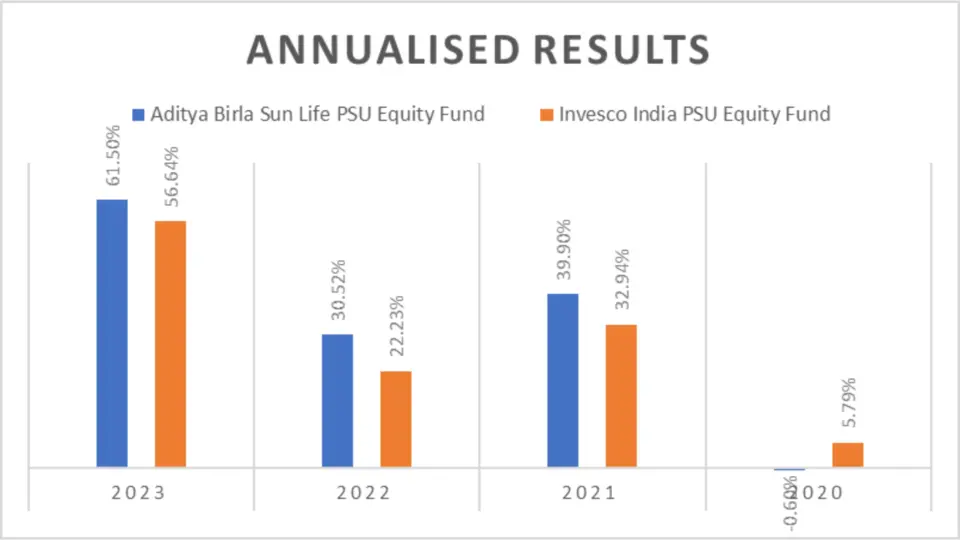
| Period | Aditya Birla Sun Life PSU Equity Fund | Invesco India PSU Equity Fund |
| 2023 | 61.50% | 56.64% |
| 2022 | 30.52% | 22.23% |
| 2021 | 39.90% | 32.94% |
| 2020 | -0.60% | 5.79% |
Analysis
- 2023: Aditya Birla Sun Life PSU Equity Fund achieved a return of 61.50%, surpassing Invesco India PSU Equity Fund’s 56.64%.
- 2022: Aditya Birla Sun Life PSU Equity Fund continued to outperform with a return of 30.52%, compared to 22.23% by Invesco India PSU Equity Fund.
- 2021: Aditya Birla Sun Life PSU Equity Fund recorded a return of 39.90%, ahead of Invesco India PSU Equity Fund’s 32.94%.
- 2020: In 2020, Invesco India PSU Equity Fund performed better, with a return of 5.79%, while Aditya Birla Sun Life PSU Equity Fund had a slightly negative return of -0.60%.
- Outperformance: Aditya Birla Sun Life PSU Equity Fund outperformed Invesco India PSU Equity Fund in three out of four years.
Best Quarters
Lastly, let’s look at the performance of both funds’ best quarters.

| Period | Aditya Birla Sun Life PSU Equity Fund | Invesco India PSU Equity Fund |
| Q4 – 2023 | 24.91% | 21.47% |
Analysis
- Q4 – 2023: During the last quarter of 2023, Aditya Birla Sun Life PSU Equity Fund recorded a return of 24.91%, compared to 21.47% by Invesco India PSU Equity Fund.
Worst Quarters
While the best quarters give us a glimpse of the fund’s potential, it’s equally important to consider its performance during the worst quarters.

| Period | Aditya Birla Sun Life PSU Equity Fund | Invesco India PSU Equity Fund |
| Q1 – 2020 | -26.47% | -18.19% |
| Q2 – 2022 | -10.67% | -10.77% |
Analysis
- Q1 – 2020: Aditya Birla Sun Life PSU Equity Fund suffered a steeper decline of -26.47% compared to Invesco India PSU Equity Fund’s -18.19%.
- Q2 – 2022: Both funds experienced similar declines, with Aditya Birla Sun Life PSU Equity Fund at -10.67% and Invesco India PSU Equity Fund at -10.77%.
Quarterly Results
Let’s break down the performance of each fund every quarter to see how they’ve fared in different market conditions.

| Period | Aditya Birla Sun Life PSU Equity Fund | Invesco India PSU Equity Fund |
| Q2 – 2024 | 9.12% | 16.57% |
| Q1 – 2024 | 14.17% | 14.62% |
| Q4 – 2023 | 24.91% | 21.47% |
| Q3 – 2023 | 20.95% | 14.69% |
| Q2 – 2023 | 11.61% | 15.53% |
| Q1 – 2023 | -4.22% | -2.68% |
| Q4 – 2022 | 15.35% | 10.98% |
| Q3 – 2022 | 13.97% | 17.63% |
| Q2 – 2022 | -10.67% | -10.77% |
| Q1 – 2022 | 9.08% | 3.31% |
| Q4 – 2021 | -3.58% | -4.85% |
| Q3 – 2021 | 8.31% | 9.30% |
| Q2 – 2021 | 14.22% | 13.87% |
| Q1 – 2021 | 13.35% | 9.65% |
| Q4 – 2020 | 21.95% | 13.82% |
| Q3 – 2020 | -4.68% | -4.01% |
| Q2 – 2020 | 18.06% | 21.23% |
Analysis
- Q2 – 2024: Invesco India PSU Equity Fund outperformed with a return of 16.57% compared to Aditya Birla Sun Life PSU Equity Fund’s 9.12%.
- Q4 – 2023: Aditya Birla Sun Life PSU Equity Fund recorded a higher return of 24.91% versus Invesco India PSU Equity Fund’s 21.47%.
- Q2 – 2022: Both funds faced declines, but Aditya Birla Sun Life PSU Equity Fund slightly outperformed with a lesser decline of -10.67% compared to -10.77%.
Total and Average Returns
Here’s a summary of the total and average returns for both funds.
| Metric | Aditya Birla Sun Life PSU Equity Fund | Invesco India PSU Equity Fund |
| Total Return | 171.90% | 160.36% |
| Average Return | 10.11% | 9.43% |
| Outperformance (Quarters) | 9 | 8 |
Analysis
- Total Return: Aditya Birla Sun Life PSU Equity Fund has a higher total return of 171.90% compared to Invesco India PSU Equity Fund’s 160.36%.
- Average Return: The average Return for Aditya Birla Sun Life PSU Equity Fund is 10.11%, whereas for Invesco India PSU Equity Fund, it’s 9.43%.
- Outperformance: Aditya Birla Sun Life PSU Equity Fund outperformed in 9 quarters, while Invesco India PSU Equity Fund outperformed in 8 quarters.


Risk Analysis
Let’s investigate the risk metrics to understand funds’ volatility and risk-adjusted returns.
Mean Return, Sortino Ratio, Std. Deviation, Sharpe Ratio, Beta, Alpha
| Metric | Aditya Birla Sun Life PSU Equity Fund | Invesco India PSU Equity Fund |
| Mean Return (%) | 41.07 | 36.36 |
| Sortino Ratio (%) | 3.78 | 3.39 |
| Standard Deviation (3Y) | 19.86 | 18.2 |
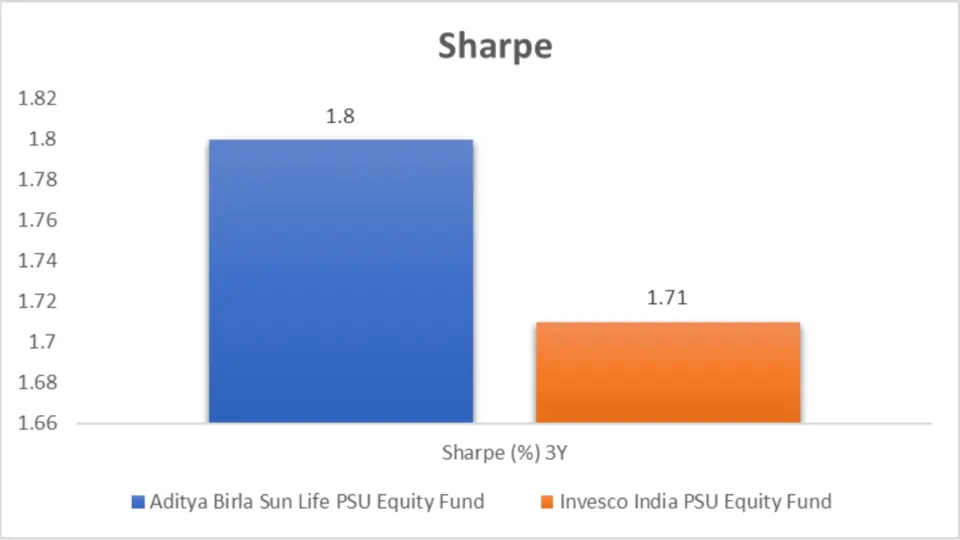
| Sharpe Ratio (3Y) | 1.8 | 1.71 |
| Beta (3Y) | 0.94 | 0.83 |
| Alpha (3Y) | 0.27 | -0.33 |
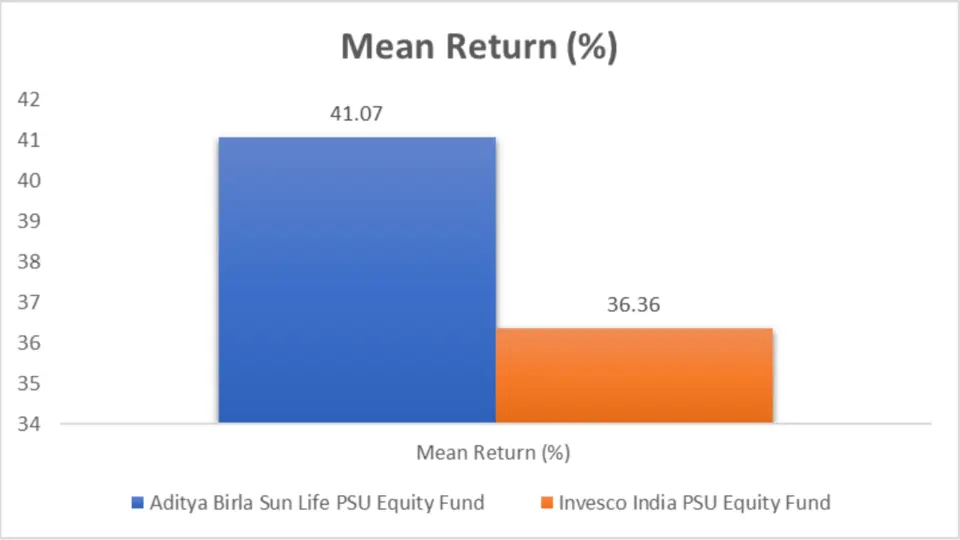

Analysis
- Mean Return: Aditya Birla Sun Life PSU Equity Fund has a higher mean return of 41.07% than Invesco India PSU Equity Fund’s 36.36%.
- Sortino Ratio: Aditya Birla Sun Life PSU Equity Fund also leads with a Sortino Ratio of 3.78 versus Invesco India PSU Equity Fund’s 3.39.
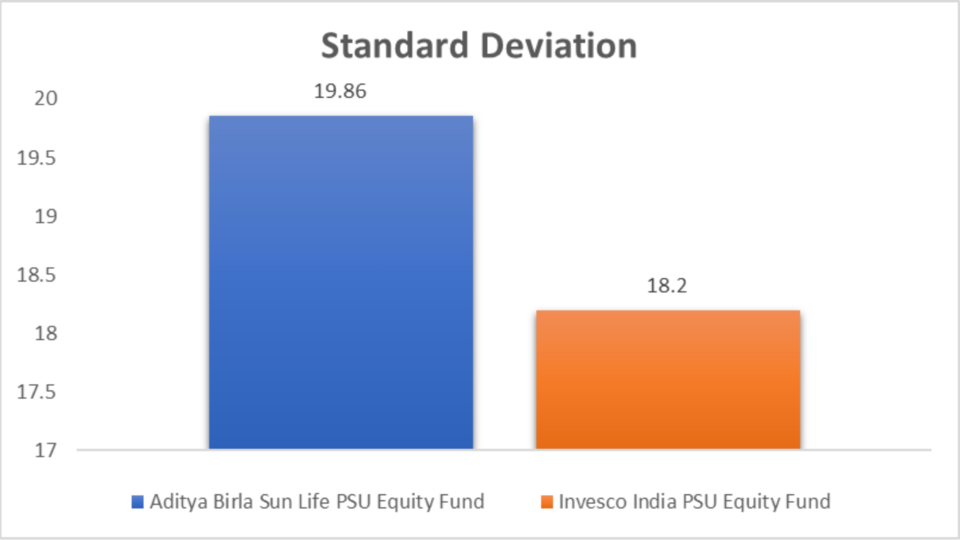
Analysis
- Standard Deviation: Invesco India PSU Equity Fund has a lower standard deviation of 18.2% (3Y), indicating lower volatility than Aditya Birla Sun Life PSU Equity Fund’s 19.86%.
- Sharpe Ratio: Aditya Birla Sun Life PSU Equity Fund has a slightly higher Sharpe Ratio of 1.8 (3Y) than Invesco India PSU Equity Fund’s 1.71.


Analysis
- Beta: Invesco India PSU Equity Fund has a lower beta of 0.83 (3Y), indicating less market movement sensitivity than Aditya Birla Sun Life PSU Equity Fund’s 0.94.
- Alpha: Aditya Birla Sun Life PSU Equity Fund has a positive alpha of 0.27 (3Y), while Invesco India PSU Equity Fund has a negative alpha of -0.33.
Maximum Drawdown
Maximum drawdown measures the most significant drop from a peak to a trough in the fund’s value. This is crucial to understand the risk involved.

| Category | 3-Year |
| Aditya Birla Sun Life PSU Equity Fund | -10.90% |
| Invesco India PSU Equity Fund | -9.98% |
Analysis
- 3-Year: Aditya Birla Sun Life PSU Equity Fund has a maximum drawdown of -10.90%, slightly higher than Invesco India PSU Equity Fund’s -9.98%.
Key Takeaways
- Maximum Drawdown: Aditya Birla Sun Life PSU Equity Fund has a slightly higher maximum drawdown than Invesco India PSU Equity Fund, indicating a marginally higher risk.
- Risk Metrics: Aditya Birla Sun Life PSU Equity Fund shows better risk-adjusted returns as indicated by higher mean Return and Sortino Ratio, but it comes with slightly higher volatility.
Portfolio Analysis
Portfolio Overlapping Comparison
Understanding the portfolio overlap can give insights into the diversification of the funds.

| Metric | Aditya Birla Sun Life PSU Equity Fund | Invesco India PSU Equity Fund |
| Portfolio Overlap Total % | 59.25 | 83.73 |
Analysis
- Portfolio Overlap: Invesco India PSU Equity Fund has a higher portfolio overlap of 83.73%, suggesting more similarity in its holdings than Aditya Birla Sun Life PSU Equity Fund’s 59.25%.
Portfolio Comparison
Let’s break down the portfolio composition of each fund.

| Metric | Aditya Birla Sun Life PSU Equity Fund | Invesco India PSU Equity Fund |
| Equity | 95.18% | 96.53% |
| Cash & Cash Equivalents | 4.82% | 3.47% |
| Debt | 0.00% | 0.00% |
| Real Estate, Gold, Others | – | – |
| Commodities | – | – |
Analysis
- Equity Allocation: Invesco India PSU Equity Fund has a slightly higher equity allocation at 96.53% compared to Aditya Birla Sun Life PSU Equity Fund’s 95.18%.
- Cash & Cash Equivalents: Aditya Birla Sun Life PSU Equity Fund has a higher cash allocation of 4.82% compared to Invesco India PSU Equity Fund’s 3.47%.
Market Cap Allocation
Understanding the market cap allocation can provide insights into the fund’s investment strategy.
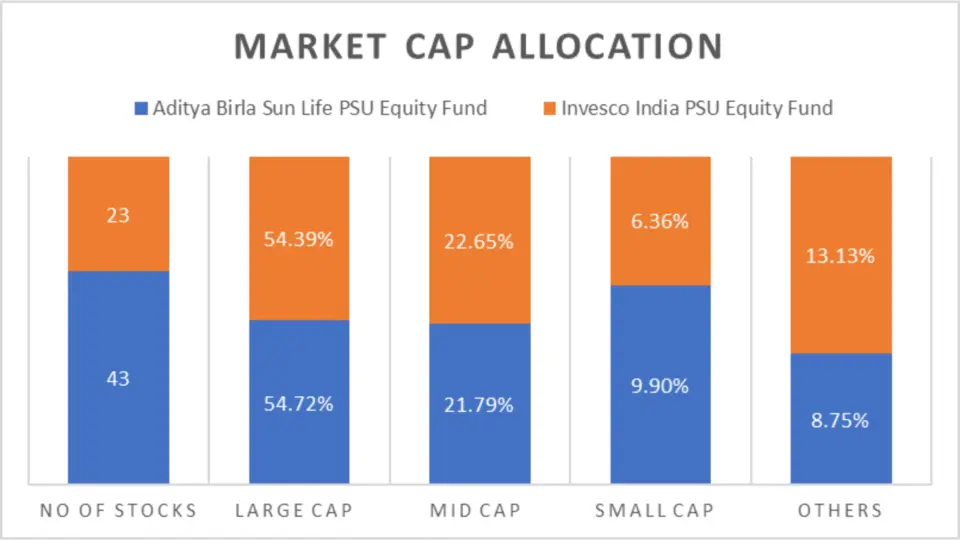
| Metric | Aditya Birla Sun Life PSU Equity Fund | Invesco India PSU Equity Fund |
| No of Stocks | 43 | 23 |
| Large Cap | 54.72% | 54.39% |
| Mid Cap | 21.79% | 22.65% |
| Small Cap | 9.90% | 6.36% |
| Others | 8.75% | 13.13% |
| Foreign Equity Holdings | – | – |
Analysis
- Number of Stocks: Aditya Birla Sun Life PSU Equity Fund holds 43 stocks compared to Invesco India PSU Equity Fund’s 23.
- Large Cap Allocation: Both funds have similar large-cap allocations, with Aditya Birla Sun Life PSU Equity Fund at 54.72% and Invesco India PSU Equity Fund at 54.39%.
- Mid-Cap Allocation: Invesco India PSU Equity Fund has a higher mid-cap allocation at 22.65% compared to Aditya Birla Sun Life PSU Equity Fund’s 21.79%.
- Small Cap Allocation: Aditya Birla Sun Life PSU Equity Fund has a higher small-cap allocation at 9.90% compared to Invesco India PSU Equity Fund’s 6.36%.
- Other Allocations: Invesco India PSU Equity Fund has a higher allocation to different categories at 13.13% compared to Aditya Birla Sun Life PSU Equity Fund’s 8.75%.
Sector Allocation
Sector allocation gives insights into which industries the funds are most heavily invested in.
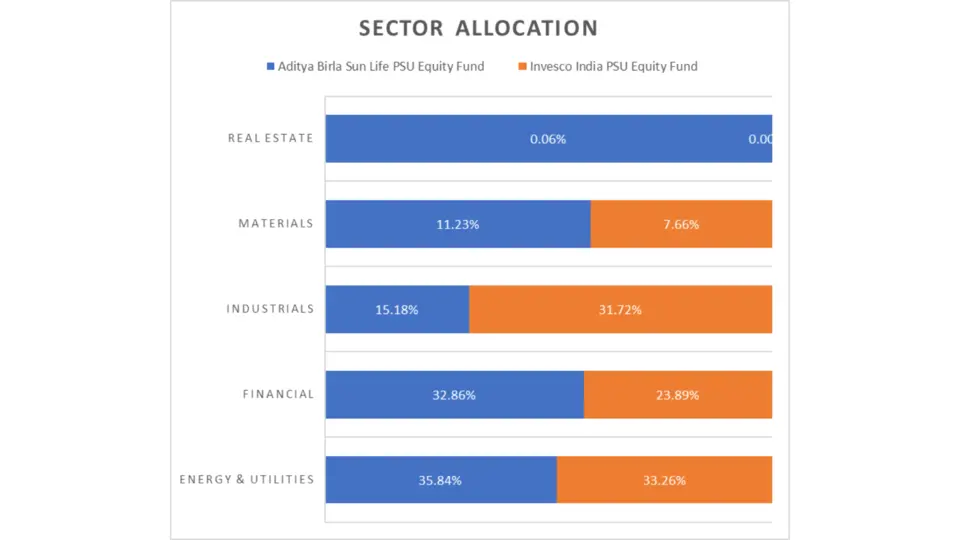
| Sector | Aditya Birla Sun Life PSU Equity Fund | Invesco India PSU Equity Fund |
| Energy & Utilities | 35.84% | 33.26% |
| Financial | 32.86% | 23.89% |
| Industrials | 15.18% | 31.72% |
| Materials | 11.23% | 7.66% |
| Real Estate | 0.06% | NA |
Analysis
- Energy & Utilities: Aditya Birla Sun Life PSU Equity Fund has a slightly higher allocation to energy and utilities at 35.84% compared to Invesco India PSU Equity Fund’s 33.26%.
- Financials: Aditya Birla Sun Life PSU Equity Fund has a higher financial allocation at 32.86% compared to Invesco India PSU Equity Fund’s 23.89%.
- Industrials: Invesco India PSU Equity Fund has a higher allocation to industrials at 31.72% compared to Aditya Birla Sun Life PSU Equity Fund’s 15.18%.
- Materials: Aditya Birla Sun Life PSU Equity Fund has a higher allocation to materials at 11.23% compared to Invesco India PSU Equity Fund’s 7.66%.
Fund Management Comparison
Fund managers play a vital part in the performance of a fund. Let’s compare the fund managers of these two funds.

| Fund | Fund Manager | No. of Months |
| Invesco India PSU Equity Fund | Dhimant Kothari | 48 |
| Aditya Birla Sun Life PSU Equity Fund | Dhaval Gala | 20 |
| Dhaval Joshi | 18 |
Analysis
- Experience: Dhimant Kothari of Invesco India PSU Equity Fund has a longer tenure of 48 months compared to Dhaval Gala and Dhaval Joshi of Aditya Birla Sun Life PSU Equity Fund, who have 20 and 18 months, respectively.
Other Important General Details
Here are some other essential details about these funds.

| Metric | Aditya Birla Sun Life PSU Equity Fund | Invesco India PSU Equity Fund |
| NAV | 37.81 | 76.06 |
| AUM (in Cr.) | 4115 | 956 |
| Expense Ratio (%) | 0.48 | 0.93 |
| Turnover | 62.00% | 45% |
| Benchmark | S&P BSE PSU – TRI | S&P BSE PSU – TRI |
Analysis
- NAV: Invesco India PSU Equity Fund has a higher NAV at 76.06 compared to Aditya Birla Sun Life PSU Equity Fund’s 37.81.
- AUM: Aditya Birla Sun Life PSU Equity Fund has a significantly larger AUM at 4115 Cr. than Invesco India PSU Equity Fund’s 956 Cr.
- Expense Ratio: Aditya Birla Sun Life PSU Equity Fund has a lower expense ratio at 0.48% compared to Invesco India PSU Equity Fund’s 0.93%.
- Turnover: Aditya Birla Sun Life PSU Equity Fund has a higher turnover at 62.00% compared to Invesco India PSU Equity Fund’s 45%.
Minimum Investment Amount
| Investment Type | Aditya Birla Sun Life PSU Equity Fund | Invesco India PSU Equity Fund |
| SIP | ₹100 | ₹500 |
| Lumpsum | ₹500 | ₹1,000 |
Analysis
- SIP Investment: Aditya Birla Sun Life PSU Equity Fund offers a lower minimum SIP investment amount at ₹100 compared to Invesco India PSU Equity Fund’s ₹500.
- Lumpsum Investment: Aditya Birla Sun Life PSU Equity Fund also offers a lower minimum lumpsum investment amount at ₹500 compared to Invesco India PSU Equity Fund’s ₹1,000.
Conclusion
In conclusion, Aditya Birla Sun Life PSU Equity Fund and Invesco India PSU Equity Fund present substantial investment opportunities with unique strengths tailored to different investor profiles. Aditya Birla Sun Life PSU Equity Fund outshines overall performance metrics, boasting higher CAGRs, superior rolling returns, better risk-adjusted returns, and more consistent annualized returns over the past few years, making it the better choice across most parameters.
On the other hand, Invesco India PSU Equity Fund excels in short-term performance (1-2 years), making it a compelling option for investors with a lower risk appetite seeking quicker returns.
Meanwhile, Aditya Birla Sun Life PSU Equity Fund, with its growth-oriented approach and higher long-term returns, is ideal for aggressive investors looking for substantial capital appreciation over a more extended period. Ultimately, your investment choice should align with your investment horizon and risk tolerance, leveraging the specific advantages of each fund to meet your financial goals.

We hope you found this guide on mutual funds helpful.
If you have any mutual fund-related queries, feel free to comment below—we’re here to help! S.K. Singh, a registered professional with the Association of Mutual Funds in India (AMFI), will answer your queries and holds the ARN-251149.
Invest wisely!
FAQs-Aditya Birla Sun Life PSU Equity Fund vs Invesco India PSU Equity Fund
1. What are the critical differences between Aditya Birla Sun Life PSU Equity Fund and Invesco India PSU Equity Fund?
Aditya Birla Sun Life PSU Equity Fund follows a growth investment style, focusing on aggressive capital appreciation. At the same time, Invesco India PSU Equity Fund employs a blended style, offering a balanced approach between growth and stability. Aditya Birla Sun Life PSU Equity Fund generally has higher returns over medium to long-term periods. In contrast, Invesco India PSU Equity Fund shows better short-term performance.
Which fund has performed better in the short term?
Invesco India PSU Equity Fund outperforms Aditya Birla Sun Life PSU Equity Fund in the short term (1-2 years), with higher returns and better growth in investment value.
How do the funds compare in terms of medium-term performance?
Over three years, Aditya Birla Sun Life PSU Equity Fund edges out Invesco India PSU Equity Fund with slightly higher returns and investment value growth.
What is both funds’ Compound Annual Growth Rate (CAGR)?
ABSL PSU Equity Fund has a higher CAGR of 96.58% over one year and 44.84% over three years, compared to Invesco India PSU Equity Fund’s 89.94% and 38.99%, respectively.
How do the funds perform in terms of rolling returns?
Aditya Birla Sun Life PSU Equity Fund displays more substantial rolling returns, with 43.71% over one year and 37.82% over three years, compared to Invesco India PSU Equity Fund’s 21.34% and 15.98%.
What are the annualized returns for these funds?
Aditya Birla Sun Life PSU Equity Fund consistently outperformed Invesco India PSU Equity Fund over the past three years, with returns of 61.50% in 2023, 30.52% in 2022, and 39.90% in 2021.
Which fund has a better risk-adjusted return?
Aditya Birla Sun Life PSU Equity Fund shows better risk-adjusted returns, indicated by higher mean Return, Sortino Ratio, and Sharpe Ratio. However, it comes with slightly higher volatility.
How do the funds compare in terms of portfolio overlap?
Invesco India PSU Equity Fund has a higher portfolio overlap of 83.73%, suggesting more similarity in its holdings than Aditya Birla Sun Life PSU Equity Fund’s 59.25%.
What are the sector allocations for each fund?
ABSL PSU Equity Fund has higher energy, utilities, and financial allocations. In contrast, Invesco India PSU Equity Fund has a higher industrial allocation.
10. Who manages these funds, and how long have they been in charge?
Invesco India PSU Equity Fund is managed by Dhimant Kothari, who has been at the helm for 48 months. The ABSL PSU Equity Fund is managed by Dhaval Gala and Dhaval Joshi, who have 20 and 18 months of tenure.
What are the expense ratios and NAVs of these funds?
The ABSL PSU Equity Fund has a lower expense ratio of 0.48% and an NAV of 37.81. In comparison, Invesco India PSU Equity Fund has an expense ratio of 0.93% and an NAV of 76.06.
What is the minimum investment required for these funds?
Aditya Birla Sun Life PSU Equity Fund requires a minimum SIP investment of ₹100 and a lumpsum investment of ₹500. Invesco India PSU Equity Fund requires a minimum SIP investment of ₹500 and a lumpsum investment of ₹1,000.
Which fund is better for aggressive investors?
With its growth-oriented approach and higher long-term returns, ABSL PSU Equity Fund is better suited for aggressive investors seeking substantial capital appreciation over a more extended period.
Which fund is better for conservative investors?
With its blend style and better short-term performance, Invesco India PSU Equity Fund suits risk-averse investors seeking a balanced approach and stability.
How do the funds compare in terms of maximum drawdown?
ABSL PSU Equity Fund has a slightly higher maximum drawdown of -10.90% compared to Invesco India PSU Equity Fund’s -9.98%, indicating a marginally higher risk.
Disclaimer:
The information provided in this article is solely the author/advertisers’ opinion and not investment advice – it is provided for educational purposes only. Using this, you agree that the information does not constitute any investment or financial instructions by Ace Equity Research/Mutual Fund Focus/IPO First and the team. Anyone wishing to invest should seek their own independent financial or professional advice. Conduct your research with registered financial advisors before making any investment decisions. Ace Equity Research/ Mutual Fund Focus / IPO First and the team are not accountable for the investment views provided in the article.
Mutual Fund investments are subject to market risks. Read all scheme-related documents carefully.
Investments in the securities market are subject to market risks. Read all the related documents carefully before investing.