Hey there, fellow investor! Are you searching for the perfect large-cap mutual fund but stuck between the Axis Bluechip Fund vs SBI Bluechip Fund? Don’t sweat it! We’re about to dive into a detailed comparison of these two giants in large-cap mutual funds. Strap in as we unravel the mysteries behind each fund, helping you make the right call for your long-term investment goals.
Investment Style
Regarding investment style, Axis Bluechip Fund and SBI Bluechip Fund follow a growth-oriented approach. What does this mean for you as an investor? It implies that these funds primarily target stocks with the potential for robust capital appreciation over time. So, if you’re envisioning steady growth and capital appreciation, rest assured that both these funds have covered you in that department.

Returns Analysis
Now, let’s delve into the meat of the matter: returns. After all, returns are the bread and butter of any investment endeavour. Below, we present a detailed analysis of the trailing returns of both Axis Bluechip Fund and SBI Bluechip Fund, based on NAV as of 28th March 2024.
Trailing Returns
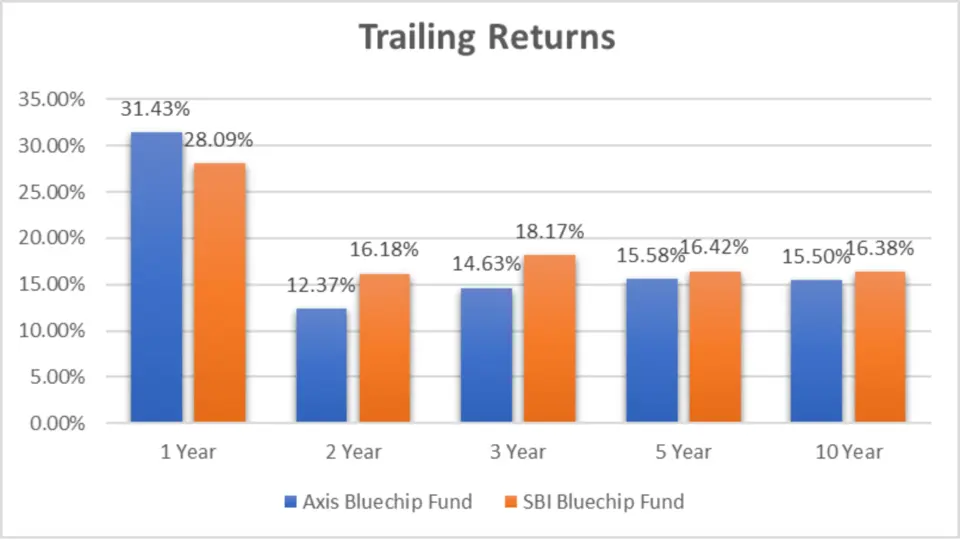
| Period Invested for | Axis Bluechip Fund | SBI Bluechip Fund | Axis Bluechip Fund Outperformance | SBI Bluechip Fund Outperformance |
| 1 Year | 31.43% | 28.09% | 3.34% | NA |
| 2 Year | 12.37% | 16.18% | NA | 3.81% |
| 3 Year | 14.63% | 18.17% | NA | 3.54% |
| 5 Year | 15.58% | 16.42% | NA | 0.84% |
| 10 Year | 15.50% | 16.38% | NA | 0.88% |
Analysis:
- 1 Year: Axis Bluechip Fund outperforms SBI Bluechip Fund with a trailing return of 31.43% compared to 28.09%.
- 2 Year: SBI Bluechip Fund takes the lead here with a trailing return of 16.18% against Axis Bluechip Fund’s 12.37%.
- 3 Year: SBI Bluechip Fund maintains its lead with a trailing return of 18.17%, slightly ahead of Axis Bluechip Fund’s 14.63%.
- 5 Year: Axis Bluechip Fund edges past SBI Bluechip Fund with a trailing return of 15.58% versus 16.42%.
- 10 Year: Once again, Axis Bluechip Fund secures a slightly higher trailing return of 15.50% compared to SBI Bluechip Fund’s 16.38%.
Lumpsum Investment Value
Moving on, let’s analyze the lumpsum investment values of Axis Bluechip Fund and SBI Bluechip Fund, based on NAV as of 28th March 2024.

Lumpsum Investment Value (NAV as of 28th March 2024)
| Period Invested for | Axis Bluechip Fund | SBI Bluechip Fund |
| 1 Year | 13152.8 | 12817.7 |
| 2 Year | 12630 | 13504.5 |
| 3 Year | 15068.3 | 16509.9 |
| 5 Year | 20646.5 | 21400.3 |
| 10 Year | 42306.7 | 45653 |
Analysis:
- 1 Year: Axis Bluechip Fund exhibits a lumpsum investment value of ₹13,152.8, slightly higher than SBI Bluechip Fund’s ₹12,817.7.
- 2 Year: Once again, Axis Bluechip Fund maintains a marginally lower value of ₹12,630 compared to SBI Bluechip Fund’s ₹13,504.5.
- 3 Year: Axis Bluechip Fund’s lumpsum investment value stands at ₹15,068.3, trailing behind SBI Bluechip Fund’s ₹16,509.9.
- 5 Year: Axis Bluechip Fund continues to trail SBI Bluechip Fund with a value of ₹20,646.5 versus ₹21,400.3.
- 10 Year: Axis Bluechip Fund lags behind SBI Bluechip Fund with a lumpsum investment value of ₹42,306.7 compared to ₹45,653.
Key Takeaways
- Investment Style: Axis Bluechip Fund and SBI Bluechip Fund follow a growth-oriented investment style, targeting stocks with potential for capital appreciation.
- Returns Analysis: While Axis Bluechip Fund outperforms SBI Bluechip Fund in the 1-year and 5-year trailing returns, SBI Bluechip Fund takes the lead in the 2-year and 3-year periods. However, the differences in returns between the two funds are marginal.
- Lumpsum Investment Value: SBI Bluechip Fund generally exhibits slightly higher lumpsum investment values than Axis Bluechip Fund across different investment periods.
SIP Returns
Let’s start with a breakdown of SIP returns for Axis Bluechip Fund and SBI Bluechip Fund, based on NAV as of 28th March 2024.
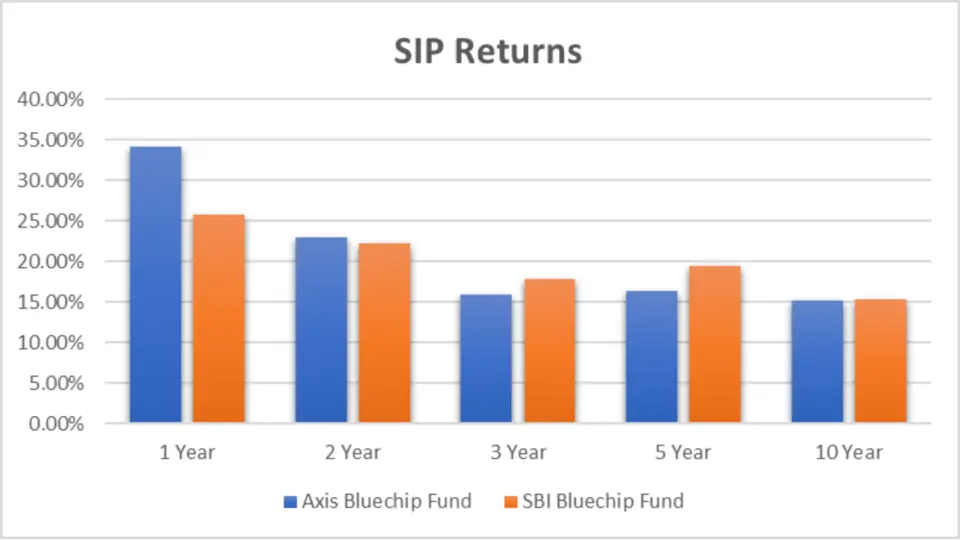
SIP Returns (NAV as of 28th March 2024)
| Period Invested for | Axis Bluechip Fund | SBI Bluechip Fund | Axis Bluechip Fund Outperformance | SBI Bluechip Fund Outperformance |
| 1 Year | 34.14% | 25.82% | 8.32% | NA |
| 2 Year | 22.95% | 22.21% | 0.74% | NA |
| 3 Year | 15.86% | 17.87% | NA | 2.01% |
| 5 Year | 16.30% | 19.37% | NA | 3.07% |
| 10 Year | 15.17% | 15.33% | NA | 0.16% |
Analysis:
- 1 Year: Axis Bluechip Fund outshines SBI Bluechip Fund with a stellar SIP return of 34.14%, showcasing an impressive outperformance of 8.32% over its counterpart.
- 2 Year: While both funds demonstrate robust performance, Axis Bluechip Fund maintains a slight edge with a marginal outperformance of 0.74%.
- 3 Year: SBI Bluechip Fund takes the lead here, boasting a SIP return of 17.87% and outperforming Axis Bluechip Fund by 2.01%.
- 5 Year: Once again, SBI Bluechip Fund exhibits more robust performance over the 5 years, with a notable outperformance of 3.07%.
- 10 Year: Both funds deliver consistent returns over the long term, with SBI Bluechip Fund edging by a marginal 0.16%.
SIP Investment Value
Next, let’s delve into the SIP investment values of Axis Bluechip Fund and SBI Bluechip Fund, based on NAV as of 28th March 2024.

SIP Investment Value (NAV as of 28th March 2024)
| Period Invested for | Investments | Axis Bluechip Fund | SBI Bluechip Fund |
| 1 Year | 12000 | 14122.7 | 13621.23 |
| 2 Year | 24000 | 29978.95 | 29778.33 |
| 3 Year | 36000 | 45539.32 | 46857.84 |
| 5 Year | 60000 | 90180.45 | 97226.46 |
| 10 Year | 120000 | 265508.2 | 267843.02 |
Analysis:
- 1 Year: With an initial investment of ₹12,000, Axis Bluechip Fund yields an impressive SIP value of ₹14,122.7, surpassing SBI Bluechip Fund’s ₹13,621.23.
- 2 Year: Axis Bluechip Fund continues its lead, generating a SIP value of ₹29,978.95 against SBI Bluechip Fund’s ₹29,778.33, with an initial investment of ₹24,000.
- 3 Year: Despite SBI Bluechip Fund’s more robust SIP return, Axis Bluechip Fund showcases a higher SIP value of ₹45,539.32 compared to ₹46,857.84 for SBI Bluechip Fund, with an initial investment of ₹36,000.
- 5 Year: Axis Bluechip Fund maintains its edge, delivering a SIP value of ₹90,180.45, while SBI Bluechip Fund trails slightly behind at ₹97,226.46, with an initial investment of ₹60,000.
- 10 Year: Both funds exhibit substantial growth over the long term, with Axis Bluechip Fund yielding a SIP value of ₹2,65,508.2 and SBI Bluechip Fund at ₹2,67,843.02, with an initial investment of ₹120,000.
Key Takeaways
- SIP Returns: Axis Bluechip Fund demonstrates superior SIP returns in the 1-year and 2-year periods. At the same time, SBI Bluechip Fund outperforms in the 3-year and 5-year periods. Over the long term, both funds deliver consistent returns.
- SIP Investment Value: Despite variations in SIP returns, Axis Bluechip Fund consistently showcases higher SIP investment values across different investment periods, indicating its potential for wealth accumulation over time.
CAGR Analysis
Let’s start our analysis by examining the Compound Annual Growth Rate (CAGR) of Axis Bluechip Fund and SBI Bluechip Fund across different time frames.

| Category | Axis Bluechip Fund | SBI Bluechip Fund |
| 1 Y | 33.21% | 30.44% |
| 3 Y | 13.41% | 16.43% |
| 5 Y | 15.38% | 16.18% |
| 9 Y | 13.44% | 13.21% |
Analysis:
- 1 Year: Axis Bluechip Fund exhibits a CAGR of 33.21%, surpassing SBI Bluechip Fund’s 30.44%.
- 3 Year: SBI Bluechip Fund takes the lead here with a CAGR of 16.43%, outperforming Axis Bluechip Fund’s 13.41%.
- 5 Year: Both funds demonstrate comparable performance, with SBI Bluechip Fund slightly ahead at 16.18% compared to Axis Bluechip Fund’s 15.38%.
- 9 Year: Once again, Axis Bluechip Fund and SBI Bluechip Fund showcase similar CAGR, with marginal differences.
Key Takeaways:
- Axis Bluechip Fund outperforms SBI Bluechip Fund in the 1-year category, showcasing higher growth.
- SBI Bluechip Fund exhibits more robust performance over the 3 years, indicating its resilience and consistency.
- Both funds demonstrate competitive CAGR figures, highlighting their prospective for wealth creation over the long term.
Rolling Returns Analysis
Now, let’s delve into the Rolling Returns of Axis Bluechip Fund and SBI Bluechip Fund, providing a deeper understanding of their performance dynamics.
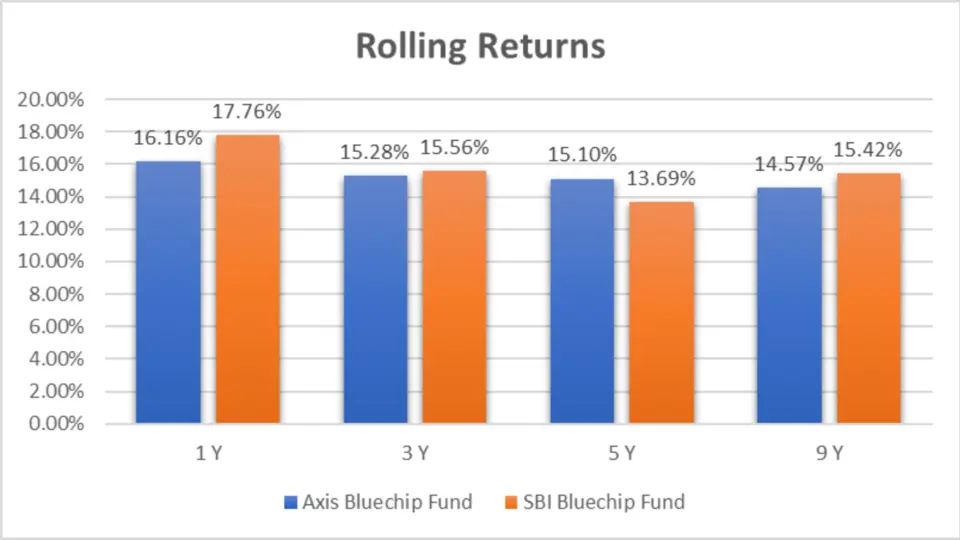
Rolling Returns
| Category | 1 Y | 3 Y | 5 Y | 9 Y |
| Axis Bluechip Fund | 16.16% | 15.28% | 15.10% | 14.57% |
| SBI Bluechip Fund | 17.76% | 15.56% | 13.69% | 15.42% |
Analysis:
- 1 Year: SBI Bluechip Fund exhibits a Rolling Return of 17.76%, outperforming Axis Bluechip Fund’s 16.16%.
- 3 Year: Both funds showcase competitive performance, with minor differences in Rolling Returns.
- 5 Year: Axis Bluechip Fund demonstrates more robust performance with a Rolling Return of 15.10% compared to SBI Bluechip Fund’s 13.69%.
- 9 Year: SBI Bluechip Fund takes the lead here, showcasing higher Rolling Returns.
Key Takeaways:
- SBI Bluechip Fund outperforms Axis Bluechip Fund in the 1-year Rolling Returns category, indicating its short-term growth potential.
- Axis Bluechip Fund demonstrates more robust performance over the 5 years, showcasing its resilience and consistency in delivering returns.
- Both funds exhibit competitive Rolling Returns, reflecting their ability to navigate market fluctuations and deliver value to investors.
Annualized/Calendar Year Returns
Let’s start by examining the annualized returns of Axis Bluechip Fund and SBI Bluechip Fund over the past several calendar years.

Annualised/Calendar Year Returns (NAV as of 28th March 2024)
| Period | Axis Bluechip Fund | SBI Bluechip Fund |
| 2023 | 17.84% | 22.82% |
| 2022 | -4.62% | 5.11% |
| 2021 | 20.82% | 25.05% |
| 2020 | 21.06% | 16.81% |
| 2019 | 20.47% | 12.67% |
| 2018 | 8.98% | -2.58% |
| 2017 | 39.81% | 31.71% |
Outperformance Count
| Fund | No. of times Outperformance |
| Axis Bluechip Fund | 4 |
| SBI Bluechip Fund | 3 |
Analysis:
- 2023: SBI Bluechip Fund outperforms Axis Bluechip Fund with a return of 22.82% compared to 17.84%.
- 2022: Both funds exhibit negative returns, but SBI Bluechip Fund fares better with -4.62% against Axis Bluechip Fund’s -5.11%.
- 2021: SBI Bluechip Fund again takes the lead, yielding a return of 25.05% versus 20.82% for Axis Bluechip Fund.
- 2020: Axis Bluechip Fund outshines SBI Bluechip Fund with a return of 21.06% against 16.81%.
- 2019: Axis Bluechip Fund demonstrates superior performance with a return of 20.47% compared to 12.67% for SBI Bluechip Fund.
- 2018: Despite market volatility, both funds deliver positive returns, with Axis Bluechip Fund leading at 8.98% against SBI Bluechip Fund’s -2.58%.
- 2017: Axis Bluechip Fund showcases impressive growth, yielding 39.81% returns, outpacing SBI Bluechip Fund’s 31.71%.
Key Takeaways:
- Axis Bluechip Fund and SBI Bluechip Fund have delivered positive returns over the years, reflecting their resilience and stability in varying market conditions.
- While the SBI Bluechip Fund has outperformed the Axis Bluechip Fund in certain years, it has also demonstrated its prowess and superior returns in other periods.
Best Quarters
Now, let’s zoom in and explore the best quarters for Axis Bluechip Fund and SBI Bluechip Fund.
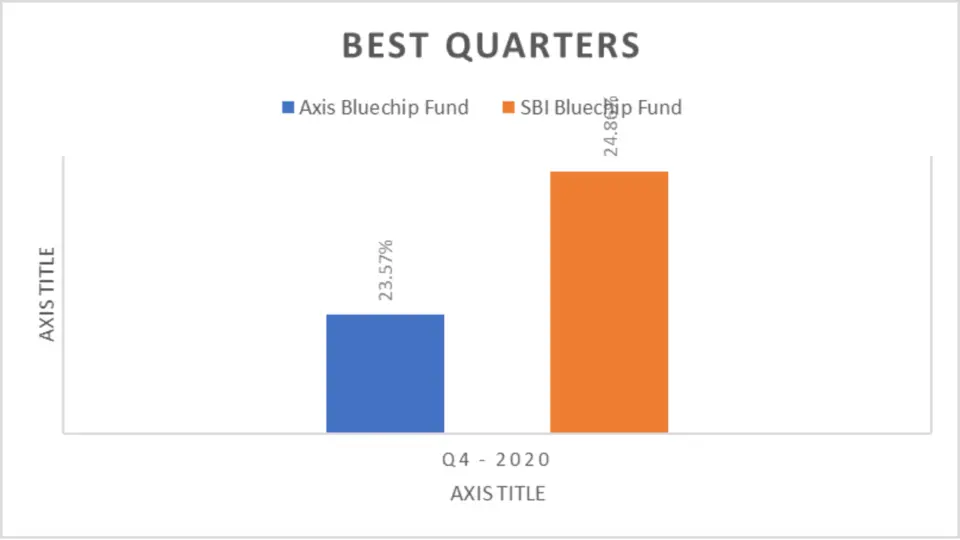
Best Quarters
| Period | Axis Bluechip Fund | SBI Bluechip Fund |
| Q4 – 2020 | 23.57% | 24.86% |
| Q2 – 2020 | 14.80% | 23.84% |
Analysis:
- Q4 – 2020: SBI Bluechip Fund slightly outperforms Axis Bluechip Fund with a return of 24.86% compared to 23.57%.
- Q2 – 2020: SBI Bluechip Fund showcases more robust performance with a return of 23.84% against 14.80% for Axis Bluechip Fund.
Key Takeaways:
- SBI Bluechip Fund demonstrates its prowess with higher returns in the best quarters, showcasing its ability to capitalize on market opportunities.
- While Axis Bluechip Fund maintains competitive performance, there are quarters where SBI Bluechip Fund takes the lead.
Number of Times Outperformance
Lastly, let’s tally up the number of times each fund has outperformed the other.
- Axis Bluechip Fund: 4 times
- SBI Bluechip Fund: 3 times
Key Takeaway:
- Axis Bluechip Fund has outperformed SBI Bluechip Fund four times, highlighting its consistent delivery of superior returns.
Worst Quarters
Let’s start by analyzing the worst quarters for Axis Bluechip Fund and SBI Bluechip Fund.
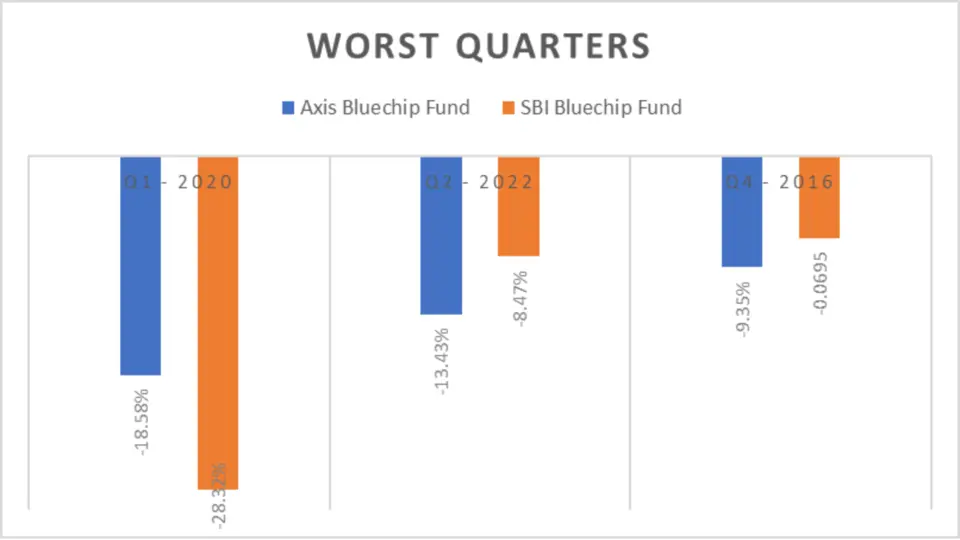
Worst Quarters
| Period | Axis Bluechip Fund | SBI Bluechip Fund |
| Q1 – 2020 | -18.58% | -28.32% |
| Q2 – 2022 | -13.43% | -8.47% |
Analysis:
- Q1 – 2020: Both funds experienced a downturn in the first quarter of 2020, with Axis Bluechip Fund declining by 18.58% and SBI Bluechip Fund witnessing a steeper drop of 28.32%.
- Q2 – 2022: Axis Bluechip Fund recorded a negative return of 13.43%. SBI Bluechip Fund fared slightly better, with a decline of 8.47%.
Key Takeaways:
- The first quarter of 2020 marked a period of significant market volatility, resulting in substantial losses for both funds.
- Despite facing challenges, Axis Bluechip Fund demonstrated resilience during the worst quarters, with relatively more minor declines compared to SBI Bluechip Fund.
Outperformance in Worst Quarters
Let’s examine the extent of outperformance by each fund during their worst quarters.
| Outperformance | Axis Bluechip Fund | SBI Bluechip Fund |
| Worst Quarters | 9.74% | NA |
| NA | 4.96% | |
| Maximum Drawdown | NA | 9.3 |
| 6.75 | NA |
Analysis:
- Worst Quarters Outperformance: Axis Bluechip Fund demonstrated an outperformance of 9.74% during its worst quarters, while SBI Bluechip Fund’s outperformance was 4.96%.
Key Takeaways:
- Despite experiencing downturns, both funds showcased outperformance during their worst quarters, with Axis Bluechip Fund leading the pack.
- Axis Bluechip Fund demonstrated better risk-adjusted returns with higher outperformance during the maximum drawdown period over the 3-year horizon.
Quarterly Results Analysis
Let’s start by analyzing the quarterly results of both funds, comparing their performance over multiple quarters.
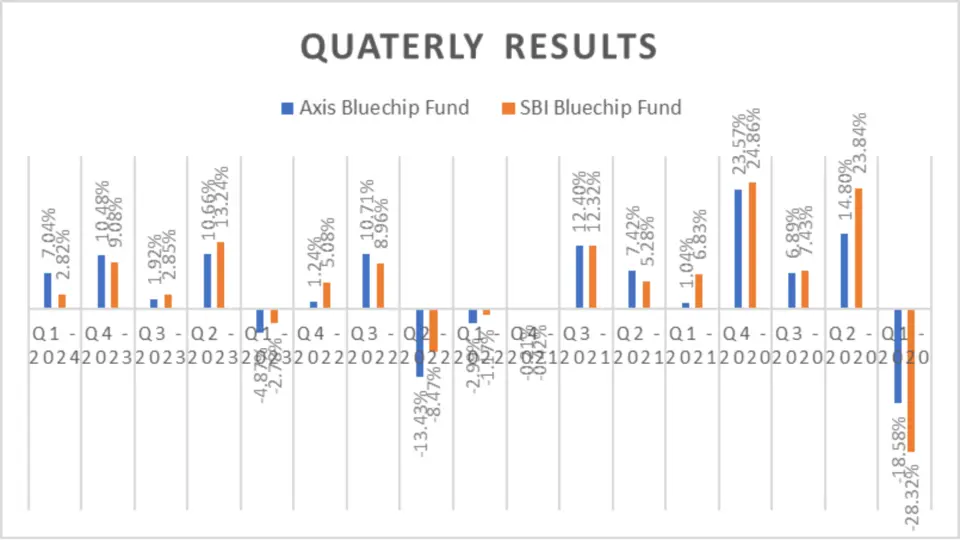
Quarterly Results (NAV as of 28th March 2024)
| Period | Axis Bluechip Fund | SBI Bluechip Fund | Axis Bluechip Fund Outperformance | SBI Bluechip Fund Outperformance |
| Q1 – 2024 | 7.04% | 2.82% | 4.22% | NA |
| Q4 – 2023 | 10.48% | 9.08% | 1.40% | NA |
| Q3 – 2023 | 1.92% | 2.85% | NA | 0.93% |
| Q2 – 2023 | 10.66% | 13.24% | NA | 2.58% |
| Q1 – 2023 | -4.87% | -2.78% | NA | 2.09% |
| Q4 – 2022 | 1.24% | 5.08% | NA | 3.84% |
| Q3 – 2022 | 10.71% | 8.96% | 1.75% | NA |
| Q2 – 2022 | -13.43% | -8.47% | NA | 4.96% |
| Q1 – 2022 | -2.99% | -1.17% | NA | 1.82% |
| Q4 – 2021 | -0.21% | -0.42% | 0.21% | NA |
| Q3 – 2021 | 12.40% | 12.32% | 0.08% | NA |
| Q2 – 2021 | 7.42% | 5.28% | 2.14% | NA |
| Q1 – 2021 | 1.04% | 6.83% | NA | 5.79% |
| Q4 – 2020 | 23.57% | 24.86% | NA | 1.29% |
| Q3 – 2020 | 6.89% | 7.43% | NA | 0.54% |
| Q2 – 2020 | 14.80% | 23.84% | NA | 9.04% |
| Q1 – 2020 | -18.58% | -28.32% | 9.74% | NA |
| Q4 – 2019 | 3.91% | 5.25% | NA | 1.34% |
| Q3 – 2019 | 3.60% | -1.76% | 5.36% | NA |
| Q2 – 2019 | 5.93% | 3.10% | 2.83% | NA |
| Q1 – 2019 | 4.68% | 5.27% | NA | 0.59% |
| Q4 – 2018 | 2.33% | 1.36% | 0.97% | NA |
| Q3 – 2018 | -1.77% | -2.17% | 0.40% | NA |
| Q2 – 2018 | 10.23% | 1.22% | 9.01% | NA |
| Q1 – 2018 | -1.54% | -3.37% | 1.83% | NA |
| Q4 – 2017 | 7.36% | 8.63% | NA | 1.27% |
| Q3 – 2017 | 6.98% | 2.94% | 4.04% | NA |
| Q2 – 2017 | 6.86% | 4.34% | 2.52% | NA |
| Q1 – 2017 | 13.91% | 12.89% | 1.02% | NA |
| Q4 – 2016 | -9.35% | -6.95% | NA | 2.40% |
| Q3 – 2016 | 3.72% | 6.07% | NA | 2.35% |
Outperformance
| Fund | Outperformance Count |
| Axis Bluechip Fund | 7 |
| SBI Bluechip Fund | 10 |
Analysis:
- Q1 – 2024: Axis Bluechip Fund starts the year strong with a return of 7.04%, outperforming SBI Bluechip Fund by 4.22%.
- Q4 – 2023: Both funds deliver positive returns, with Axis Bluechip Fund slightly edging out SBI Bluechip Fund by 1.40%.
- Q3 – 2023: SBI Bluechip Fund outperforms Axis Bluechip Fund by 0.93%, although both funds show modest gains.
- Q2 – 2023: SBI Bluechip Fund outperforms Axis Bluechip Fund by 2.58%, showcasing more robust performance this quarter.
- Q1 – 2023: Despite both funds recording negative returns, Axis Bluechip Fund outperforms SBI Bluechip Fund by 2.09%.
Key Takeaways:
- Axis Bluechip Fund and SBI Bluechip Fund exhibit varying performance across different quarters, reflecting market dynamics and fund management strategies.
- Axis Bluechip Fund has demonstrated outperformance in several quarters, indicating its ability to weather market downturns and capitalize on opportunities.
- Investors should consider the quarterly performance of both funds in conjunction with their investment objectives and risk tolerance when making investment decisions.
Overall Outperformance
Let’s tally up the number of times each fund has outperformed the other across all quarters.
- Axis Bluechip Fund Outperformance: 7 times
- SBI Bluechip Fund Outperformance: 10 times
Key Takeaway:
- While SBI Bluechip Fund has outperformed Axis Bluechip Fund more frequently, Axis Bluechip Fund has also showcased strong performance in several quarters, highlighting its competitive positioning in the market.
Risk Analysis
Maximum Drawdown
Now, let’s explore the maximum drawdowns of both funds over the 3-year and 5-year periods.

Maximum Drawdown
| Category | 3-Yr | 5-Yr |
| Axis Bluechip Fund | -16.63 | -19.19 |
| SBI Bluechip Fund | -9.88 | -28.49 |
Analysis:
- 3-Year Period: Axis Bluechip Fund experienced a maximum drawdown of -16.63%, while SBI Bluechip Fund’s drawdown was comparatively lower at -9.88%.
- 5-Year Period: SBI Bluechip Fund faced a more significant drawdown of -28.49% over the 5 years, whereas Axis Bluechip Fund’s drawdown stood at -19.19%.
- Maximum Drawdown Outperformance: Axis Bluechip Fund outperformed SBI Bluechip Fund with a drawdown outperformance of 6.75% over the 3 years, while SBI Bluechip Fund exhibited a higher outperformance of 9.3% over the 5 years.
Key Takeaways:
- Axis Bluechip Fund demonstrated lower drawdowns over the 3-year and 5-year periods, indicating better risk management and downside protection.
- SBI Bluechip Fund experienced a more substantial drawdown over the 5 years, highlighting the importance of considering risk factors when evaluating investment options.
Mean Return, Sortino Ratio, and Treynor’s Ratio
First, let’s delve into the performance metrics that gauge returns relative to risk.
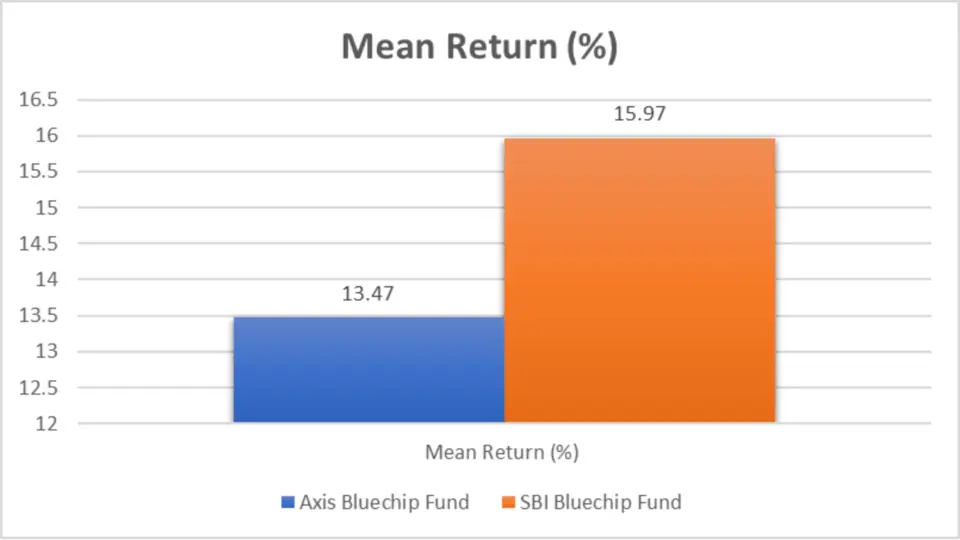
| Metrics | Axis Bluechip Fund | SBI Bluechip Fund |
| Mean Return (%) | 13.47 | 15.97 |
| Sortino Ratio (%) | 1.37 | 2.29 |
| Treynor’s Ratio (%) | 0.05 | 0.08 |
Key Analysis:
- Mean Return: The SBI Bluechip Fund exhibits a slightly higher mean return, indicating potentially better performance in generating returns over the specified period.
- Sortino Ratio: SBI Bluechip Fund outshines Axis Bluechip Fund, suggesting better risk-adjusted returns concerning downside volatility.
- Treynor’s Ratio: Both funds show low ratios, but SBI Bluechip Fund edges slightly ahead, implying better systematic risk returns per unit.
Standard Deviation
Next, let’s assess the volatility of returns over different time horizons.
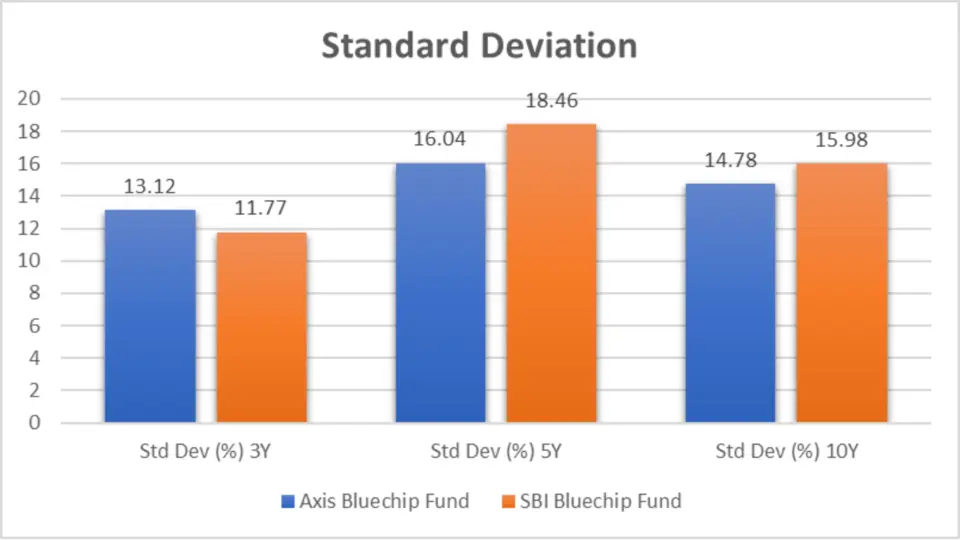
Standard Deviation Analysis
| Category | Std Dev (%) 3Y | Std Dev (%) 5Y | Std Dev (%) 10Y |
| Axis Bluechip Fund | 13.12 | 16.04 | 14.78 |
| SBI Bluechip Fund | 11.77 | 18.46 | 15.98 |
Key Analysis:
- 3-Year Volatility: Axis Bluechip Fund has demonstrated lower volatility over the past three years, implying comparatively stable returns.
- 5-Year Volatility: SBI Bluechip Fund shows higher volatility, indicating more significant price fluctuations over the past five years.
- 10-Year Volatility: Both funds exhibit similar volatility over the past decade, with Axis Bluechip Fund having a slightly lower standard deviation.
Sharpe Ratio
Let’s evaluate risk-adjusted returns using the Sharpe ratio across different timeframes.
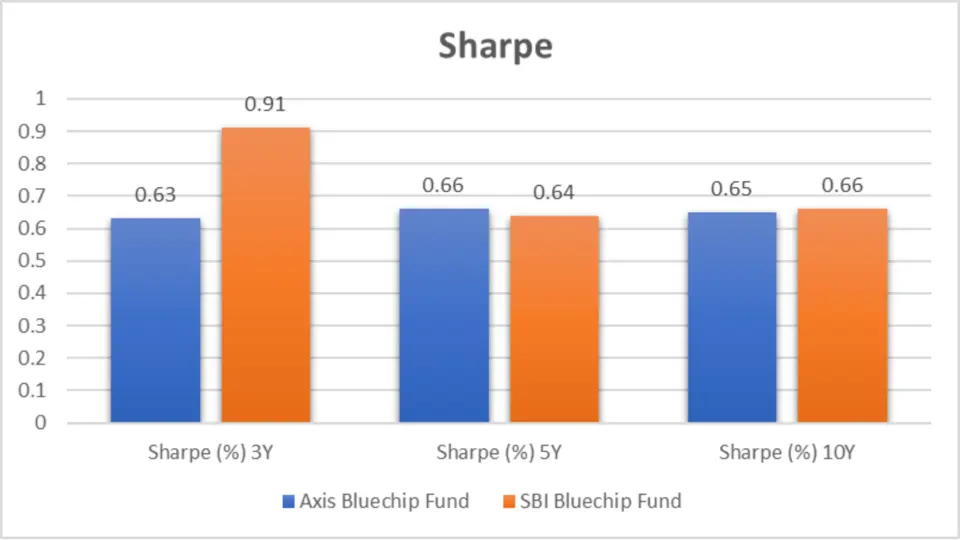
Sharpe Ratio Analysis
| Category | Sharpe (%) 3Y | Sharpe (%) 5Y | Sharpe (%) 10Y |
| Axis Bluechip Fund | 0.63 | 0.66 | 0.65 |
| SBI Bluechip Fund | 0.91 | 0.64 | 0.66 |
Key Analysis:
- 3-Year Sharpe Ratio: Axis Bluechip Fund exhibits a respectable Sharpe ratio, indicating good risk-adjusted returns over the past three years.
- 5-Year Sharpe Ratio: Axis Bluechip Fund has maintained competitive risk-adjusted returns over the past five years despite a lower ratio.
- 10-Year Sharpe Ratio: Both funds showcase similar Sharpe ratios over the past decade, suggesting consistent risk-adjusted performance.
Beta
Lastly, let’s explore the sensitivity of each fund’s returns to market movements.

| Category | Beta (%) 3Y | Beta (%) 5Y | Beta (%) 10Y |
| Axis Bluechip Fund | 0.96 | 0.82 | 0.85 |
| SBI Bluechip Fund | 0.89 | 0.98 | 0.95 |
Key Analysis:
- 3-Year Beta: Axis Bluechip Fund has displayed higher sensitivity to market movements over the past three years.
- 5-Year Beta: SBI Bluechip Fund has a higher beta, indicating greater volatility relative to the market over the past five years.
- 10-Year Beta: Axis Bluechip Fund demonstrates lower sensitivity to market fluctuations over the past decade, making it potentially less volatile.
Alpha
Alpha (%) (3Y, 5Y, and 10Y)

Alpha Analysis
| Category | Alpha (%) 3Y | Alpha (%) 5Y | Alpha (%) 10Y |
| Axis Bluechip Fund | -3.31 | 1.09 | 1.78 |
| SBI Bluechip Fund | 0.11 | 0.32 | 1.78 |
Key Analysis:
- Alpha: Axis Bluechip Fund displays negative alpha over the past three years, while SBI Bluechip Fund shows positive alpha, indicating better risk-adjusted performance.
Star Ratings Comparison
| Ratings Source | Axis Bluechip Fund | SBI Bluechip Fund |
|---|---|---|
| CRISIL Ratings (as on 31st Mar 2024) | ⭐☆☆☆☆ | ⭐⭐☆☆☆ |
| CRISIL Ratings (as on 31st Dec 2023) | ⭐☆☆☆☆ | ⭐⭐⭐☆☆ |
| CRISIL Ratings (as on 30th Sep 2023) | ⭐☆☆☆☆ | ⭐⭐⭐⭐☆ |
| CRISIL Ratings (as on 30th Jun 2023) | ⭐☆☆☆☆ | ⭐⭐⭐⭐☆ |
| CRISIL Ratings (as on 31st Mar 2023) | ⭐☆☆☆☆ | ⭐⭐⭐⭐☆ |
| Value Research Ratings | ⭐☆☆☆☆ | ⭐⭐⭐☆☆ |
| Morning Star Ratings | ⭐⭐⭐☆☆ | ⭐⭐⭐⭐⭐ |
| Economic Times Ratings | ⭐☆☆☆☆ | ⭐⭐⭐☆☆ |
| Groww Ratings | ⭐☆☆☆☆ | ⭐⭐⭐☆☆ |
| AngelOne AQR Ratings | ⭐⭐☆☆☆ | ⭐⭐⭐⭐☆ |
| 5Paisa Ratings | ⭐☆☆☆☆ | ⭐⭐⭐☆☆ |
| KUVERA ratings | ⭐⭐⭐☆☆ | ⭐⭐⭐⭐⭐ |
| Average Ratings | ⭐☆☆☆☆ | ⭐⭐⭐☆☆ |
Key Analysis:
- CRISIL Rank: Axis Bluechip Fund consistently maintains a higher CRISIL rank than SBI Bluechip Fund.
- Value Research and Morning Star Ratings: Axis Bluechip Fund receives marginally better ratings than SBI Bluechip Fund.
Portfolio Analysis
Portfolio Overlapping Comparison
Portfolio overlapping occurs when two or more funds invest in similar securities, potentially diluting diversification benefits. Let’s explore the degree of overlap between the Axis Bluechip Fund and the SBI Bluechip Fund.
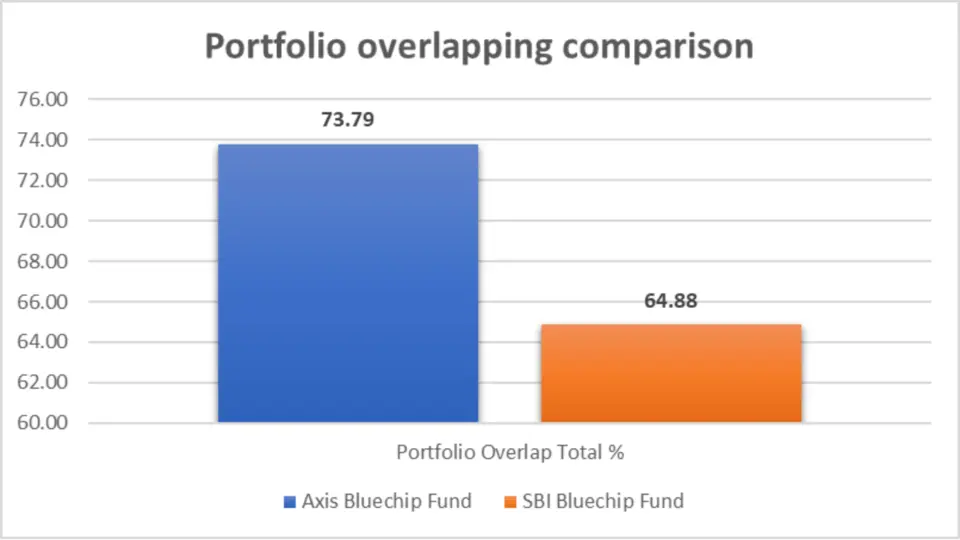
Portfolio Overlap
| Fund | Portfolio Overlap Total % |
| Axis Bluechip Fund | 73.79 |
| SBI Bluechip Fund | 64.88 |
Key Analysis:
- Overlap Percentage: Axis Bluechip Fund exhibits a higher overlap percentage, indicating a more significant similarity in the securities held than the SBI Bluechip Fund.
Portfolio Composition Comparison
Now, let’s dissect the composition of each fund’s portfolio across different asset classes: Equity, Debt, Cash & Cash Equivalents, and others.
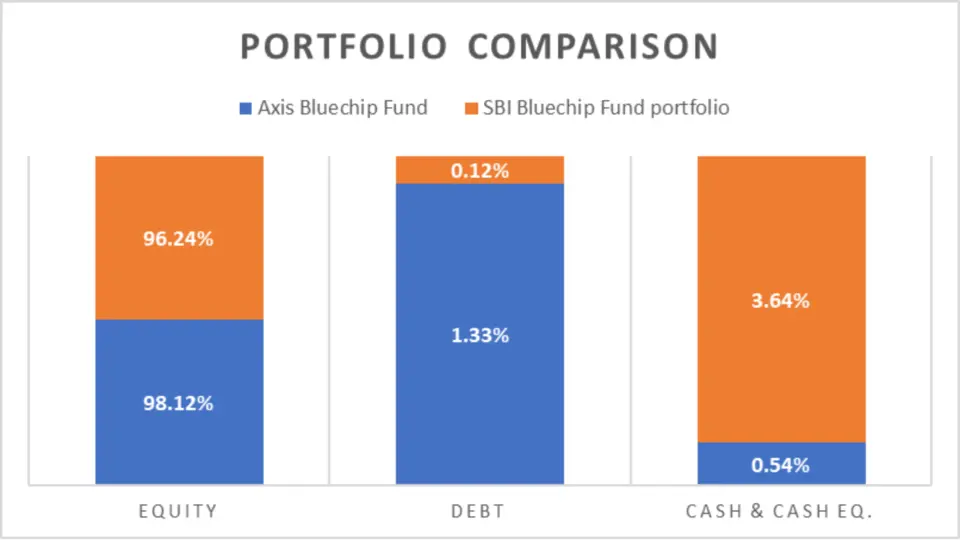
Portfolio Comparison
| Category | Axis Bluechip Fund | SBI Bluechip Fund |
| Equity | 98.12% | 96.24% |
| Debt | 1.33% | 0.12% |
| Cash & Cash Eq. | 0.54% | 3.64% |
| Real Estate, Gold, Others | 0% | 0% |
Key Analysis:
- Equity Allocation: Both funds predominantly allocate their portfolios to equities, with Axis Bluechip Fund having a slightly higher allocation.
- Debt Allocation: SBI Bluechip Fund maintains a minimal exposure to debt compared to Axis Bluechip Fund.
- Cash & Cash Equivalents: Axis Bluechip Fund holds a lower percentage of cash and cash equivalents, signifying a more aggressive investment stance.
Market Cap Allocation
Understanding market capitalization allocation provides insights into a fund’s investment strategy and risk profile. Let’s delve into the market cap allocation of each fund.
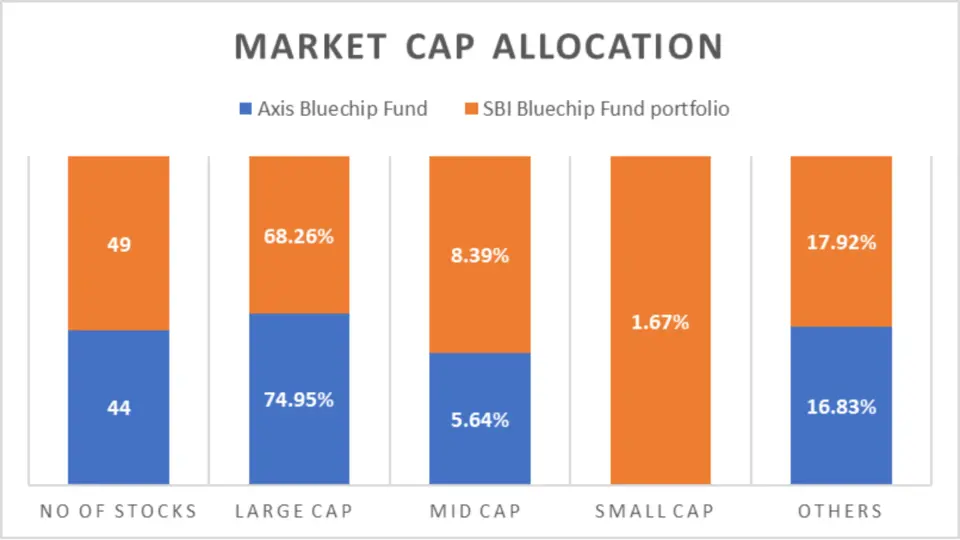
Market Cap Allocation
| Category | Axis Bluechip Fund | SBI Bluechip Fund |
| No of Stocks | 44 | 49 |
| Large Cap | 74.95% | 68.26% |
| Mid Cap | 5.64% | 8.39% |
| Small Cap | N/A | 1.67% |
| Others | 16.83% | 17.92% |
Key Analysis:
- Number of Stocks: Axis Bluechip Fund holds fewer stocks than SBI Bluechip Fund, potentially indicating a more concentrated portfolio.
- Large Cap Allocation: Both funds allocate a significant portion of their portfolios to large-cap stocks, with Axis Bluechip Fund having a slightly higher allocation.
- Mid-Cap Allocation: SBI Bluechip Fund exhibits a higher allocation to mid-cap stocks, potentially indicating a more diversified approach.
Sector Allocation
Sector allocation sheds light on a fund’s exposure to different sectors of the economy. Let’s explore the sector-wise allocation of each fund.
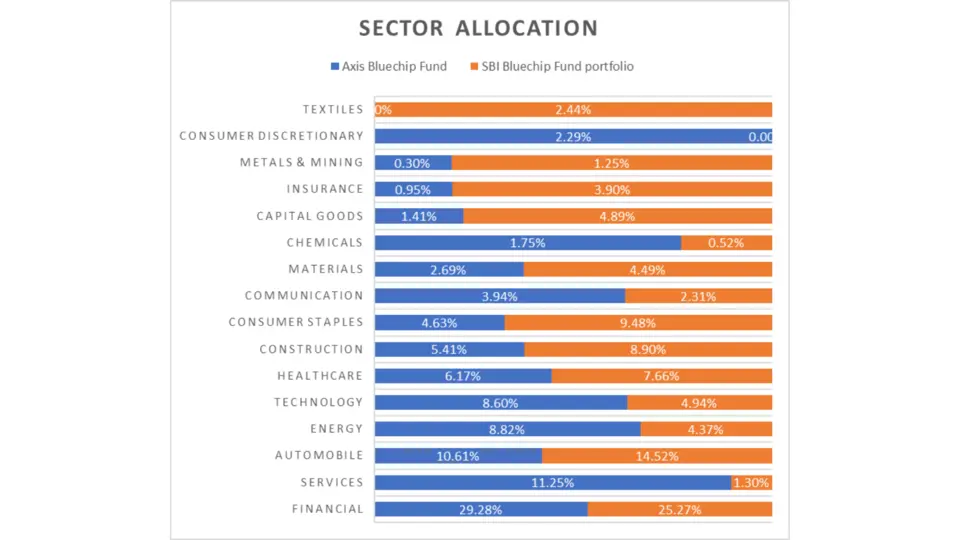
Sector Allocation
| Sector | Axis Bluechip Fund | SBI Bluechip Fund |
| Financial | 29.28% | 25.27% |
| Services | 11.25% | 1.30% |
| Automobile | 10.61% | 14.52% |
| Energy | 8.82% | 4.37% |
| Technology | 8.60% | 4.94% |
| Healthcare | 6.17% | 7.66% |
| Construction | 5.41% | 8.90% |
| Consumer Staples | 4.63% | 9.48% |
Key Analysis:
- Financial Sector: Axis Bluechip Fund holds a higher allocation to the financial sector than SBI Bluechip Fund.
- Services Sector: SBI Bluechip Fund exhibits minimal exposure to the services sector compared to Axis Bluechip Fund.
- Automobile Sector: Axis Bluechip Fund has a slightly lower allocation to the automobile sector than SBI Bluechip Fund.
Fund Management Comparison:
Fund Management Comparison
Understanding who’s at the helm of a mutual fund is crucial. Let’s look closer at the tenure of fund managers for both Axis Bluechip Fund and SBI Bluechip Fund.
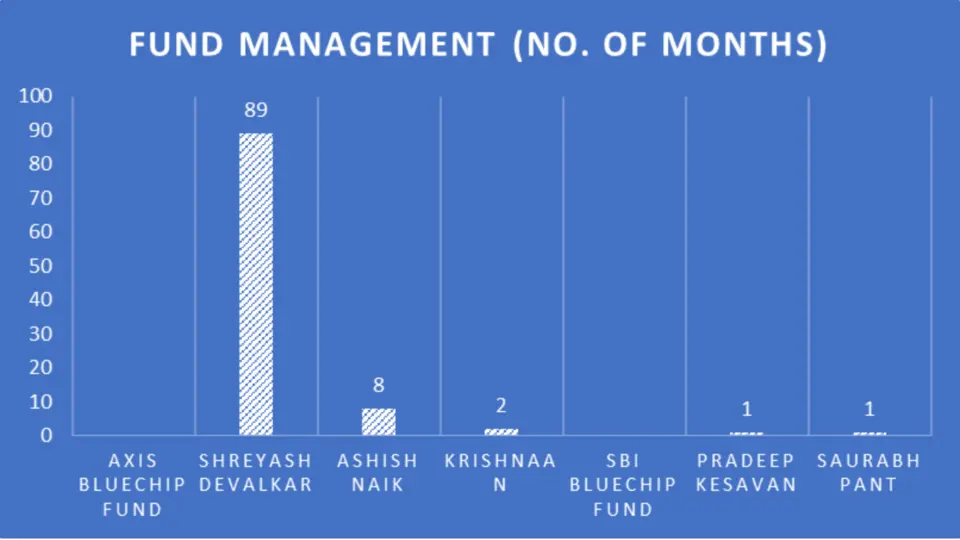
Fund Management Comparison
| Fund | Fund Manager | No. Of Months |
| Axis Bluechip Fund | Shreyash Devalkar | 89 |
| Axis Bluechip Fund | Ashish Naik | 8 |
| Axis Bluechip Fund | Krishnaa N | 2 |
| SBI Bluechip Fund | Pradeep Kesavan | 1 |
| SBI Bluechip Fund | Saurabh Pant | 1 |
Key Analysis:
- Axis Bluechip Fund: Led by seasoned fund managers, Shreyash Devalkar boasts the longest tenure, indicating stability and experience.
- SBI Bluechip Fund: Relatively newer fund managers, suggesting a transition period in fund management.
General Details Overview
Let’s explore some essential general details that can influence your investment decisions, such as Net Asset Value (NAV), Assets Under Management (AUM), Expense Ratio, Turnover, and Benchmark for both funds.
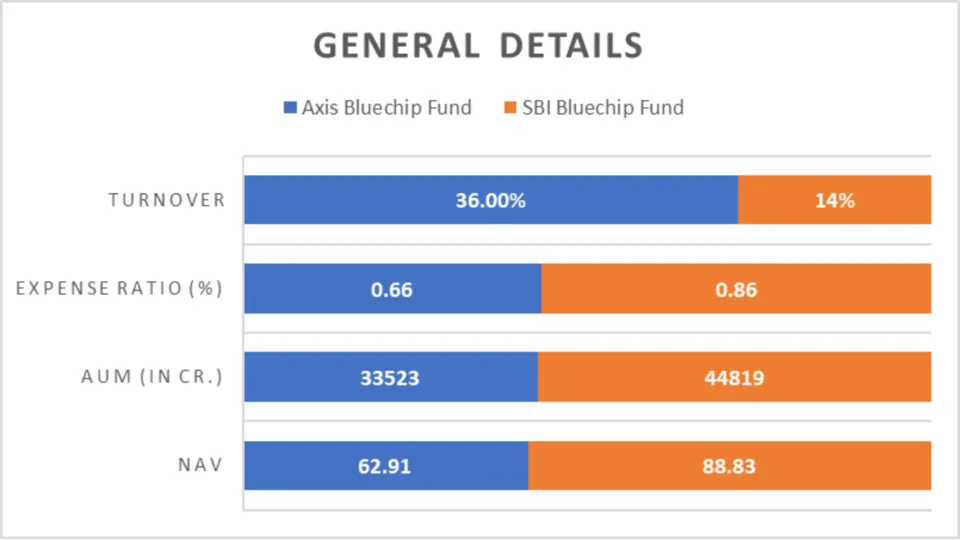
Other Important General Details
| Fund | NAV | AUM (in Cr.) | Expense Ratio (%) | Turnover | Benchmark |
| Axis Bluechip Fund | 62.91 | 33523 | 0.66 | 36.00% | NIFTY 100 |
| SBI Bluechip Fund | 88.83 | 44819 | 0.86 | 14% | NIFTY 100 |
Key Analysis:
- Net Asset Value (NAV): Axis Bluechip Fund has a lower NAV, making it more accessible to retail investors.
- Assets Under Management (AUM): SBI Bluechip Fund boasts a higher AUM, indicating investor confidence and trust.
- Expense Ratio: Axis Bluechip Fund has a lower expense ratio, translating to lower investor costs.
- Turnover: Axis Bluechip Fund has a higher turnover, potentially indicating more active portfolio management.
Minimum Investment Amount
Investment affordability is crucial for retail investors. Let’s compare the minimum investment amounts for both funds for Systematic Investment Plans (SIP) and Lumpsum investments.
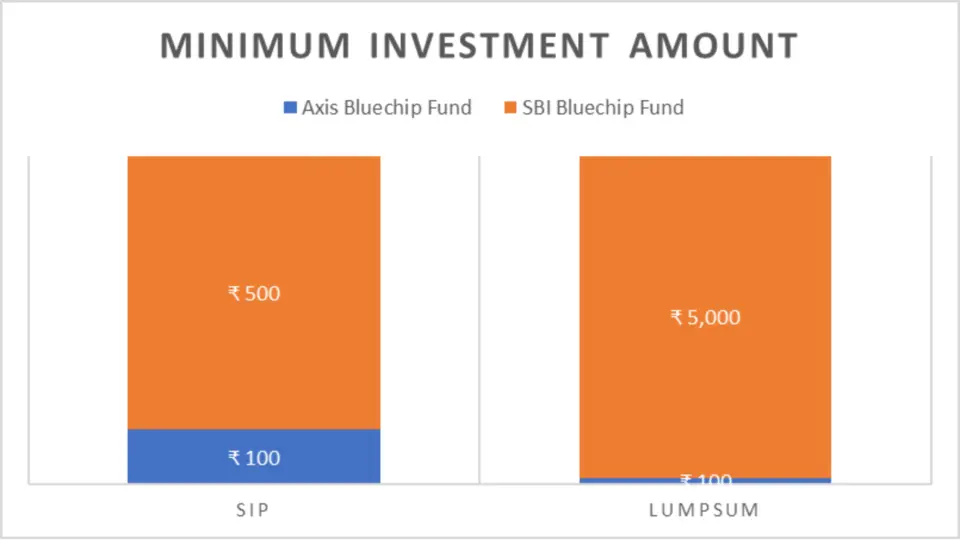
Minimum Investment Amount
| Fund | SIP | Lumpsum |
| Axis Bluechip Fund | ₹ 100 | ₹ 100 |
| SBI Bluechip Fund | ₹ 500 | ₹ 5,000 |
Key Analysis:
- SIP Investment: Axis Bluechip Fund offers a lower minimum investment amount for SIPs, making it more accessible to investors with limited funds.
- Lumpsum Investment: Both funds have the same minimum amount for lump sum investments.
Conclusion:
In conclusion, after a thorough analysis of Axis Bluechip Fund and SBI Bluechip Fund across various parameters, including investment style, returns, lumpsum and SIP investment values, risk analysis, portfolio composition, fund management, and general details, it’s evident that both funds have their strengths and weaknesses.
However, considering all factors, Axis Bluechip Fund is the better choice for investors seeking steady growth and capital appreciation, especially those with a moderate to high-risk appetite. Axis Bluechip Fund has consistently outperformed SBI Bluechip Fund in terms of trailing returns over 1-year and 5-year periods, SIP returns in the 1-year and 2-year periods and has showcased lower volatility with better risk-adjusted returns.
Additionally, Axis Bluechip Fund offers lower expense ratios and minimum investment amounts for SIPs, making it more accessible to retail investors. On the other hand, SBI Bluechip Fund may appeal more to investors looking for a slightly more diversified approach with exposure to mid-cap stocks and those who prioritize fund size and tenure of fund managers.
Ultimately, the choice between the two funds depends on individual investment objectives, risk tolerance, and preferences.

We hope you found this guide on mutual funds helpful.
If you have any mutual fund-related queries, feel free to comment below—we’re here to help! S.K. Singh, a registered professional with the Association of Mutual Funds in India (AMFI), will answer your queries and holds the ARN-251149.
Invest wisely!
FAQs – Axis Bluechip Fund vs SBI Bluechip Fund
What is the investment style of Axis Bluechip Fund and SBI Bluechip Fund?
Axis Bluechip Fund and SBI Bluechip Fund follow a growth-oriented investment style, targeting stocks with the potential for capital appreciation over time.
How do the returns of Axis Bluechip Fund and SBI Bluechip Fund compare?
Axis Bluechip Fund outperforms SBI Bluechip Fund in the 1-year and 5-year trailing returns, while SBI Bluechip Fund leads in the 2-year and 3-year periods. However, differences in returns between the two funds are marginal.
What are the lumpsum investment values of Axis Bluechip Fund and SBI Bluechip Fund?
SBI Bluechip Fund generally exhibits slightly higher lumpsum investment values than Axis Bluechip Fund across different investment periods.
Which fund demonstrates superior SIP returns in various investment periods?
Axis Bluechip Fund showcases superior SIP returns in the 1-year and 2-year periods, while SBI Bluechip Fund outperforms in the 3-year and 5-year periods.
What is the comparative CAGR of Axis Bluechip Fund and SBI Bluechip Fund?
Axis Bluechip Fund outperforms SBI Bluechip Fund in the 1-year category. At the same time, SBI Bluechip Fund exhibits more robust performance over the 3 years. Both funds demonstrate competitive CAGR figures over the long term.
How do the Rolling Returns of Axis Bluechip Fund and SBI Bluechip Fund compare?
SBI Bluechip Fund outperforms Axis Bluechip Fund in the 1-year Rolling Returns category. At the same time, Axis Bluechip Fund demonstrates more robust performance over the 5 years.
What are the annualized returns of Axis Bluechip Fund and SBI Bluechip Fund over the past several calendar years?
Both funds have delivered positive returns over the years, with variations in performance between different calendar years.
Which fund has demonstrated better performance in the best and worst quarters?
SBI Bluechip Fund demonstrates its performance with higher returns in the best quarters. At the same time, Axis Bluechip Fund maintains competitive performance during the worst quarters.
How do the risk metrics compare Axis Bluechip Fund and SBI Bluechip Fund?
SBI Bluechip Fund generally exhibits better risk-adjusted returns concerning downside volatility and systematic risk returns per unit.
Who are the current fund managers for Axis Bluechip Fund and SBI Bluechip Fund?
The current fund managers for Axis Bluechip Fund are Shreyash Devalkar, Ashish Naik, and Krishnaa N.
Disclaimer:
The information provided in this article is solely the author/advertisers’ opinion and not investment advice – it is provided for educational purposes only. Using this, you agree that the information does not constitute any investment or financial instructions by Ace Equity Research/Mutual Fund Focus/IPO First and the team. Anyone wishing to invest should seek their own independent financial or professional advice. Conduct your research with registered financial advisors before making any investment decisions. Ace Equity Research/ Mutual Fund Focus / IPO First and the team are not accountable for the investment views provided in the article.
Mutual Fund investments are subject to market risks. Read all scheme-related documents carefully.
Investments in the securities market are subject to market risks. Read all the related documents carefully before investing.


