Investing in large and mid-cap funds can be a game changer for your portfolio, especially when you choose the right one. If you’re finding yourself torn between the Bandhan Core Equity Fund and the Quant Large and Mid Cap Fund, you’ve landed in the right place. This blog will unravel the complexities and make it easier to decide which fund could serve you better in the long run.
Investment Style
Before diving into the nitty-gritty, let’s start by understanding the investment style of these two funds.
- Quant Large and Mid Cap Fund: Blend
- Bandhan Core Equity Fund: Blend
Both funds employ a blended investment style incorporating a mix of growth and value investing strategies. This approach aims to provide the best of both worlds—capital appreciation and stability—by balancing high-growth potential with less volatile value stocks.

Returns Analysis
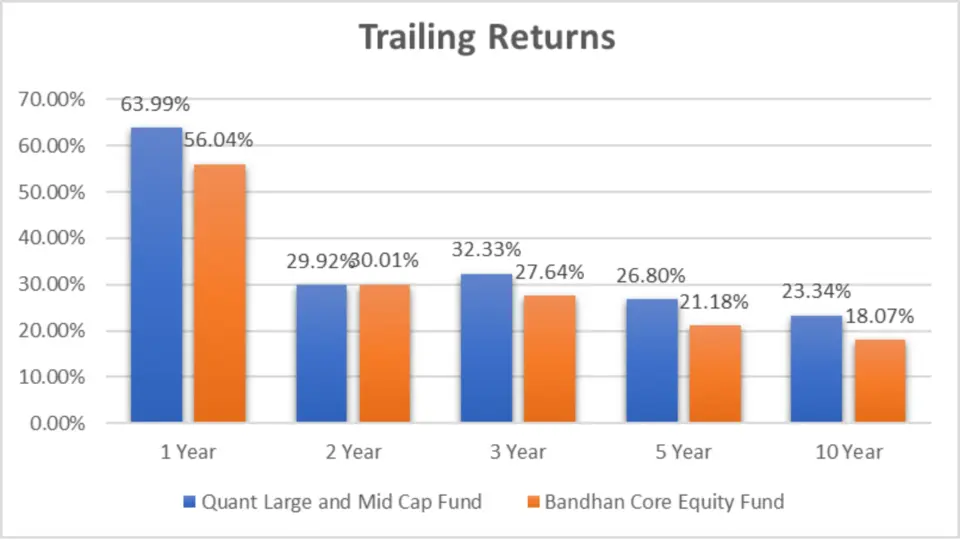
Let’s get to the heart of how these funds have performed over various periods. The table below shows the trailing returns as of 28th March 2024.
Trailing Returns
| Period Invested for | Quant Large and Mid Cap Fund | Bandhan Core Equity Fund |
| 1 Year | 63.99% | 56.04% |
| 2 Year | 29.92% | 30.01% |
| 3 Year | 32.33% | 27.64% |
| 5 Year | 26.80% | 21.18% |
| 10 Year | 23.34% | 18.07% |
Analysing
- 1 Year: The Quant Large and Mid Cap Fund outperforms with a return of 63.99%, which is a significant margin over the Bandhan Core Equity Fund’s 56.04%. This suggests that the Quant fund has had a better recent performance, potentially due to a more aggressive investment strategy or better stock selection.
- 2 Year: Here, the Bandhan Core Equity Fund slightly edges out the Quant fund with 30.01% compared to 29.92%. This close contest indicates that both funds have been navigating market conditions somewhat similarly over this period.
- 3 Year: The Quant fund again takes the lead with 32.33%, while Bandhan lags at 27.64%. This gap reflects the Quant fund’s more robust performance over the medium term.
- 5 Year: The difference becomes more pronounced over five years, with Quant returning 26.80% against Bandhan’s 21.18%. This suggests that Quant has had a more consistent track record over the longer term.
- 10 Year: Quant still maintains its edge with 23.34% for the long haul, while Bandhan stands at 18.07%. This is crucial for long-term investors who are looking for sustained growth.
Key Takeaways
- Short-Term Success: The Quant Large and Mid Cap Fund demonstrates more robust short-term performance, particularly in the 1 year, suggesting a more aggressive and potentially more rewarding strategy.
- Medium-Term Competitiveness: While both funds perform similarly over 2 years, Quant pulls ahead in the 3 years, indicating better medium-term returns.
- Long-Term Leadership: The Quant fund clearly outshines the Bandhan Core Equity Fund over 5 and 10 years, making it a more attractive option for long-term investors focused on sustained growth.
Lumpsum Investment Value

| Period Invested for | Quant Large and Mid Cap Fund | Bandhan Core Equity Fund |
| 1 Year | ₹16,421.2 | ₹15,622.5 |
| 2 Year | ₹16,890.1 | ₹16,915.2 |
| 3 Year | ₹23,190.1 | ₹20,810.0 |
| 5 Year | ₹32,846.4 | ₹26,171.2 |
| 10 Year | ₹81,696.4 | ₹52,765.4 |
Analysing
- 1 Year: If you had invested ₹10,000 a year ago, your investment in the Quant fund would now be worth ₹16,421.2, compared to ₹15,622.5 in the Bandhan fund. That’s a difference of nearly ₹800, which might seem small now but can compound significantly over time.
- 2 Year: The Bandhan fund pulls ahead slightly here, with a value of ₹16,915.2 compared to Quant’s ₹16,890.1. While the difference is minimal, it shows that Bandhan might have performed better in certain market conditions.
- 3 Year: A ₹10,000 investment three years ago would now be worth ₹23,190.1 in the Quant fund, outpacing Bandhan’s ₹20,810.0. This is a notable difference of over ₹2,000, emphasizing Quant’s stronger performance over the medium term.
- 5 Year: Over five years, your investment in Quant would have grown to ₹32,846.4, compared to ₹26,171.2 with Bandhan. That’s a significant difference of over ₹6,600, which could be a decisive factor for long-term investors.
- 10 Year: The long-term comparison is the most striking. A ₹10,000 investment ten years ago would have grown to ₹81,696.4 with Quant, whereas Bandhan would have turned it into ₹52,765.4. That’s nearly ₹29,000 more in your pocket, showcasing the potential power of choosing the right fund for the long haul.
Key Takeaways
- Short-Term Returns: The Quant Large and Mid Cap Fund shows more substantial growth over one year, turning ₹10,000 into ₹16,421.2, a bit more than Bandhan’s ₹15,622.5.
- Medium-Term Resilience: Although the Bandhan fund briefly edges out Quant over two years, the Quant fund dominates over three and five years, growing your initial investment significantly more.
- Long-Term Wealth Generation: The most striking difference is seen in the 10-year period, where the Quant fund nearly doubles Bandhan’s returns, highlighting its potential as a more powerful vehicle for long-term wealth accumulation.
SIP Returns
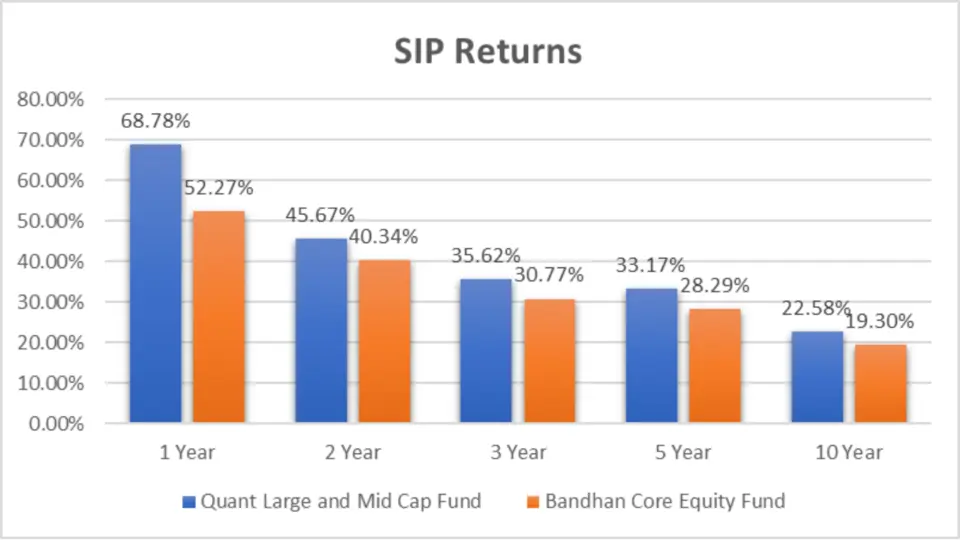
| Period Invested for | Quant Large and Mid Cap Fund | Bandhan Core Equity Fund |
| 1 Year | 68.78% | 52.27% |
| 2 Year | 45.67% | 40.34% |
| 3 Year | 35.62% | 30.77% |
| 5 Year | 33.17% | 28.29% |
| 10 Year | 22.58% | 19.30% |
Analysis
- 1 Year: The Quant Large and Mid Cap Fund delivered a robust 68.78% return, outpacing the Bandhan Core Equity Fund’s 52.27%. This difference highlights Quant’s short-term solid performance.
- 2 Year: Over two years, the returns from Quant stood at 45.67%, compared to 40.34% from Bandhan. Although both funds show impressive returns, Quant remains ahead, suggesting better management or asset selection.
- 3 Year: As we move to a three-year horizon, Quant continues to outperform with 35.62%, while Bandhan clocks in at 30.77%. This gap reinforces Quant’s consistent medium-term performance.
- 5 Year: The trend persists over five years, with Quant achieving 33.17% versus Bandhan’s 28.29%. This suggests that Quant may offer better returns for long-term SIP investors.
- 10 Year: Quant’s returns are 22.58% for the decade-long investment, slightly ahead of Bandhan’s 19.30%. This margin could be significant when considering compounding over a long period.
Key Takeaways
while both the Quant Large and Mid Cap Fund and the Bandhan Core Equity Fund have their merits, the Quant fund consistently offers higher returns, translating into significantly greater investment values over time. This makes it an attractive option for SIP investors looking to maximize their wealth over the long haul.H1: SIP Investment Value (NAV as of 28th March 2024)
SIP Investment
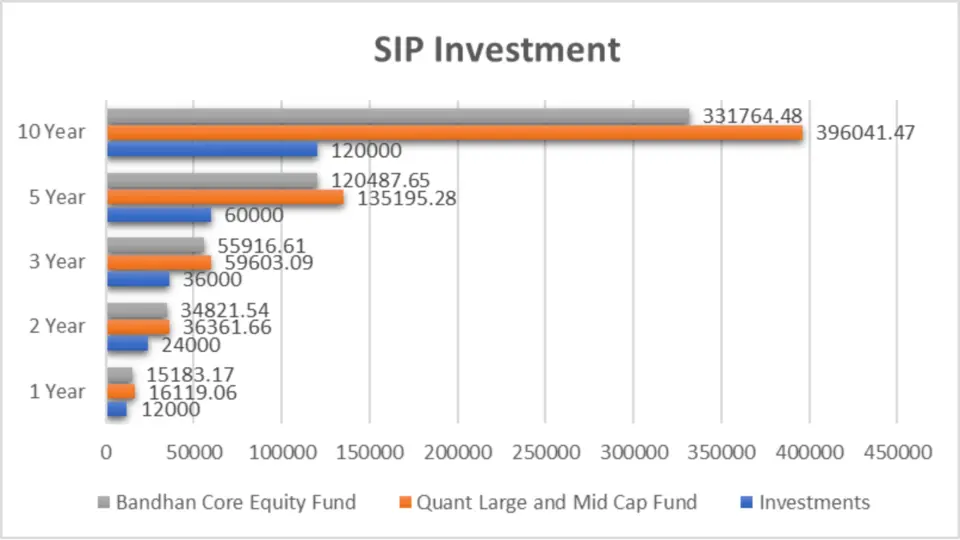
| Period Invested for | Investments | Quant Large and Mid Cap Fund | Bandhan Core Equity Fund |
| 1 Year | ₹12,000 | ₹16,119.06 | ₹15,183.17 |
| 2 Year | ₹24,000 | ₹36,361.66 | ₹34,821.54 |
| 3 Year | ₹36,000 | ₹59,603.09 | ₹55,916.61 |
| 5 Year | ₹60,000 | ₹1,35,195.28 | ₹1,20,487.65 |
| 10 Year | ₹1,20,000 | ₹3,96,041.47 | ₹3,31,764.48 |
Analysis
- 1 Year: A ₹12,000 investment in the Quant fund would have grown to ₹16,119.06, compared to ₹15,183.17 in the Bandhan fund. That’s a difference of around ₹936 in just one year.
- 2 Year: After two years, your ₹24,000 would be worth ₹36,361.66 in Quant versus ₹34,821.54 in Bandhan. The gap widens slightly to around ₹1,540, which could make a difference over time.
- 3 Year: In three years, Quant takes a more significant lead, with your ₹36,000 investment growing to ₹59,603.09, while Bandhan lags at ₹55,916.61.
- 5 Year: Over five years, Quant’s value jumps to ₹1,35,195.28, well above Bandhan’s ₹1,20,487.65. The difference of nearly ₹14,700 is substantial, showing the long-term benefits of choosing the correct fund.
- 10 Year: A decade-long SIP would see your ₹1,20,000 investment swell to ₹3,96,041.47 in the Quant fund, compared to ₹3,31,764.48 in the Bandhan fund. That’s a massive ₹64,276 difference, which can significantly impact your financial goals.
Key Takeaways
while both the Quant Large and Mid Cap Fund and the Bandhan Core Equity Fund have their merits, the Quant fund consistently offers higher returns, translating into significantly greater investment values over time. This makes it an attractive option for SIP investors looking to maximize their wealth over the long haul.
Compound Annual Growth Rate (CAGR)

CAGR is an essential metric that gives you a clear picture of how much your investments have grown annually, on average, over different time frames.
| Category | 1 Y | 3 Y | 5 Y |
| Quant Large and Mid Cap Fund | 63.54% | 31.39% | 26.00% |
| Bandhan Core Equity Fund | 54.69% | 25.76% | 20.52% |
Analysis
- 1 Year: The Quant fund’s CAGR is 63.54%, significantly higher than Bandhan’s 54.69%, reinforcing its superior short-term growth potential.
- 3 Year: Quant maintains a higher CAGR of 31.39% over three years, compared to Bandhan’s 25.76%. This indicates that Quant has been more effective in delivering consistent returns.
- 5 Year: Even over five years, Quant’s CAGR of 26.00% outshines Bandhan’s 20.52%, making it a more attractive option for long-term investors.
Key Takeaways
- The Quant Large and Mid Cap Fund consistently outperforms the Bandhan Core Equity Fund across all periods, offering better short- and long-term growth potential.
- This data suggests that Quant is a more substantial choice for investors looking to maximize returns over various investment horizons.
Rolling Returns
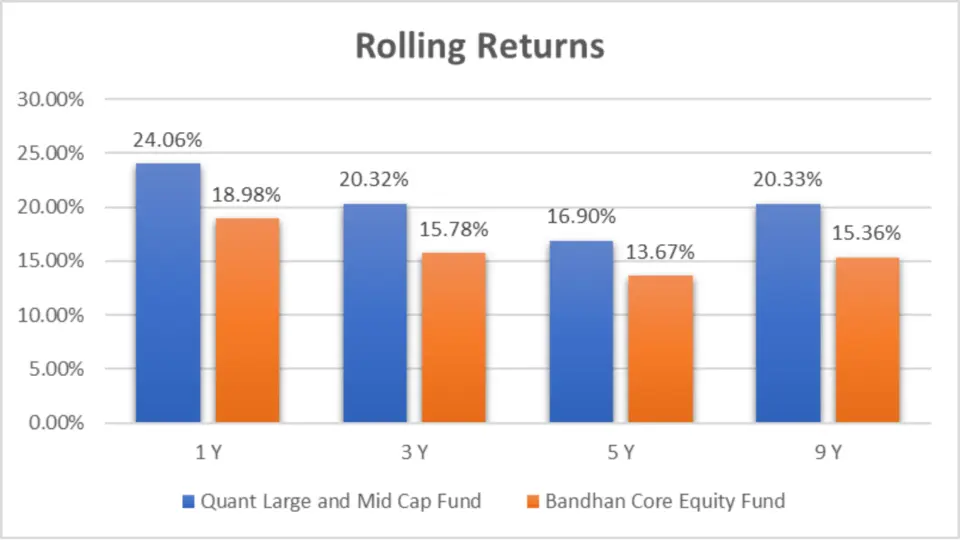
Rolling returns provide a more dynamic view of a fund’s performance, showing how returns fluctuate over time for different investment periods.
| Category | 1 Y | 3 Y | 5 Y |
| Quant Large and Mid Cap Fund | 24.06% | 20.32% | 16.90% |
| Bandhan Core Equity Fund | 18.98% | 15.78% | 13.67% |
Analysing
- 1 Year: The Quant fund shows a rolling return of 24.06% over a year, higher than Bandhan’s 18.98%. This suggests better performance consistency.
- 3 Year: Quant maintains a lead with 20.32% over three years compared to 15.78% from Bandhan.
- 5 Year: For five-year periods, Quant’s rolling Return of 16.90% again outpaces Bandhan’s 13.67%, showcasing its ability to deliver better returns over extended periods.
Key Takeaways
- The Quant Large and Mid Cap Fund consistently outperforms the Bandhan Core Equity Fund in rolling returns across 1, 3, and 5-year periods.
- Quant’s superior performance across these periods highlights its effectiveness in generating higher and more stable returns over time, making it a reliable choice for investors seeking consistent growth.
Annualized/Calendar Year Returns
Annualized returns offer a snapshot of each fund’s performance in individual calendar years, helping investors understand their year-on-year growth.
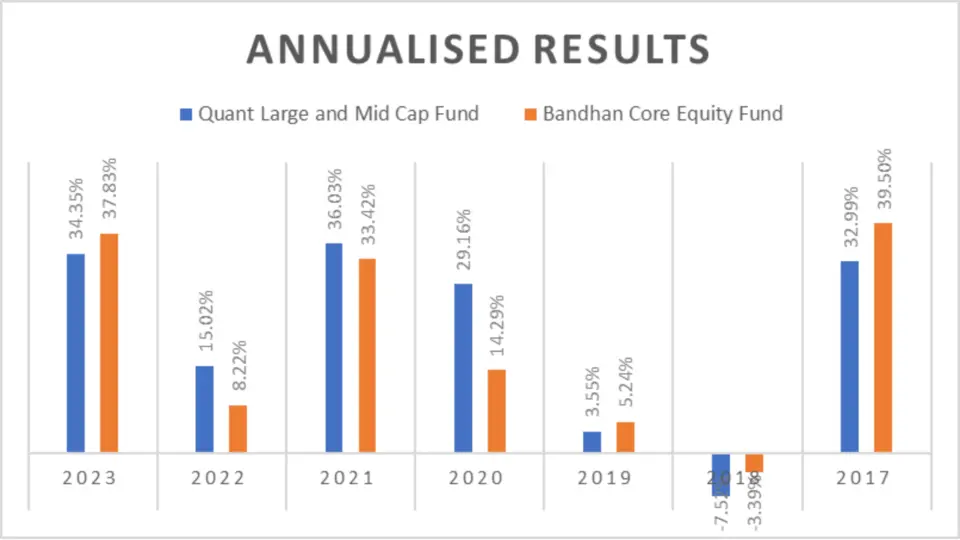
| Period | Quant Large and Mid Cap Fund | Bandhan Core Equity Fund |
| 2023 | 34.35% | 37.83% |
| 2022 | 15.02% | 8.22% |
| 2021 | 36.03% | 33.42% |
| 2020 | 29.16% | 14.29% |
| 2019 | 3.55% | 5.24% |
| 2018 | -7.52% | -3.39% |
| 2017 | 32.99% | 39.50% |
Analysis
- 2023: Bandhan outperformed Quant with 37.83% vs. 34.35%, indicating a better performance in recent volatile markets.
- 2022: Quant, however, significantly outshone Bandhan in 2022, returning 15.02% compared to Bandhan’s 8.22%.
- 2021: Quant continued its dominance in 2021 with 36.03%, marginally higher than Bandhan’s 33.42%.
- 2020: The Quant fund had a stellar 2020 with 29.16% returns, more than double Bandhan’s 14.29%.
- 2019: Bandhan took the lead in 2019 with 5.24%, outperforming Quant’s 3.55%.
- 2018: Both funds struggled in 2018, with Quant at -7.52% and Bandhan at -3.39%.
- 2017: Bandhan shone at 39.50%, surpassing Quant’s 32.99%.
Key Takeaways
- The Bandhan Core Equity Fund has shown strength in specific years, particularly in volatile markets like 2023 and during market upswings like 2017.
- The Quant Large and Mid Cap Fund demonstrated more robust overall performance in most recent years, particularly in 2020 and 2022, making it a solid choice for investors seeking robust annual returns across different market conditions.
Best Quarters
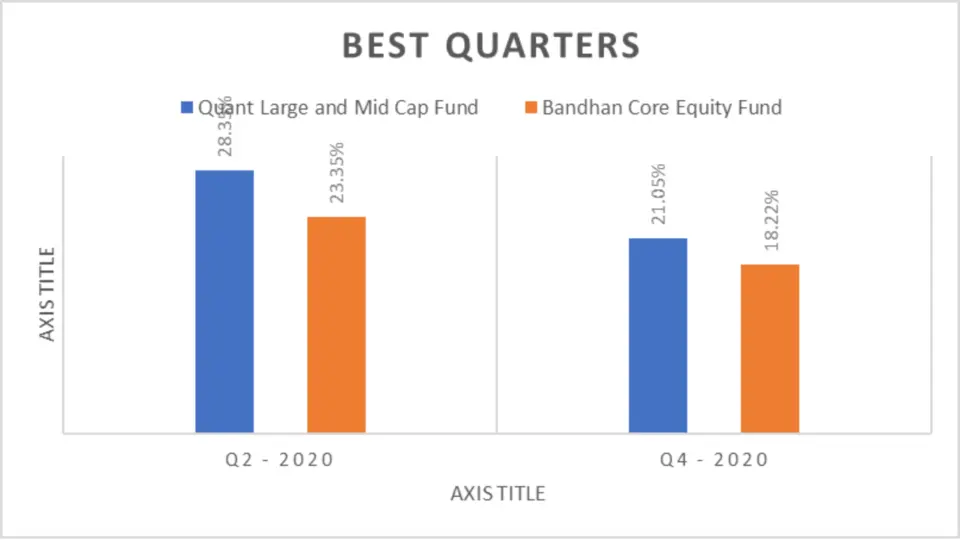
| Period | Quant Large and Mid Cap Fund | Bandhan Core Equity Fund |
| Q2 – 2020 | 28.35% | 23.35% |
| Q4 – 2020 | 21.05% | 18.22 |
• The Quant Large and Mid Cap Fund consistently outperformed the Bandhan Core Equity Fund during the best quarters of 2020, indicating its superior ability to capture gains during market upswings.
• These results highlight Quant’s potential as a stronger performer during periods of market recovery, making it a compelling option for investors looking to maximize returns in bullish conditions
Analysis
Best Quarters: During the best-performing quarters, the Quant fund led with 28.35% in Q2 2020 and 21.05% in Q4 2020, ahead of Bandhan’s returns
Worst Quarters
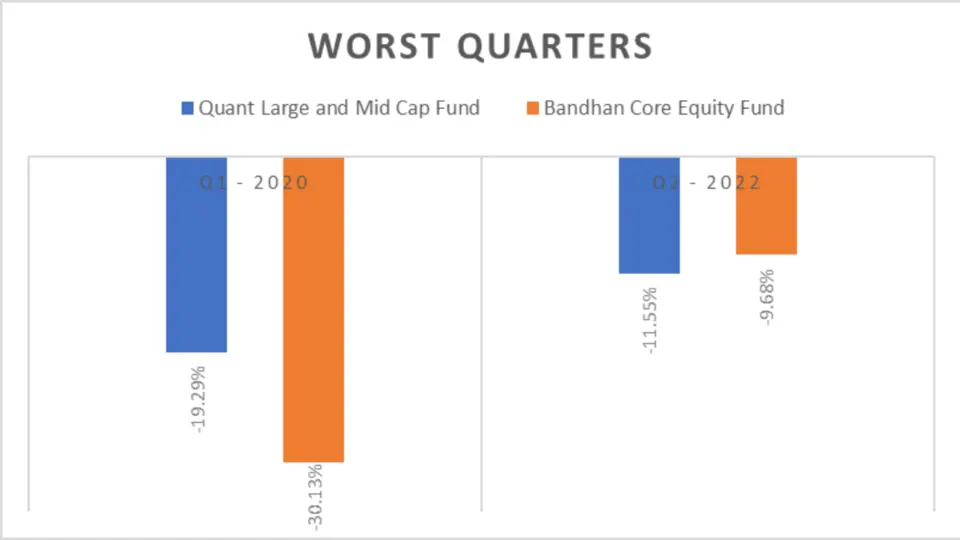
| Period | Quant Large and Mid Cap Fund | Bandhan Core Equity Fund |
| Q1 – 2020 | -19.29% | -30.13% |
| Q2 – 2022 | -11.55% | -9.68% |
Analysis
- Worst Quarters: Quant showed less volatility even in challenging times, with a -19.29% drop in Q1 2020, compared to Bandhan’s -30.13%. However, in Q2 2022, Bandhan fared slightly better.
Key Takeaways
• The Quant Large and Mid Cap Fund demonstrated better downside protection in Q1 2020, showing less vulnerability during a significant market downturn.
• In Q2 2022, Bandhan Core Equity Fund outperformed Quant by limiting losses more effectively, suggesting it might offer better risk management in certain adverse conditions.
• Overall, each fund has its strengths in navigating tough market environments, with Quant being more resilient during extreme market shocks and Bandhan performing better in less severe downturns.
Quarterly Results
Below is a table summarizing the quarterly returns of both funds over the past few years:
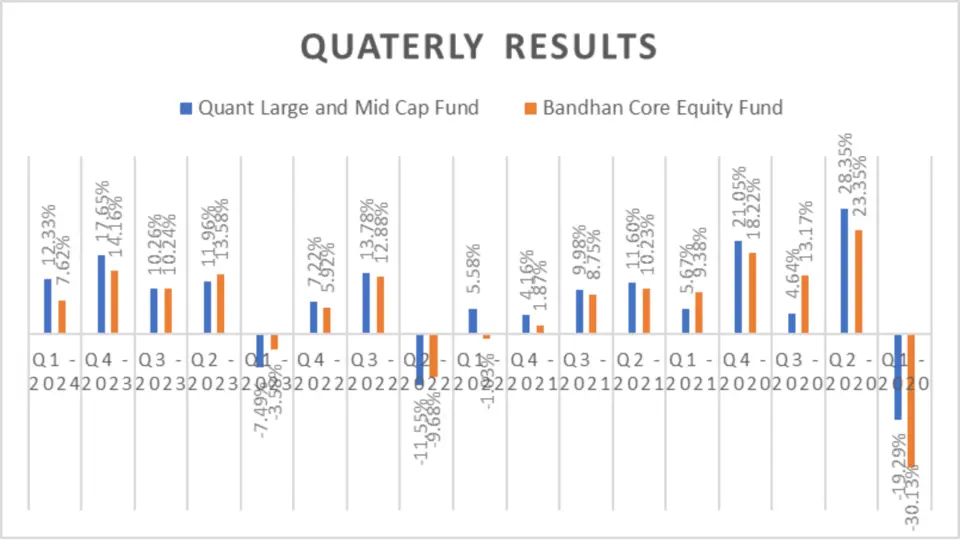
| Period | Quant Large and Mid Cap Fund | Bandhan Core Equity Fund |
| Q1 – 2024 | 12.33% | 7.62% |
| Q4 – 2023 | 17.65% | 14.16% |
| Q3 – 2023 | 10.26% | 10.24% |
| Q2 – 2023 | 11.96% | 13.58% |
| Q1 – 2023 | -7.49% | -3.58% |
| Q4 – 2022 | 7.22% | 5.92% |
| Q3 – 2022 | 13.78% | 12.88% |
| Q2 – 2022 | -11.55% | -9.68% |
| Q1 – 2022 | 5.58% | -1.03% |
| Q4 – 2021 | 4.16% | 1.87% |
| Q3 – 2021 | 9.98% | 8.75% |
| Q2 – 2021 | 11.60% | 10.23% |
| Q1 – 2021 | 5.67% | 9.38% |
| Q4 – 2020 | 21.05% | 18.22% |
| Q3 – 2020 | 4.64% | 13.17% |
| Q2 – 2020 | 28.35% | 23.35% |
| Q1 – 2020 | -19.29% | -30.13% |
Analysing
- Q1 – 2024: The Quant Large and Mid Cap Fund outperformed Bandhan with a return of 12.33% compared to 7.62% for Bandhan. This indicates a more robust performance at the start of the year.
- Q4 – 2023: Quant once again led with 17.65%, beating Bandhan’s 14.16%. Quant showed robust performance in the final quarter of 2023.
- Q3 – 2023: Both funds delivered almost identical returns, with Quant at 10.26% and Bandhan at 10.24%, showing similar performance during this quarter.
- Q2 – 2023: Bandhan slightly outperformed Quant with a return of 13.58% versus Quant’s 11.96%, highlighting Bandhan’s capability to capture gains during this quarter.
- Q1 – 2023: Both funds faced losses, but Quant’s decline of -7.49% was steeper than Bandhan’s -3.58%, indicating more volatility in Quant during this period.
- Overall: Across 17 quarters, Quant outperformed Bandhan 12 times, making it the more consistent performer. However, Bandhan showed strength in specific quarters, mainly when the market conditions favoured its strategy.
Key Takeaways
- Consistent Outperformance: The Quant Large and Mid Cap Fund consistently outperformed the Bandhan Core Equity Fund in most quarters, particularly during market recoveries.
- Volatility Management: Quant demonstrated a more robust overall performance. However, Bandhan showed resilience in certain quarters, especially when markets were more volatile.
- Better Downside Protection: Quant generally offers better downside protection during market downturns, which is crucial for risk-averse investors.


Risk Analysis
Understanding the risk linked with each fund is as important as knowing their returns. Let’s delve into the risk metrics, including Mean Return, Sortino Ratio, Treynor’s Ratio, Standard Deviation, Sharpe Ratio, Beta, and Alpha.
Maximum Drawdown
This measures the peak-to-trough decline during a specific period, helping to assess risk.
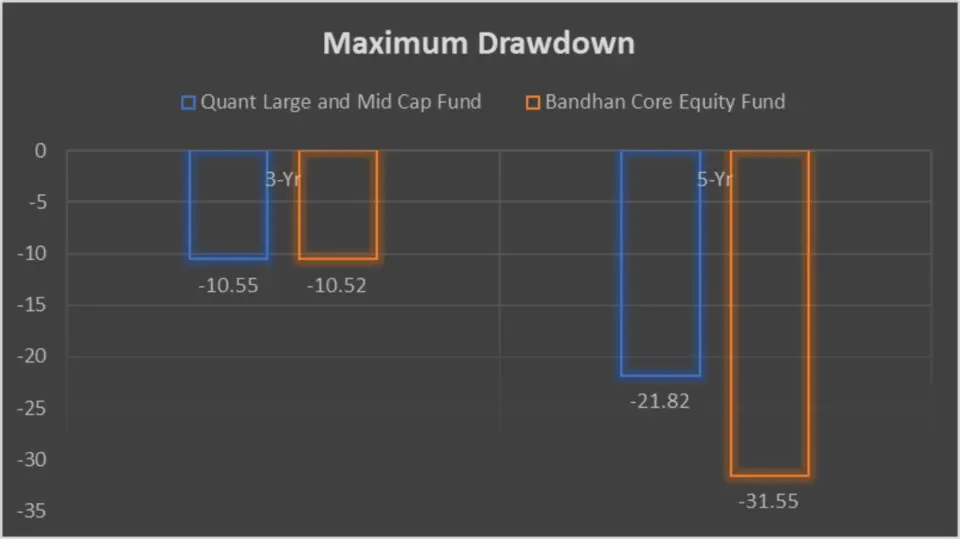
| Period | 3-Yr | 5-Yr |
| Quant Large and Mid Cap Fund | -10.55 | -21.82 |
| Bandhan Core Equity Fund | -10.52 | -31.55 |
Analysis
- 3-Year: Both funds had similar three-year drawdowns, with Quant at -10.55 and Bandhan at -10.52.
- 5-Year: Over five years, Quant’s drawdown was -21.82, less severe than Bandhan’s -31.55%, indicating that Quant may offer better downside protection.
Key Takeaways
- Short-Term Drawdown: Over the 3 years, both funds exhibited similar risk levels, with nearly identical maximum drawdowns.
- Long-Term Resilience: The Quant Large and Mid Cap Fund demonstrated significantly better resilience over the 5 years, with a much smaller maximum drawdown than the Bandhan Core Equity Fund. This makes Quant a potentially safer option for long-term investors concerned about significant losses during market downturns.
Mean Return, Sortino Ratio, and Treynor’s Ratio
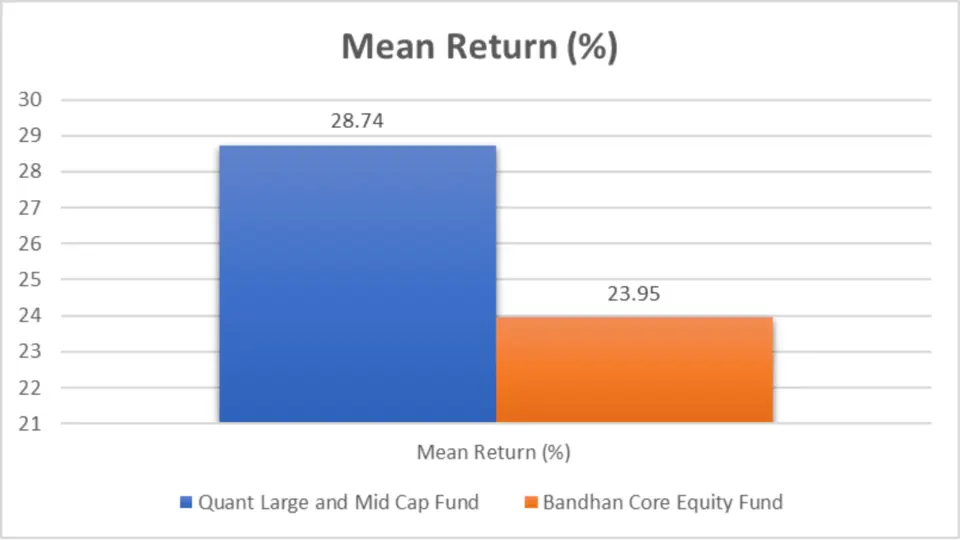
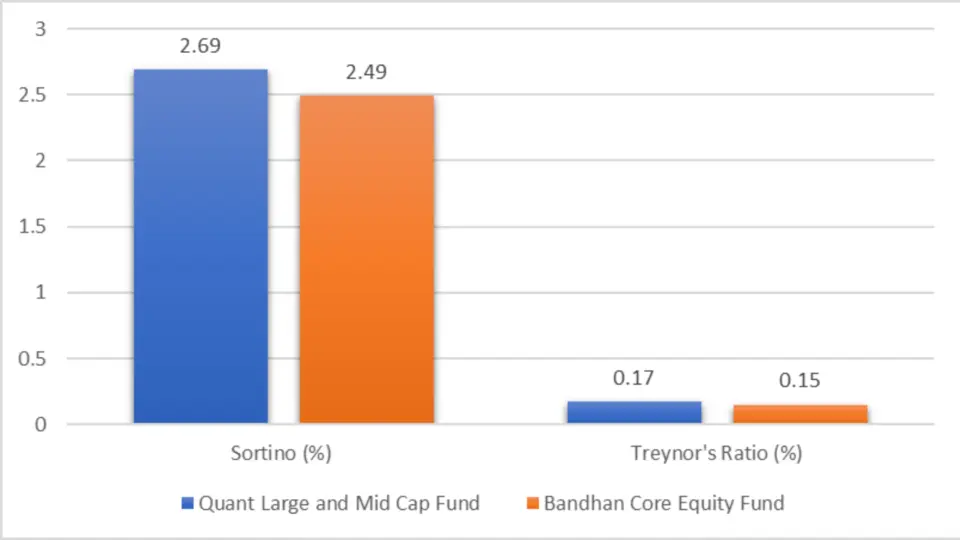
| Risk Metric | Quant Large and Mid Cap Fund | Bandhan Core Equity Fund |
| Mean Return (%) | 28.74 | 23.95 |
| Sortino Ratio (%) | 2.69 | 2.49 |
| Treynor’s Ratio (%) | 0.17 | 0.15 |
Analysis
- Mean Return: Quant offers a higher mean return of 28.74%, compared to Bandhan’s 23.95%, indicating that Quant delivers better average returns for the risk taken.
- Sortino Ratio: Quant also has a higher Sortino Ratio of 2.69, versus Bandhan’s 2.49%, meaning it provides better risk-adjusted returns when only downside risk is considered.
- Treynor’s Ratio: With a Treynor’s Ratio of 0.17 against Bandhan’s 0.15, Quant demonstrates better performance relative to the risk-free rate, adjusted for market risk.
Key Takeaways
- Higher Returns: The Quant Large and Mid Cap Fund consistently outperforms the Bandhan Core Equity Fund in terms of mean Return, making it a more lucrative option for growth-focused investors.
- Better Risk-Adjusted Performance: Quant also offers superior risk-adjusted returns with higher Sortino and Treynor Ratios, particularly when considering downside risk and market volatility.
- Overall Advantage: These metrics highlight Quant’s potential as a stronger performer in absolute and risk-adjusted returns, making it a compelling choice for many investors.
Standard Deviation
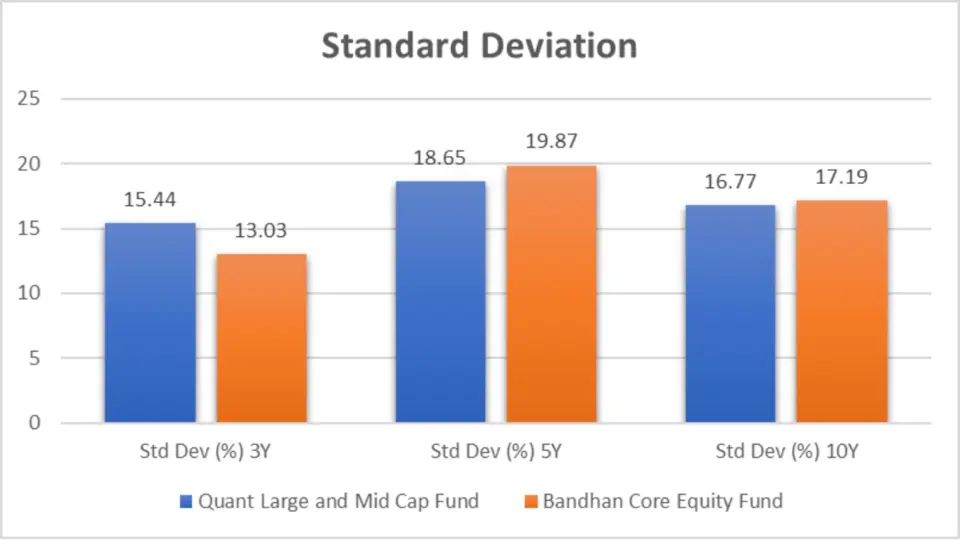
| Period | Quant Large and Mid Cap Fund | Bandhan Core Equity Fund |
| 3-Year Std Dev (%) | 15.44 | 13.03 |
| 5-Year Std Dev (%) | 18.65 | 19.87 |
| 10-Year Std Dev (%) | 16.77 | 17.19 |
Analysis
- 3-Year: Quant shows a higher standard deviation of 15.44% compared to Bandhan’s 13.03%, indicating slightly higher volatility in the short term.
- 5-Year: However, over five years, Bandhan exhibits higher volatility with a standard deviation of 19.87%, compared to Quant’s 18.65%, suggesting that Bandhan is more volatile in the medium term.
- 10-Year: Over the long term, both funds exhibit similar volatility, with Quant at 16.77% and Bandhan at 17.19%.
key Takeaways
- Short-Term Volatility: The Quant Large and Mid Cap Fund is more volatile in the short term, as reflected by its higher 3-year standard deviation.
- Medium-Term Volatility: Over five years, the Bandhan Core Equity Fund has become more volatile, indicating that it experiences more significant fluctuations in returns compared to Quant.
- Long-Term Stability: Over 10 years, both funds show similar levels of volatility, with Bandhan being slightly more volatile. This suggests that, in the long run, both funds carry comparable risk levels. However, Bandhan may expose investors to marginally higher fluctuations.
Sharpe Ratio
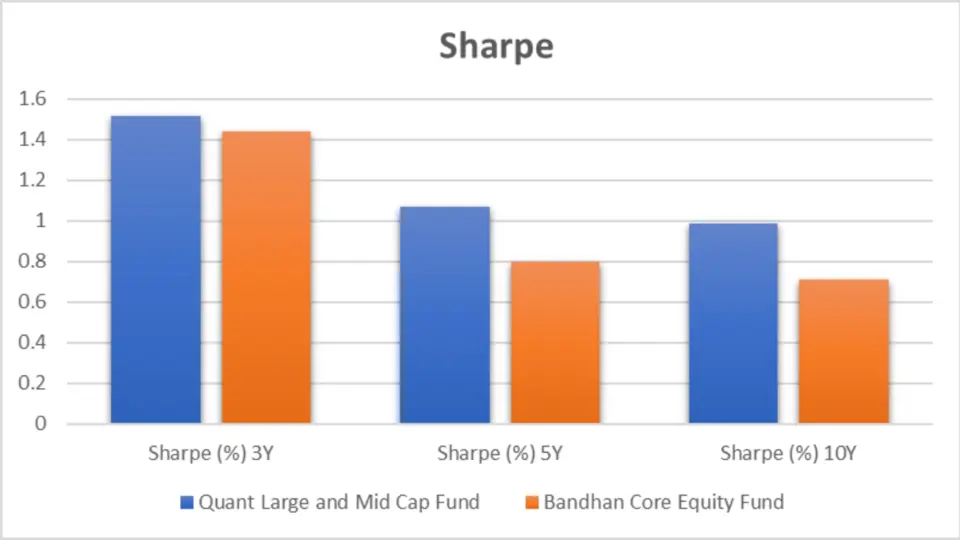
| Period | Quant Large and Mid Cap Fund | Bandhan Core Equity Fund |
| 3-Year Sharpe Ratio (%) | 1.52 | 1.44 |
| 5-Year Sharpe Ratio (%) | 1.07 | 0.80 |
| 10-Year Sharpe Ratio (%) | 0.99 | 0.71 |
Analysis
- 3-Year: Quant has a higher Sharpe Ratio of 1.52, indicating better risk-adjusted returns than Bandhan’s 1.44% in the short term.
- 5-Year and 10-Year: Over more extended periods, Quant continues to outperform with Sharpe Ratios of 1.07% and 0.99% for 5 and 10 years, respectively, compared to Bandhan’s 0.80% and 0.71%.
Key Takeaways
- Superior Short-Term Risk-Adjusted Returns: The Quant Large and Mid Cap Fund outperforms the Bandhan Core Equity Fund in the short term, offering better risk-adjusted returns as reflected in its higher 3-year Sharpe Ratio.
- Better Medium-Term Performance: Quant’s higher Sharpe Ratio over five years highlights its ability to deliver better returns for the level of risk taken, making it a more favourable choice for investors with a medium-term outlook.
- Long-Term Advantage: Quant’s consistent outperformance in the 10-year Sharpe Ratio suggests that it is a more reliable fund for long-term investors seeking better risk-adjusted returns.
Beta Analysis
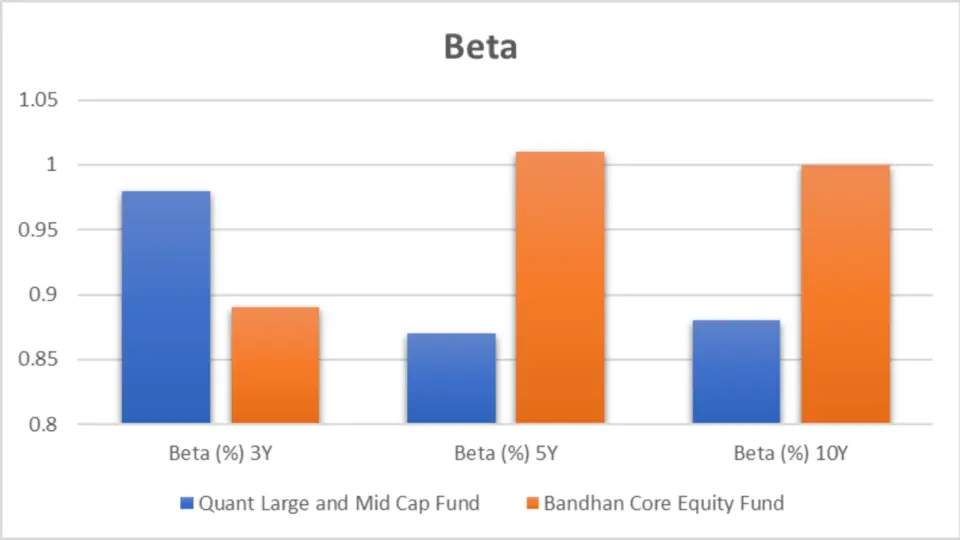
| Period | Quant Large and Mid Cap Fund | Bandhan Core Equity Fund |
| 3-Year Beta (%) | 0.98 | 0.89 |
| 5-Year Beta (%) | 0.87 | 1.01 |
| 10-Year Beta (%) | 0.88 | 1.00 |
Analysis
- 3-Year: Both funds have betas close to 1, but Quant’s 0.98 indicates it moves almost in tandem with the market. At the same time, Bandhan’s 0.89 suggests slightly lower market sensitivity.
- 5-Year: Quant’s 0.87 beta shows lower market sensitivity than Bandhan’s 1.01, indicating that Quant may offer more stability in volatile markets.
- 10-Year: Over the long term, Quant’s 0.88 beta remains lower than Bandhan’s 1.00, further emphasizing Quant’s relatively lower market risk.
Key Takeaways
- Short-Term Market Sensitivity: The Quant Large and Mid Cap Fund has a beta close to 1 in the short term, indicating it moves almost in sync with the market. At the same time, Bandhan is less sensitive to market movements with a lower beta.
- Medium-Term Stability: Over five years, Quant becomes less sensitive to market fluctuations, making it a potentially safer bet compared to Bandhan, which shows increased market sensitivity.
- Long-Term Consistency: Quant continues to demonstrate lower volatility relative to the market, with a beta consistently below 1 in the long run. With a beta of 1, Bandhan matches market movements, indicating it carries a similar risk to the market itself.
Alpha

| Benchmark | Alpha (%) 3Y | Alpha (%) 5Y | Alpha (%) 10Y |
| Quant Large and Mid Cap Fund | 10.98 | 9.05 | 7.75 |
| Bandhan Core Equity Fund | 7.27 | 3.13 | 2.17 |
Analysis
- 3-Year: Quant has a significantly higher 3-year alpha of 10.98%, indicating that it outperforms its benchmark by a wide margin compared to Bandhan’s 7.27%.
- 5-Year and 10-Year: Over the more extended periods, Quant continues to show strong outperformance with alphas of 9.05% and 7.75% for 5 and 10 years, respectively, compared to Bandhan’s 3.13% and 2.17%.
Key Takeaways
Short-Term Outperformance: The Quant Large and Mid Cap Fund demonstrates superior short-term outperformance with a much higher 3-year alpha than the Bandhan Core Equity Fund.
Consistent Value Addition: Over five and ten years, Quant consistently outperforms its benchmark by a wide margin, as indicated by its strong alpha values, making it an attractive choice for investors seeking funds that add significant value over time.
Ratings
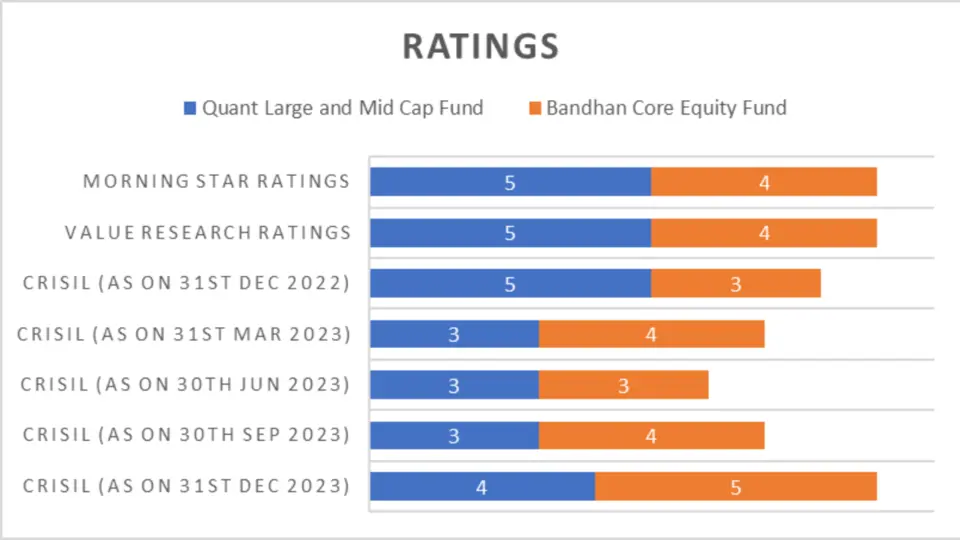
CRISIL ratings are a reliable benchmark for assessing mutual fund performance. Here’s how these two funds stack up:
| Period | Quant Large and Mid Cap Fund | Bandhan Core Equity Fund |
| CRISIL (as on 31st Dec 2023) | 4 | 5 |
| CRISIL (as on 30th Sep 2023) | 3 | 4 |
| CRISIL (as on 30th Jun 2023) | 3 | 3 |
| CRISIL (as on 31st Mar 2023) | 3 | 4 |
| CRISIL (as on 31st Dec 2022) | 5 | 3 |
| Value Research Ratings | 5 | 4 |
| Morning Star Ratings | 5 | 4 |
Analysis
- CRISIL Ratings: The Bandhan Core Equity Fund has generally received higher CRISIL ratings, particularly in the last quarter of 2023, with a rating of 5 compared to Quant’s 4. This suggests that Bandhan may be seen as slightly more reliable in recent times according to CRISIL standards.
- Value Research and Morning Star Ratings: Both Value Research and Morning Star have given higher ratings to the Quant Large and Mid Cap Fund (5 stars), indicating strong performance and management, whereas Bandhan trails slightly with 4 stars from both rating agencies.
Key Takeaways:
- Bandhan’s Strong CRISIL Performance: Bandhan’s higher CRISIL ratings indicate consistent recognition of its performance.
- Quant’s Consistent High Ratings: Despite Bandhan’s edge in CRISIL ratings, Quant’s consistently higher ratings from Value Research and Morning Star highlight its overall solid performance and management quality.
Portfolio Analysis
Portfolio Overlapping Comparison
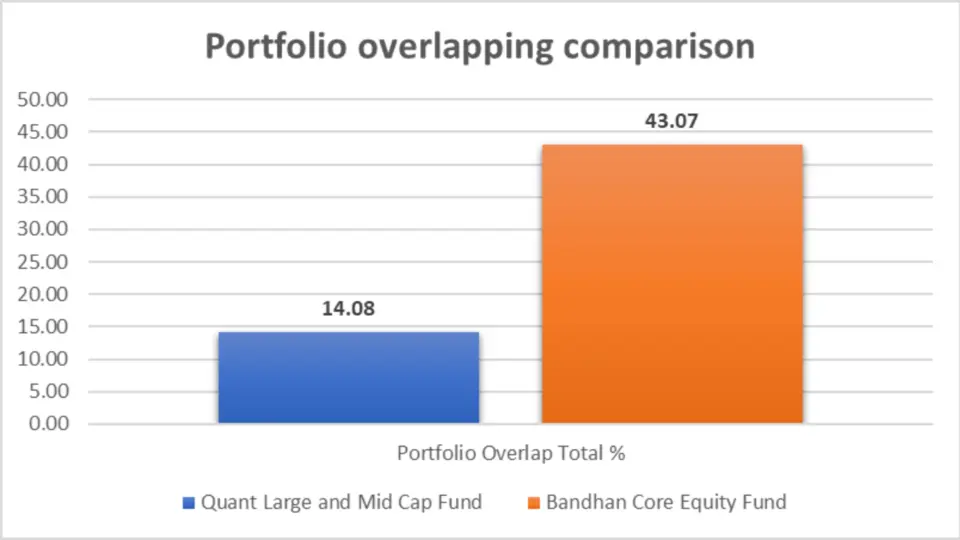
Understanding how much the portfolios of these two funds overlap can give insight into diversification and risk exposure.
| Metric | Quant Large and Mid Cap Fund | Bandhan Core Equity Fund |
| Portfolio Overlap Total % | 43.07% | 14.08% |
Analysis
- Quant Large and Mid Cap Fund: The portfolio overlap for Quant is 43.07%, which is significantly higher than Bandhan’s 14.08%. A higher overlap suggests Quant may share more common holdings with other funds in the same category, potentially reducing diversification.
- Bandhan Core Equity Fund: Bandhan’s lower overlap of 14.08% suggests that it offers a more unique selection of assets, potentially providing better diversification and reducing correlation with other funds.
Key Takeaways:
- Higher Overlap for Quant: This indicates a more significant similarity in holdings with other funds, which could mean less diversification.
- Lower Overlap for Bandhan: Bandhan’s portfolio may provide more unique opportunities, which can benefit diversification and risk management.
Portfolio Composition
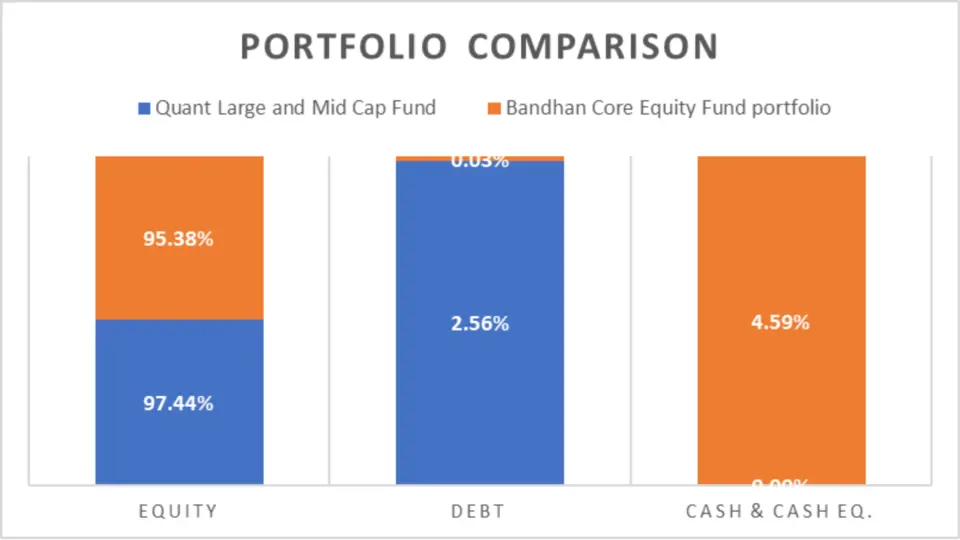
| Asset Class | Quant Large and Mid Cap Fund | Bandhan Core Equity Fund |
| Equity | 97.44% | 95.38% |
| Debt | 2.56% | 0.03% |
| Cash & Cash Equivalents | 0.00% | 4.59% |
| Real Estate, Gold, Others | — | — |
| Commodities | — | — |
Analysis
- Quant Large and Mid Cap Fund: Quant is heavily invested in equities at 97.44%, with a small allocation to debt (2.56%) and no allocation to cash or equivalents. This indicates a highly aggressive investment strategy that maximizes returns through equity exposure.
- Bandhan Core Equity Fund: Bandhan also has a high equity exposure (95.38%) but holds more cash and cash equivalents (4.59%), suggesting a slightly more conservative approach with liquidity to manage risk or capitalize on short-term opportunities.
Key Takeaways:
- Aggressive Equity Exposure in Quant: With almost all its assets in equities, Quant may offer higher growth potential but also higher risk.
- Conservative Cash Holdings in Bandhan: Bandhan’s allocation to cash and equivalents may help manage volatility, offering a buffer during market downturns.
Market Cap Allocation
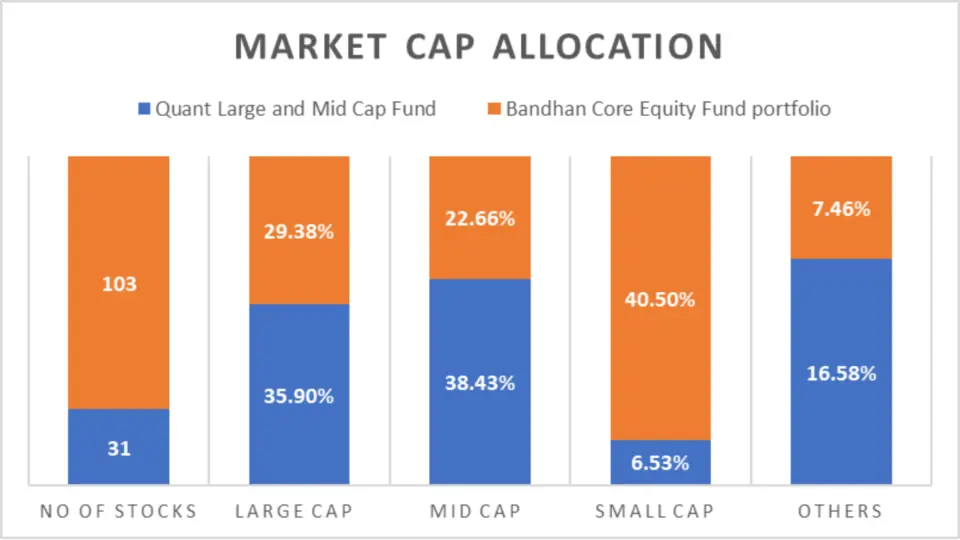
| Metric | Quant Large and Mid Cap Fund | Bandhan Core Equity Fund |
| Number of Stocks | 31 | 103 |
| Large Cap | 35.90% | 29.38% |
| Mid Cap | 38.43% | 22.66% |
| Small Cap | 6.53% | 40.50% |
| Others | 16.58% | 7.46% |
Analysis
- Quant Large and Mid Cap Fund: Quant’s portfolio is balanced between large caps (35.90%) and mid-caps (38.43%), with smaller allocations to small caps (6.53%) and others (16.58%). This mix suggests a strategy aimed at capturing both stability from large companies and growth potential from mid-caps.
- Bandhan Core Equity Fund: Bandhan, on the other hand, has a significant allocation to small caps (40.50%), indicating a strategy focused on high-growth potential but with increased risk. The fund also holds fewer large caps (29.38%) and mid-caps (22.66%), which could lead to higher volatility.
Key Takeaways:
- Balanced Approach in Quant: Quant’s diversified exposure across market caps may provide a balance between growth and stability.
- Growth-Focused Strategy in Bandhan: Bandhan’s heavy small-cap exposure suggests a more aggressive growth strategy, though it may come with increased volatility.
Sector Allocation
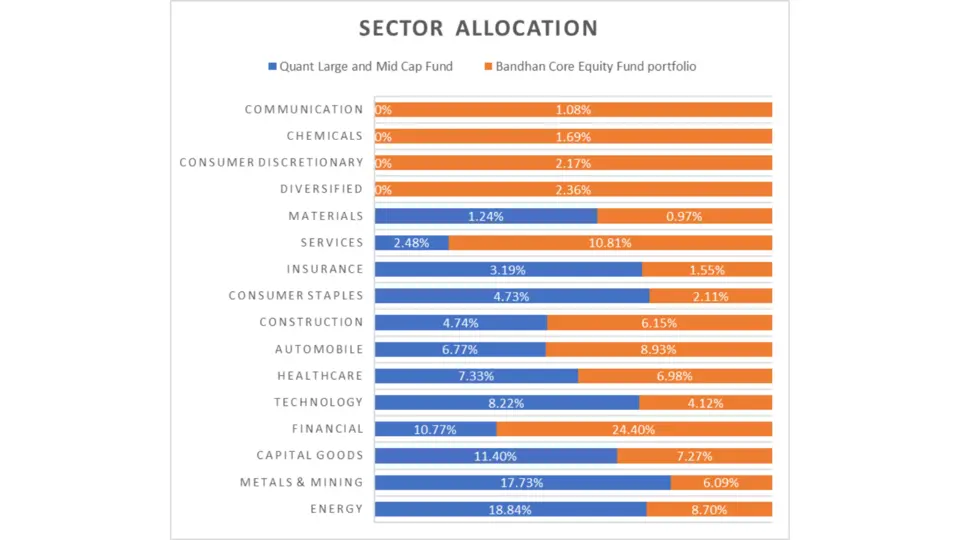
| Sector | Quant Large and Mid Cap Fund | Bandhan Core Equity Fund |
| Energy | 18.84% | 8.70% |
| Metals & Mining | 17.73% | 6.09% |
| Capital Goods | 11.40% | 7.27% |
| Financial | 10.77% | 24.40% |
| Technology | 8.22% | 4.12% |
| Healthcare | 7.33% | 6.98% |
| Automobile | 6.77% | 8.93% |
| Construction | 4.74% | 6.15% |
| Consumer Staples | 4.73% | 2.11% |
| Insurance | 3.19% | 1.55% |
| Services | 2.48% | 10.81% |
| Materials | 1.24% | 0.97% |
| Diversified | N/A | 2.36% |
| Consumer Discretionary | N/A | 2.17% |
| Chemicals | N/A | 1.69% |
| Communication | N/A | 1.08% |
Analysis
- Quant Large and Mid Cap Fund: Quant has a significant allocation to Energy (18.84%) and Metals & Mining (17.73%), indicating a strong focus on sectors that can benefit from economic upswings and inflationary environments. Its smaller allocation to Financials (10.77%) suggests less reliance on traditional financial services than Bandhan.
- Bandhan Core Equity Fund: Bandhan is heavily weighted in the Financial sector (24.40%), which may benefit from stable economic growth and lower interest rates. It also has notable exposure to Services (10.81%) and Automobiles (8.93%), suggesting a diversified approach across different sectors that can perform well in various economic conditions.
Key Takeaways:
- Quant’s Focus on Cyclical Sectors: With a strong emphasis on energy and metals, Quant may perform well during economic expansions and periods of rising commodity prices.
- Bandhan’s Diverse Sector Exposure: Bandhan’s significant allocation to financials and services indicates a strategy that could provide stability and growth across different economic cycles.
Fund Management Comparison

| Fund Manager | No. of Months |
| Manish Gunwani | 16 |
| Rahul Agarwal | 9 |
| Ritika Behera | 7 |
| Harsh Bhatia | 3 |
| Fund Manager | No. of Months |
| Sanjeev Sharma | 87 |
| Vasav Sahgal | 58 |
| Ankit A. Pande | 60 |
Key Takeaways
- Stability in Quant’s Management: The Quant Large and Mid Cap Fund has a more stable and experienced management team, with key figures like Sanjeev Sharma providing consistent leadership over several years.
- Bandhan’s Newer Team: Bandhan Core Equity Fund’s management team is relatively new, which could mean fresh ideas but also less continuity in strategy.
General Details
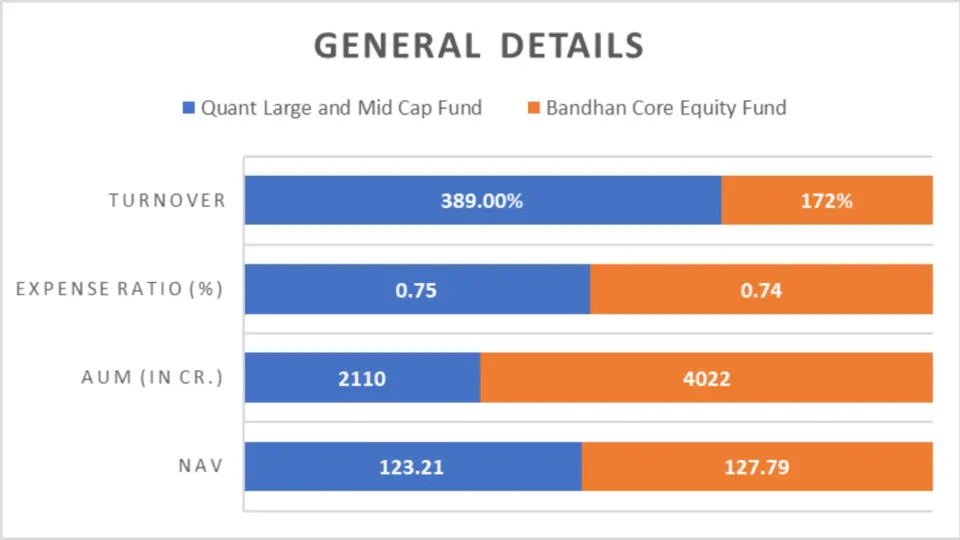
| Metric | Quant Large and Mid Cap Fund | Bandhan Core Equity Fund |
| NAV | ₹123.21 | ₹127.79 |
| AUM (in Cr.) | ₹2110 | ₹4022 |
| Expense Ratio (%) | 0.75% | 0.74% |
| Turnover | 389% | 172% |
| Benchmark | NIFTY 100 | NIFTY 200 |
Key Takeaways
- Higher AUM in Bandhan: Bandhan’s larger AUM indicates greater investor interest, but this doesn’t necessarily translate to better performance.
- Active Strategy in Quant: The higher turnover in Quant suggests a more active management approach, potentially leading to greater returns, albeit with higher associated costs.
Minimum Investment Amount
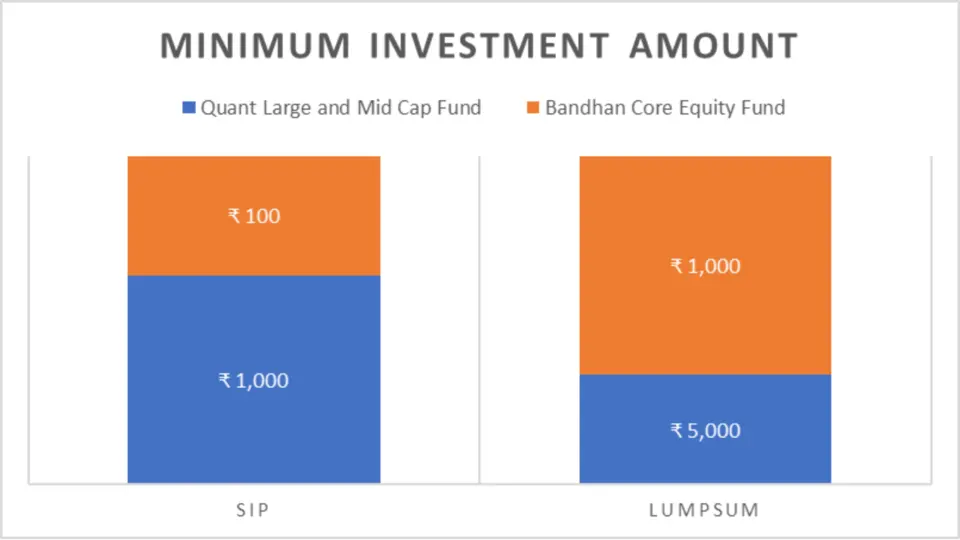
| Investment Type | Quant Large and Mid Cap Fund | Bandhan Core Equity Fund |
| SIP | ₹1,000 | ₹100 |
| Lumpsum | ₹5,000 | ₹1,000 |
Key Takeaways
- Accessibility in Bandhan: Bandhan’s lower minimum investment amounts make it more accessible for a broader range of investors, particularly those just starting their investment journey.
Conclusion
The Quant Large and Mid Cap Fund and the Bandhan Core Equity Fund offer distinct advantages depending on your investment strategy and risk appetite. The Quant fund emerges as the superior choice across most parameters, consistently outperforming Bandhan regarding returns, risk-adjusted performance, and long-term wealth generation.
Its experienced management team, active trading strategy, and lower market sensitivity make it an ideal option for investors seeking robust growth and are willing to tolerate some volatility.
On the other hand, the Bandhan Core Equity Fund, with its lower minimum investment requirements and firm performance in specific volatile periods, could be better suited for conservative investors or those with a lower risk tolerance who prefer a more diversified and accessible entry into the equity market.
Ultimately, your choice should be in line with your financial goals, investment horizon, and risk preference.

FAQ–Bandhan Core Equity Fund vs Quant Large and Mid Cap Fund
Bandhan Core Equity Fund vs Quant Large and Mid Cap Fund
The Quant Large and Mid Cap Fund has consistently outperformed the Bandhan Core Equity Fund over the long term. With higher returns across 5-year and 10-year periods, Quant demonstrates more substantial long-term growth potential, making it an ideal choice for investors focused on wealth accumulation over extended periods.
What is the minimum investment required for SIP in both funds?
The minimum SIP investment for the Bandhan Core Equity Fund is ₹100, making it highly accessible for new investors or those with smaller budgets. In contrast, the Quant Large and Mid Cap Fund requires a minimum SIP investment of ₹1,000.
How do the funds compare regarding risk, as measured by Standard Deviation?
The Quant Large and Mid Cap Fund shows slightly higher short-term volatility with a 3-year standard deviation of 15.44% compared to Bandhan’s 13.03%. However, over 5 and 10 years, both funds exhibit similar levels of volatility, although Bandhan tends to be slightly more volatile in the long term.
Which fund offers better risk-adjusted returns?
The Quant Large and Mid Cap Fund provides better risk-adjusted returns, as reflected in its higher Sharpe Ratio across 3-year, 5-year, and 10-year periods. This suggests that Quant is more efficient in delivering returns relative to the risk taken.
How do the funds perform in volatile markets?
The Quant Large and Mid Cap Fund generally offers better downside protection in volatile markets, as indicated by its lower maximum drawdown over both 3-year and 5-year periods. However, the Bandhan Core Equity Fund has shown resilience in specific less severe downturns by effectively limiting losses.
What are the critical differences in portfolio composition between these funds?
The Quant Large and Mid Cap Fund has a higher equity exposure (97.44%) and focuses more on cyclical sectors like Energy, and Metals & Mining. In contrast, with 95.38% in equities, the Bandhan Core Equity Fund has a more diversified sector allocation, with significant exposure to Financials and Services, offering stability and growth.
Which fund has a more experienced management team?
The Quant Large and Mid Cap Fund boasts a more experienced and stable management team, with Sanjeev Sharma leading the fund for over 7 years. In contrast, the Bandhan Core Equity Fund’s management team is relatively newer, with shorter tenures ranging from 3 to 16 months.
How do the expense ratios compare between the two funds?
Both funds have similar expense ratios, with Quant at 0.75% and Bandhan at 0.74%. This means that the cost of investing in either fund is comparable, offering similar cost efficiency to investors.
Which fund is better for a conservative investor?
For conservative investors, the Bandhan Core Equity Fund may be more suitable due to its lower minimum investment amounts, slightly higher exposure to cash and equivalents, and greater focus on large-cap stocks, which can offer more stability.
What fund should I choose if I seek high-growth potential?
If you seek high-growth potential and are willing to accept some volatility, the Quant Large and Mid Cap Fund is the better choice. It consistently outperforms in terms of returns, has a more aggressive equity allocation, and demonstrates risk-adjusted solid performance over various periods.
Disclaimer:
The information provided in this article is solely the author/advertisers’ opinion and not investment advice – it is provided for educational purposes only. Using this, you agree that the information does not constitute any investment or financial instructions by Ace Equity Research/Mutual Fund Focus/IPO First and the team. Anyone wishing to invest should seek their own independent financial or professional advice. Conduct your research with registered financial advisors before making any investment decisions. Ace Equity Research/ Mutual Fund Focus / IPO First and the team are not accountable for the investment views provided in the article.
Mutual Fund investments are subject to market risks. Read all scheme-related documents carefully.
Investments in the securities market are subject to market risks. Read all the related documents carefully before investing