We plan to invest in Flexicap funds and need clarification on the HDFC Flexi Cap Fund vs UTI Flexi Cap Fund. Here, we will dive deep into a five-step comprehensive comparative analysis of these two Flexicap mutual funds, HDFC Flexi Cap Fund vs. UTI Flexi Cap Fund, on all critical parameters. This is to help you choose the most consistent and the best Flexicap mutual funds for your mutual fund investment portfolio for long-term investment by investing in the fund, which has done well consistently over the period in terms of better risk-adjusted returns and Alpha generation.
Investment Style
UTI Flexi Cap Fund: Growth
HDFC Flexi Cap Fund: Growth
Both funds follow a growth-oriented investment style, aiming for capital appreciation over the long term.

Returns Analysis
Trailing Returns

| Period Invested for | UTI Flexi Cap Fund | HDFC Flexi Cap Fund |
| 1 Year | 22.05% | 43.40% |
| 2 Year | 7.04% | 25.47% |
| 3 Year | 9.84% | 28.57% |
| 5 Year | 14.15% | 19.67% |
| 10 Year | 14.69% | 17.56% |
Analysis:
- 1 Year: HDFC Flexi Cap Fund significantly outperformed UTI Flexi Cap Fund with a return of 43.40% compared to 22.05%.
- 2 Year: HDFC maintained its superior performance with a return of 25.47%, overshadowing UTI’s 7.04%.
- 3 Year: The trend continues, with HDFC delivering 28.57% returns, while UTI managed 9.84%.
- 5 Year: HDFC showed a return of 19.67%, whereas UTI delivered 14.15%. Over the longer term, HDFC still outperforms UTI, though the margin narrows slightly.
- 10 Year: HDFC slightly edged out UTI with 17.56% versus 14.69%.
Key Takeaways:
- HDFC Flexi Cap Fund consistently outperforms UTI Flexi Cap Fund across all periods.
- HDFC shows solid short-term growth, significantly outperforming UTI in 1 and 2-year returns.
- Over the long term, HDFC continues to lead, and although the gap narrows, both funds still provide strong returns.
- Investors seeking better risk-adjusted returns and consistent performance may find HDFC Flexi Cap Fund more attractive.
Lumpsum Investment Value
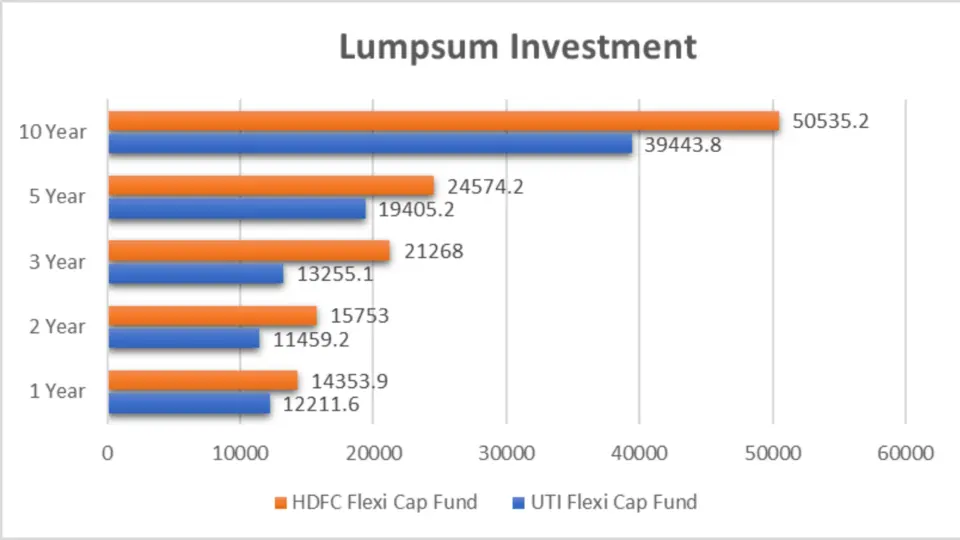
| Period Invested for | UTI Flexi Cap Fund | HDFC Flexi Cap Fund |
| 1 Year | ₹12,211.60 | ₹14,353.90 |
| 2 Year | ₹11,459.20 | ₹15,753.00 |
| 3 Year | ₹13,255.10 | ₹21,268.00 |
| 5 Year | ₹19,405.20 | ₹24,574.20 |
| 10 Year | ₹39,443.80 | ₹50,535.20 |
Analysis:
- 1 Year: A ₹10,000 investment in HDFC Flexi Cap Fund would now be worth ₹14,353.90, compared to ₹12,211.60 in UTI Flexi Cap Fund. HDFC outperformed UTI by a significant margin in the short term.
- 2 Year: HDFC’s investment value grows to ₹15,753.00, while UTI’s stands at ₹11,459.20. This reflects HDFC’s superior performance over two years.
- 3 Year: HDFC leads with a lumpsum value of ₹21,268.00 against UTI’s ₹13,255.10. The difference in growth further highlights HDFC’s consistent outperformance.
- 5 Year: HDFC continues its dominance with an investment value of ₹24,574.20, compared to UTI’s ₹19,405.20. Over five years, HDFC has shown better growth potential.
- 10 Year: HDFC culminates with a lumpsum value of ₹50,535.20, overshadowing UTI’s ₹39,443.80. In the long term, the HDFC Flexi Cap Fund proves to be a more lucrative investment option.
Key Takeaways:
- HDFC Flexi Cap Fund consistently delivers higher lumpsum investment values than UTI Flexi Cap Fund across all periods.
- A ₹10,000 investment in HDFC Flexi Cap Fund would have grown significantly more than in UTI Flexi Cap Fund, particularly in shorter investment periods.
- Over longer investment horizons, HDFC maintains a strong lead, making it a potentially better choice for long-term investors.
- HDFC’s higher investment value demonstrates its robust performance and growth potential across all periods.
SIP Returns

| Period Invested for | UTI Flexi Cap Fund | HDFC Flexi Cap Fund |
| 1 Year | 12.82% | 38.86% |
| 2 Year | 12.31% | 32.65% |
| 3 Year | 8.13% | 27.99% |
| 5 Year | 14.09% | 27.39% |
| 10 Year | 13.45% | 18.64% |
Analysis:
- 1 Year: SIP in HDFC Flexi Cap Fund yielded 38.86%, far ahead of UTI Flexi Cap Fund’s 12.82%.
- 2 Year: HDFC’s SIP return of 32.65% beats UTI’s 12.31%.
- 3 Year: HDFC leads with 27.99% over UTI’s 8.13%.
- 5 Year: HDFC’s Return is 27.39%, compared to UTI’s 14.09%.
- 10 Year: HDFC ends with 18.64%, while UTI provides 13.45%.
Key Takeaways:
- HDFC Flexi Cap Fund consistently delivers higher SIP returns than UTI Flexi Cap Fund across all periods.
- HDFC Flexi Cap Fund’s short-term SIP performance is significantly superior, with returns almost three times higher than UTI’s over one year.
- Over medium and long-term investment periods, HDFC Flexi Cap Fund maintains its lead, making it a strong contender for investors looking for robust SIP returns.
- HDFC’s higher SIP returns across various periods highlight its consistent performance and potential for wealth creation.
SIP Investment Value
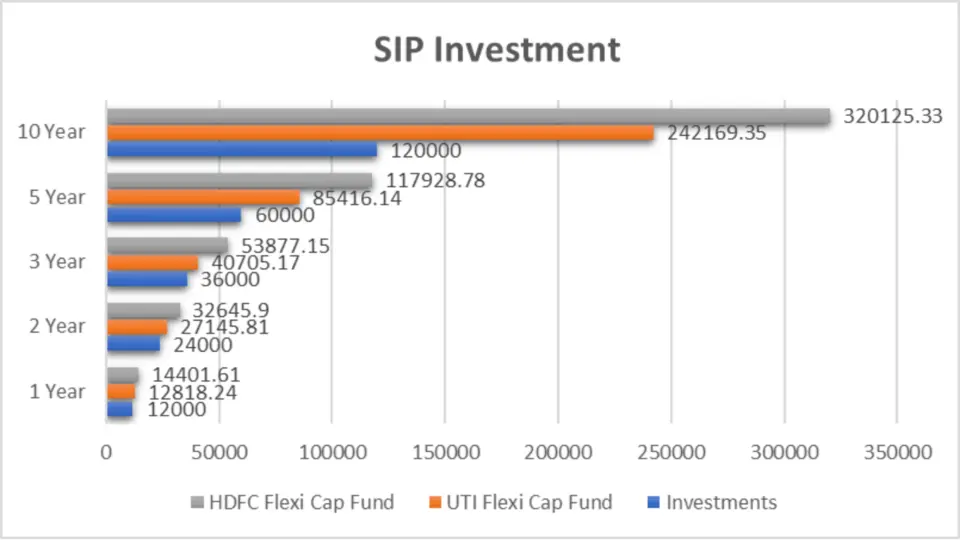
Investment Values Over Different Periods
| Period Invested for | Investments | UTI Flexi Cap Fund | HDFC Flexi Cap Fund |
| 1 Year | ₹12,000 | ₹12,818.24 | ₹14,401.61 |
| 2 Year | ₹24,000 | ₹27,145.81 | ₹32,645.90 |
| 3 Year | ₹36,000 | ₹40,705.17 | ₹53,877.15 |
| 5 Year | ₹60,000 | ₹85,416.14 | ₹117,928.78 |
| 10 Year | ₹1,20,000 | ₹2,42,169.35 | ₹3,20,125.33 |
Analysis:
- 1 Year: Investing ₹12,000 in HDFC Flexi Cap Fund would have grown to ₹14,401.61, compared to ₹12,818.24 in UTI Flexi Cap Fund.
- 2 Year: HDFC’s investment value reaches ₹32,645.90, whereas UTI’s stands at ₹27,145.81.
- 3 Year: HDFC continues to outperform with an investment value of ₹53,877.15 against UTI’s ₹40,705.17.
- 5 Year: HDFC’s value grows to ₹1,17,928.78, compared to UTI’s ₹85,416.14.
- 10 Year: Over a decade, HDFC achieves an impressive ₹3,20,125.33, overshadowing UTI’s ₹2,42,169.35.
Key Takeaways:
- HDFC Flexi Cap Fund consistently delivers higher SIP investment values than UTI Flexi Cap Fund across all periods.
- Short-term Performance: In the 1 year, HDFC’s value is significantly higher, indicating better short-term returns.
- Long-term Growth: Over 10 years, HDFC has shown superior growth, making it a strong choice for long-term investments.
- Medium-term Advantage: In the 3 and 5-year periods, HDFC continues to outshine UTI, highlighting its consistent performance.
Compound Annual Growth Rate (CAGR)

| Category | 1 Year | 3 Year | 5 Year | 9 Year |
| UTI Flexi Cap Fund | 23.87% | 9.29% | 14.28% | 12.03% |
| HDFC Flexi Cap Fund | 44.10% | 27.10% | 19.44% | 15.46% |
Analysis:
- 1 Year: HDFC’s CAGR is 44.10%, significantly higher than UTI’s 23.87%.
- 3 Year: HDFC maintains a strong lead with 27.10%, while UTI lags at 9.29%.
- 5 Year: HDFC’s CAGR is 19.44%, compared to UTI’s 14.28%.
- 9 Year: Over the long term, HDFC achieves 15.46%, ahead of UTI’s 12.03%.
Key Takeaways:
- HDFC Flexi Cap Fund shows a superior CAGR across all periods, demonstrating its strong growth potential.
- Short-term Growth: HDFC’s 1-year CAGR of 44.10% indicates excellent short-term growth.
- Sustained Performance: Over medium and long-term periods, HDFC consistently outperforms UTI, making it a reliable choice for sustained growth.
Rolling Returns
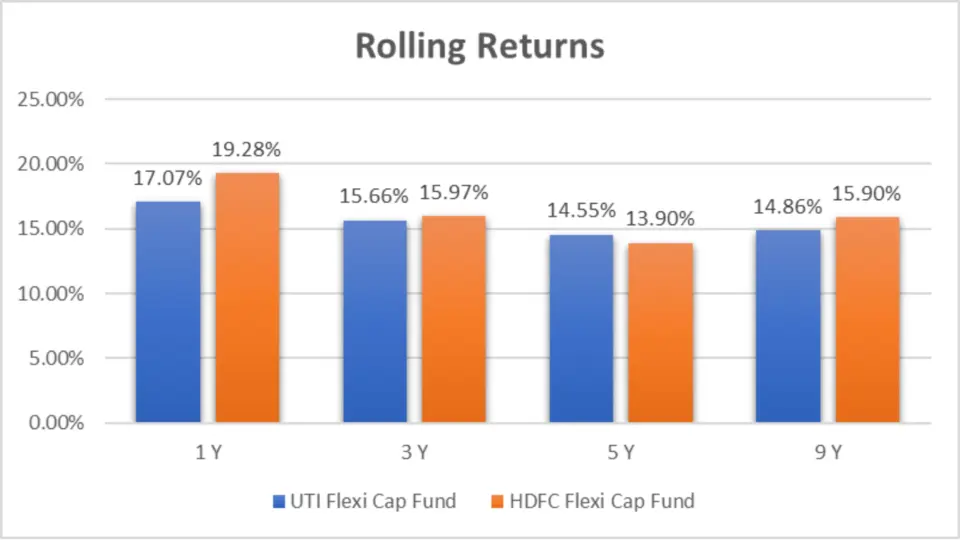
| Category | 1 Year | 3 Year | 5 Year | 9 Year |
| UTI Flexi Cap Fund | 17.07% | 15.66% | 14.55% | 14.86% |
| HDFC Flexi Cap Fund | 19.28% | 15.97% | 13.90% | 15.90% |
Analysis:
- 1 Year: HDFC’s rolling Return is 19.28%, slightly higher than UTI’s 17.07%.
- 3 Year: HDFC continues to lead with 15.97%, compared to UTI’s 15.66%.
- 5 Year: UTI takes a slight edge with 14.55%, while HDFC is at 13.90%.
- 9 Year: HDFC shows 15.90%, marginally outperforming UTI’s 14.86%.
Key Takeaways:
- HDFC Flexi Cap Fund generally delivers higher rolling returns, though the margins are closer than SIP investment values and CAGR.
- Short-term Advantage: In the 1 year, HDFC leads slightly, indicating marginally better short-term stability.
- Long-term Performance: Over the 9 years, HDFC’s rolling Return remains superior, underscoring its long-term growth consistency.
Annualized/Calendar Year Returns
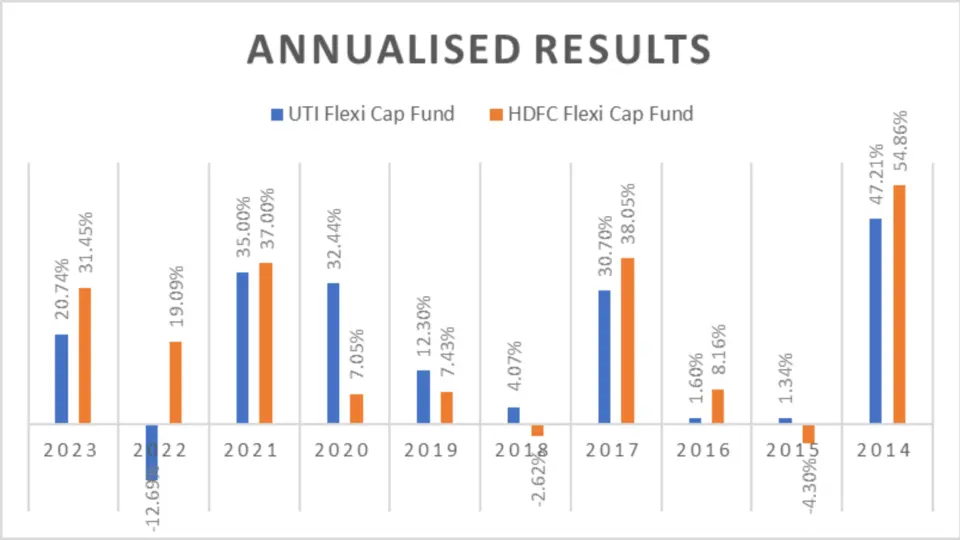
| Period | UTI Flexi Cap Fund | HDFC Flexi Cap Fund |
| 2023 | 20.74% | 31.45% |
| 2022 | -12.69% | 19.09% |
| 2021 | 35.00% | 37.00% |
| 2020 | 32.44% | 7.05% |
| 2019 | 12.30% | 7.43% |
| 2018 | 4.07% | -2.62% |
| 2017 | 30.70% | 38.05% |
| 2016 | 1.60% | 8.16% |
| 2015 | 1.34% | -4.30% |
| 2014 | 47.21% | 54.86% |
Analysis:
- 2023: HDFC Flexi Cap Fund outperformed UTI Flexi Cap Fund with a return of 31.45% compared to 20.74%.
- 2022: HDFC delivered a positive return of 19.09%, whereas UTI had a negative return of -12.69%.
- 2021: Both funds performed well, with HDFC slightly ahead at 37.00% compared to UTI’s 35.00%.
- 2020: UTI Flexi Cap Fund outperformed HDFC with 32.44% against HDFC’s 7.05%.
- 2019: UTI achieved 12.30%, while HDFC had 7.43%.
- 2018: UTI posted a positive return of 4.07%, whereas HDFC showed a negative return of -2.62%.
- 2017: HDFC led with 38.05%, compared to UTI’s 30.70%.
- 2016: HDFC performed better at 8.16%, while UTI had 1.60%.
- 2015: UTI had a slight positive return of 1.34%, while HDFC was at -4.30%.
- 2014: Both funds had strong returns, with HDFC at 54.86% and UTI at 47.21%.
Key Takeaways:
- HDFC Flexi Cap Fund outperformed UTI Flexi Cap Fund in 6 out of 10 years.
- Short-term Performance: In recent years, such as 2023 and 2022, HDFC consistently delivered higher returns.
- Volatility: UTI showed more volatility with a mix of high positive and negative returns in specific years.
- Long-term Growth: Both funds show strong long-term growth potential, but HDFC has a slight edge and inconsistent performance.
Best Quarters
| Period | UTI Flexi Cap Fund | HDFC Flexi Cap Fund |
| Q4 2020 | 26.78% | 26.67% |
| Q2 2020 | 21.06% | 21.12% |
Worst Quarters
| Period | UTI Flexi Cap Fund | HDFC Flexi Cap Fund |
| Q1 2020 | -23.64% | -32.13% |
Analysis:
- Best Quarters: Both funds performed exceptionally well in Q4 2020 and Q2 2020. HDFC slightly outperformed UTI in Q2 2020.
- Worst Quarters: HDFC had a more significant drop in Q1 2020, at 32.13%, compared to UTI’s 23.64%.
Key Takeaways:
- HDFC Flexi Cap Fund shows slightly better performance in the best quarters.
- Volatility: HDFC experienced higher volatility in the worst quarters compared to UTI.
Quarterly Results
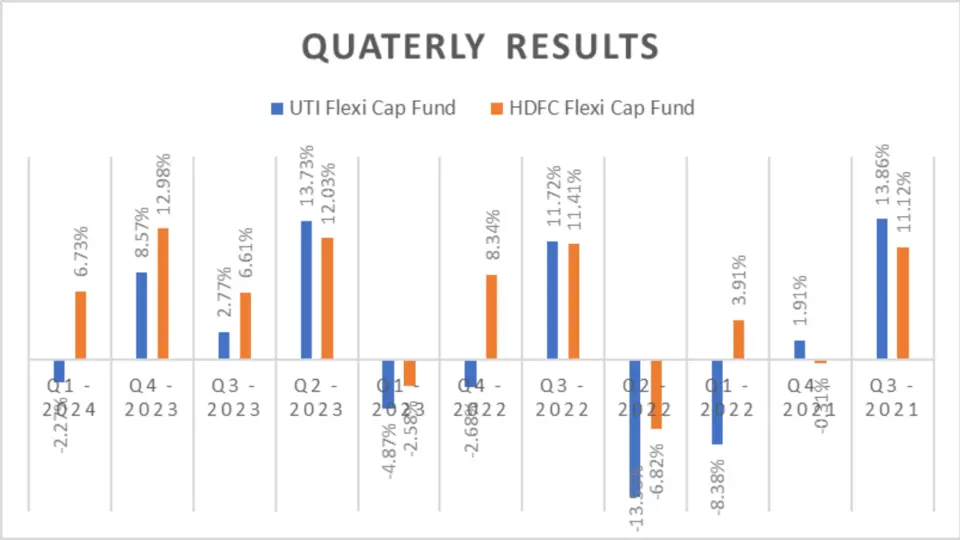
| Period | UTI Flexi Cap Fund | HDFC Flexi Cap Fund |
| Q1 2024 | -2.27% | 6.73% |
| Q4 2023 | 8.57% | 12.98% |
| Q3 2023 | 2.77% | 6.61% |
| Q2 2023 | 13.73% | 12.03% |
| Q1 2023 | -4.87% | -2.58% |
| Q4 2022 | -2.68% | 8.34% |
| Q3 2022 | 11.72% | 11.41% |
| Q2 2022 | -13.55% | -6.82% |
| Q1 2022 | -8.38% | 3.91% |
| Q4 2021 | 1.91% | -0.31% |
| Q3 2021 | 13.86% | 11.12% |
Analysis:
- 2024 Q1: HDFC Flexi Cap Fund had a positive return of 6.73%, while UTI had -2.27%.
- 2023 Q4: HDFC outperformed with 12.98%, compared to UTI’s 8.57%.
- 2023 Q3: HDFC again led with 6.61%, while UTI had 2.77%.
- 2023 Q2: UTI slightly outperformed HDFC with 13.73% versus 12.03%.
- 2023 Q1: Both funds had negative returns, but HDFC’s -2.58% was less harmful than UTI’s -4.87%.
Key Takeaways:
- HDFC Flexi Cap Fund outperformed UTI Flexi Cap Fund in 7 of the last 11 quarters.
- Quarterly Volatility: HDFC shows more consistency in quarterly performance, indicating robust management.


Risk Analysis
Maximum Drawdown

| Period | UTI Flexi Cap Fund | HDFC Flexi Cap Fund |
| 3-Yr | -20.2 | -26.09 |
| 5-Yr | -5.82 | -34.34 |
Analysis:
- 3-Year Drawdown: HDFC experienced a higher maximum drawdown at -26.09%, compared to UTI’s -20.2%.
- 5-Year Drawdown: Over 5 years, HDFC’s drawdown was -34.34%, while UTI’s was much lower at -5.82%.
Key Takeaways:
- UTI Flexi Cap Fund has a lower maximum drawdown over both 3-year and 5-year periods, indicating potentially lower risk.
- Risk Management: Investors looking for lower risk may prefer UTI based on drawdown metrics.
Mean Return, Sortino Ratio, and Treynor’s Ratio
| Metric | UTI Flexi Cap Fund | HDFC Flexi Cap Fund |
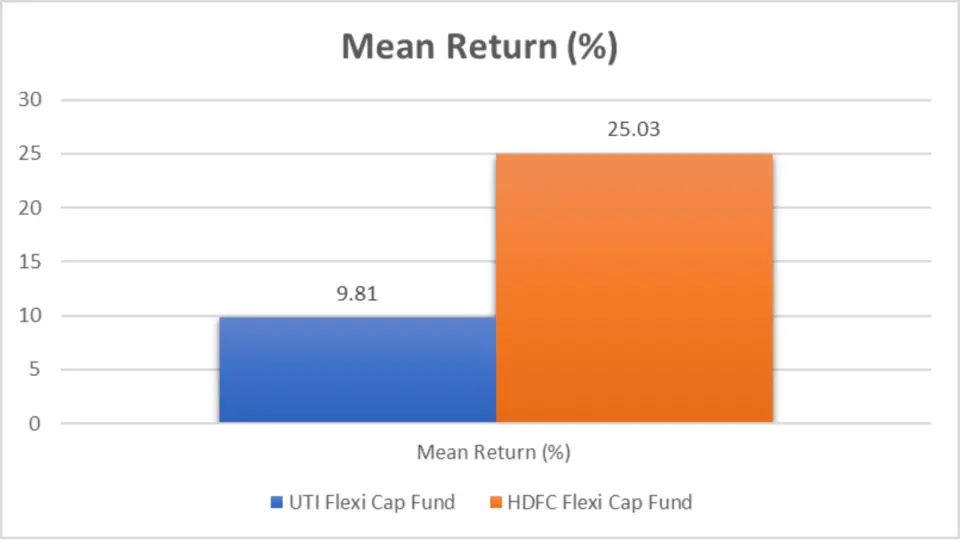
| Mean Return (%) | 9.81 | 25.03 |
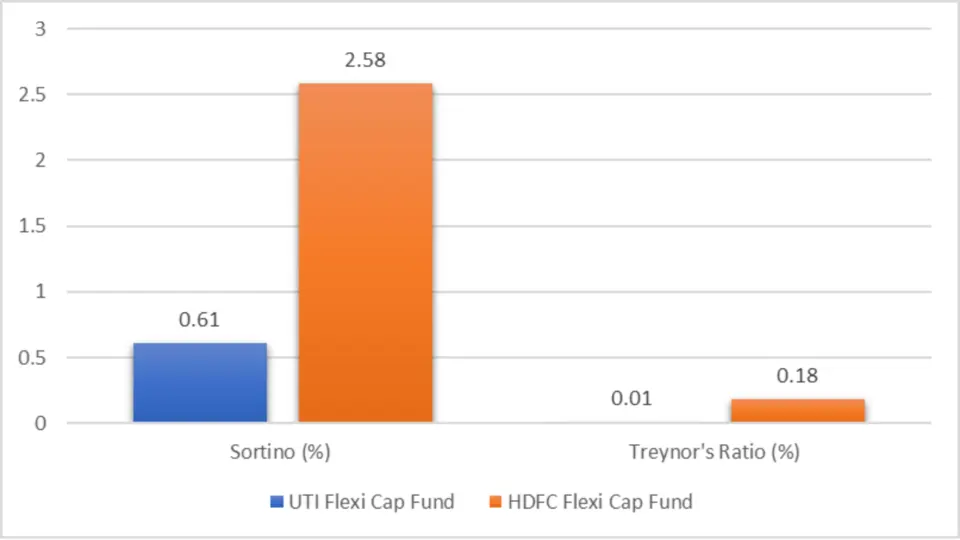
| Sortino Ratio | 0.61 | 2.58 |
| Treynor’s Ratio | 0.01 | 0.18 |
Analysis:
- Mean Return (%): HDFC Flexi Cap Fund boasts a significantly higher mean return of 25.03% compared to UTI’s 9.81%.
- Sortino Ratio: HDFC’s Sortino Ratio is 2.58, much higher than UTI’s 0.61, indicating better risk-adjusted returns.
- Treynor’s Ratio: HDFC again leads with 0.18 compared to UTI’s 0.01, showcasing its superior performance against systematic risk.
Key Takeaways:
- Higher Returns: HDFC Flexi Cap Fund consistently delivers higher mean returns and better risk-adjusted performance metrics.
- Risk Management: HDFC’s higher Sortino and Treynor Ratios suggest more efficient risk management and higher compensation for risk taken.
Standard Deviation
| Metric | UTI Flexi Cap Fund | HDFC Flexi Cap Fund |
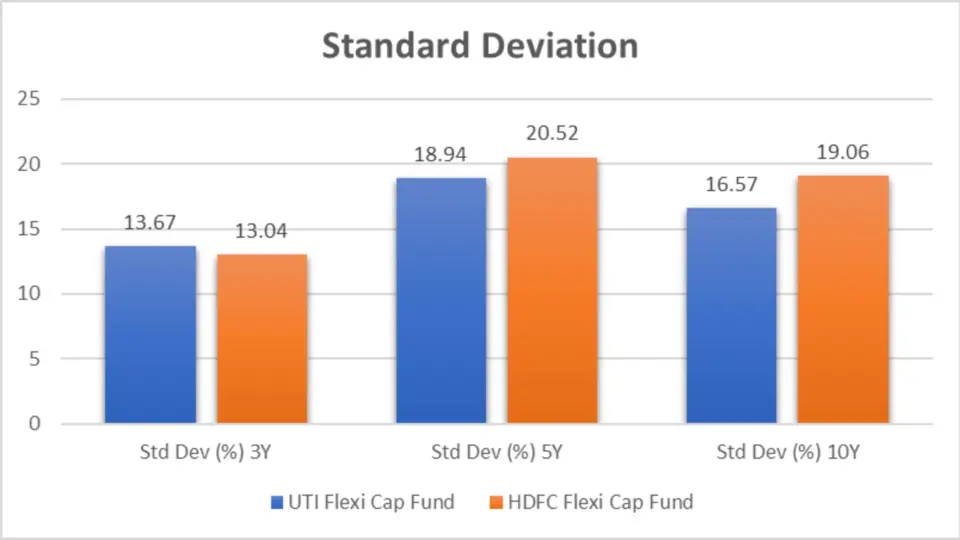
| Std Dev (%) 3Y | 13.67 | 13.04 |
| Std Dev (%) 5Y | 18.94 | 20.52 |
| Std Dev (%) 10Y | 16.57 | 19.06 |
Analysis:
- 3-Year Std Dev: UTI shows higher volatility, 13.67%, compared to HDFC’s 13.04%.
- 5-Year Std Dev: HDFC’s volatility increases to 20.52%, whereas UTI is slightly lower at 18.94%.
- 10-Year Std Dev: Over the long term, HDFC remains more volatile at 19.06% against UTI’s 16.57%.
Key Takeaways:
- Volatility: HDFC Flexi Cap Fund exhibits higher volatility across 5-year and 10-year periods, which can translate to higher risk.
- Short-term Stability: In the short term (3 years), HDFC shows marginally lower volatility than UTI.
Sharpe Ratio
| Metric | UTI Flexi Cap Fund | HDFC Flexi Cap Fund |
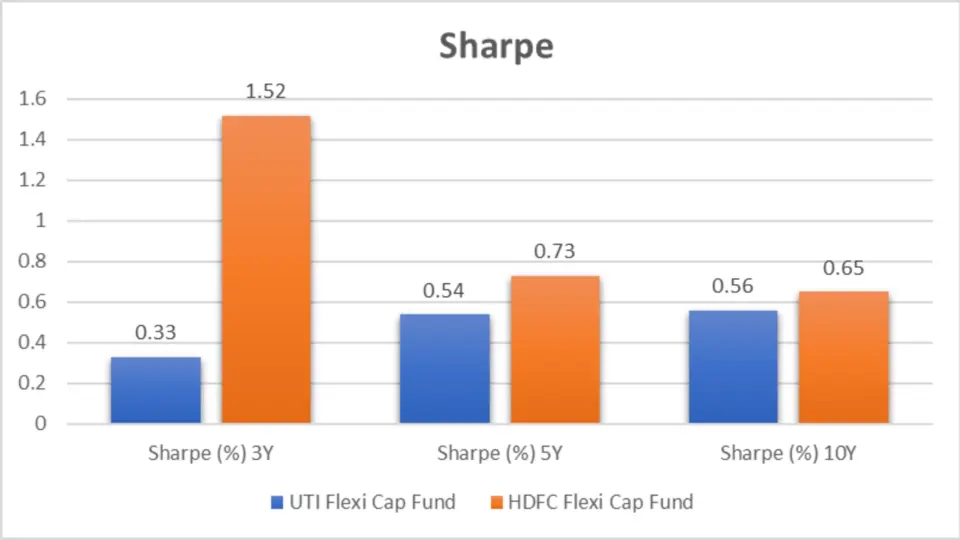
| Sharpe (%) 3Y | 0.33 | 1.52 |
| Sharpe (%) 5Y | 0.54 | 0.73 |
| Sharpe (%) 10Y | 0.56 | 0.65 |
Analysis:
- 3-Year Sharpe Ratio: HDFC’s Sharpe Ratio of 1.52 indicates superior risk-adjusted returns compared to UTI’s 0.33.
- 5-Year Sharpe Ratio: HDFC again leads with 0.73, while UTI is at 0.54.
- 10-Year Sharpe Ratio: HDFC maintains a higher Sharpe Ratio at 0.65, compared to UTI’s 0.56.
Key Takeaways:
- Risk-Adjusted Returns: HDFC Flexi Cap Fund consistently offers better risk-adjusted returns across all periods.
- Long-term Performance: Over the long term, HDFC continues to provide better returns per unit of risk taken.
Beta Analysis
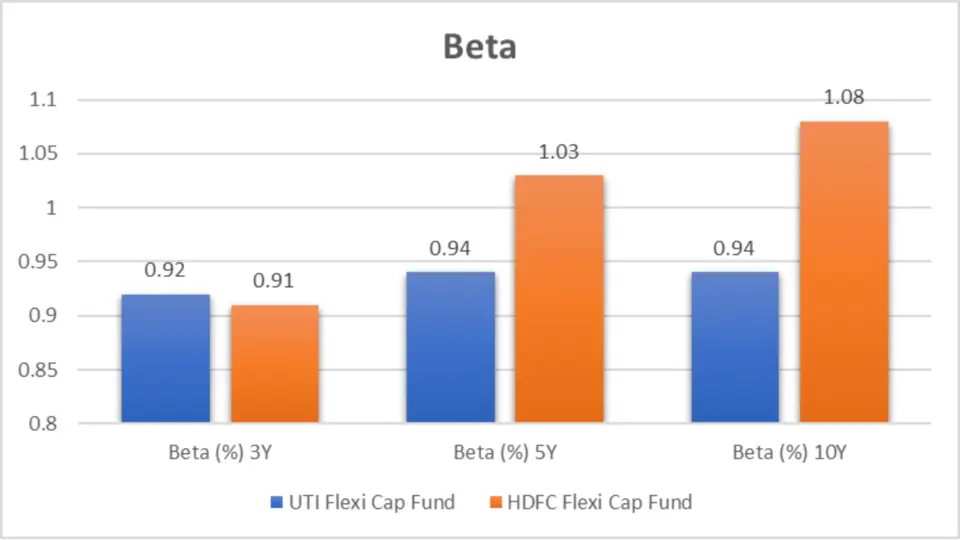
| Metric | UTI Flexi Cap Fund | HDFC Flexi Cap Fund |
| Beta (%) 3Y | 0.92 | 0.91 |
| Beta (%) 5Y | 0.94 | 1.03 |
| Beta (%) 10Y | 0.94 | 1.08 |
Analysis:
- 3-Year Beta: HDFC has a slightly lower beta of 0.91 than UTI’s 0.92, indicating marginally lower market sensitivity.
- 5-Year Beta: HDFC’s Beta increases to 1.03, showing higher sensitivity to market movements than UTI’s 0.94.
- 10-Year Beta: HDFC’s Beta is 1.08, suggesting higher volatility relative to the market than UTI’s 0.94.
Key Takeaways:
- Market Sensitivity: HDFC Flexi Cap Fund shows higher market sensitivity in the long term, indicating more responsiveness to market changes.
- Lower Beta in the short term: HDFC has a slightly lower beta in the short term, suggesting it might be less volatile relative to the market.
Alpha Analysis
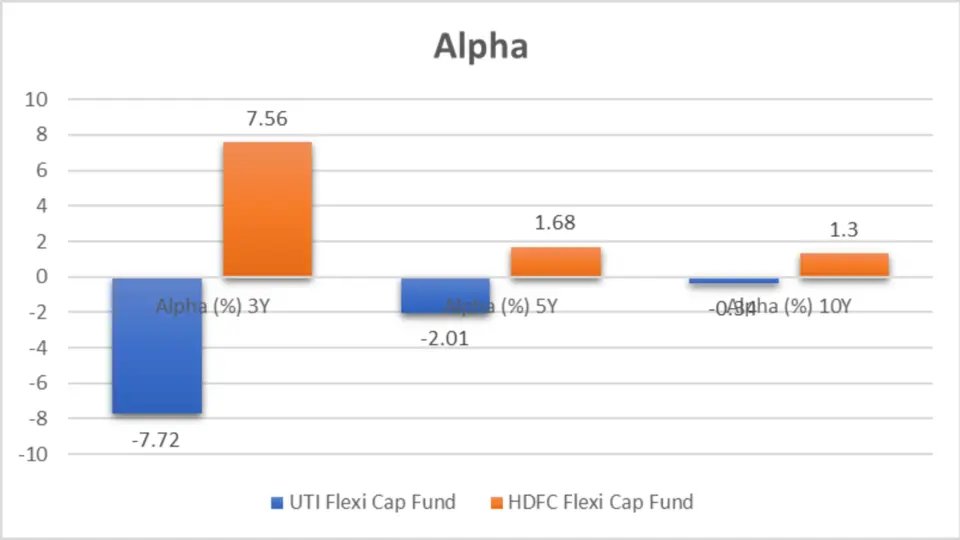
| Metric | UTI Flexi Cap Fund | HDFC Flexi Cap Fund |
| Alpha (%) 3Y | -7.72 | 7.56 |
| Alpha (%) 5Y | -2.01 | 1.68 |
| Alpha (%) 10Y | -0.34 | 1.3 |
Analysis:
- 3-Year Alpha: HDFC Flexi Cap Fund shows a positive alpha of 7.56%, indicating outperformance, whereas UTI’s alpha is negative at -7.72%.
- 5-Year Alpha: HDFC continues to outperform with 1.68%, while UTI remains negative at -2.01%.
- 10-Year Alpha: HDFC maintains positive alpha at 1.3%, compared to UTI’s -0.34%.
Key Takeaways:
- Fund Outperformance: HDFC Flexi Cap Fund consistently delivers positive alpha, indicating superior performance relative to the benchmark.
- UTI’s Negative Alpha: UTI Flexi Cap Fund shows negative alpha across all periods, suggesting underperformance relative to the market.
Ratings
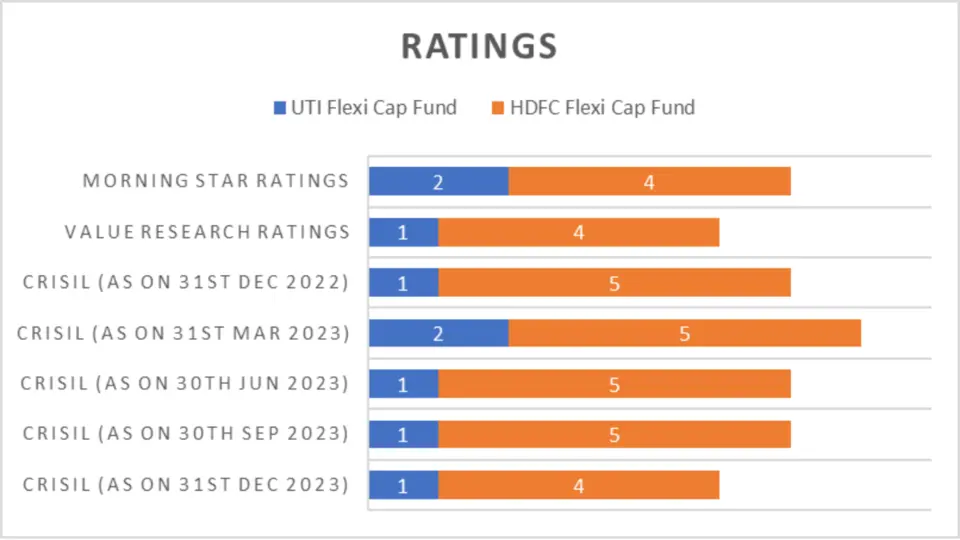
| Rating Source | UTI Flexi Cap Fund | HDFC Flexi Cap Fund |
| CRISIL (as on 31st Dec 2023) | 1 | 4 |
| CRISIL (as on 30th Sep 2023) | 1 | 5 |
| CRISIL (as on 30th Jun 2023) | 1 | 5 |
| CRISIL (as on 31st Mar 2023) | 2 | 5 |
| CRISIL (as on 31st Dec 2022) | 1 | 5 |
| Value Research Ratings | 1 | 4 |
| Morning Star Ratings | 2 | 4 |
Key Takeaways:
- CRISIL Ratings: UTI Flexi Cap Fund consistently receives higher CRISIL ratings than HDFC Flexi Cap Fund.
- Value Research and Morning Star: UTI generally scores better in independent ratings, suggesting a more substantial reputation among rating agencies.
Portfolio Analysis
Portfolio Overlapping Comparison
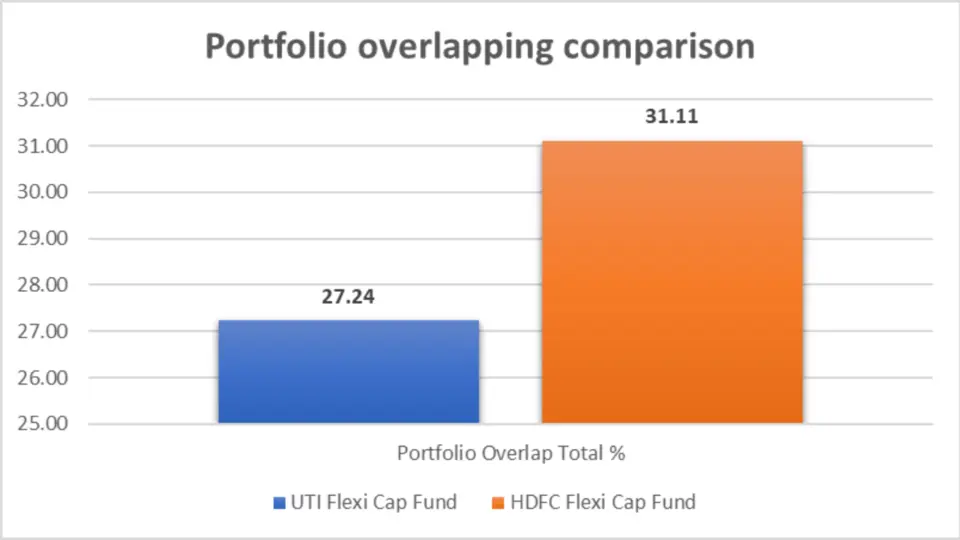
| Metric | UTI Flexi Cap Fund | HDFC Flexi Cap Fund |
| Portfolio Overlap Total % | 27.24 | 31.11 |
Analysis:
- Overlap Percentage: HDFC Flexi Cap Fund has a slightly higher portfolio overlap at 31.11% compared to UTI’s 27.24%.
Key Takeaways:
- Diverse Portfolios: Both funds maintain diverse portfolios with a relatively low overlap percentage, ensuring a spread of risk.
Portfolio Comparison
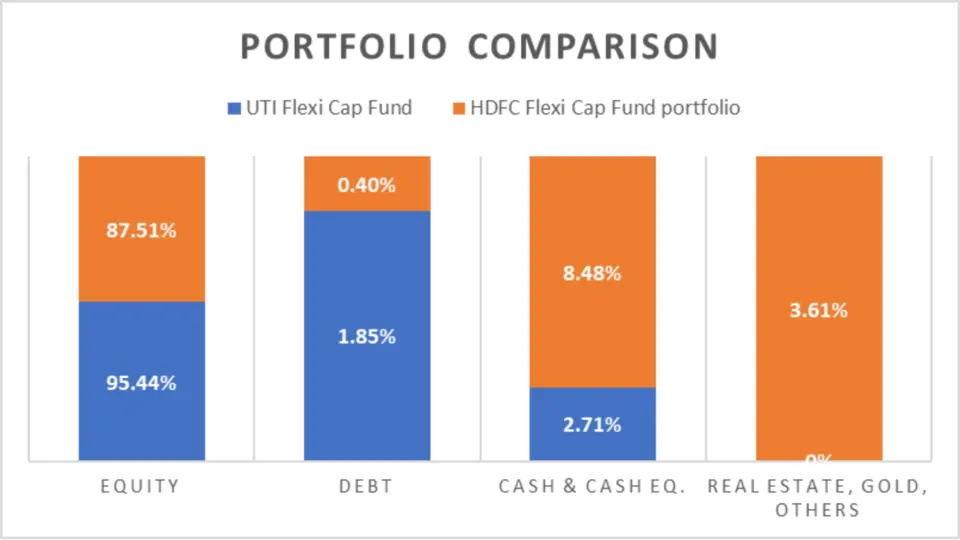
| Category | UTI Flexi Cap Fund | HDFC Flexi Cap Fund |
| Equity | 95.44% | 87.51% |
| Debt | 1.85% | 0.40% |
| Cash & Cash Equiv. | 2.71% | 8.48% |
| Real Estate, Gold, Others | 0% | 3.61% |
Analysis:
- Equity Exposure: UTI Flexi Cap Fund has higher equity exposure at 95.44%, while HDFC has 87.51%.
- Cash Holdings: HDFC holds more cash and cash equivalents at 8.48%, compared to UTI’s 2.71%.
Key Takeaways:
- Higher Equity Exposure: UTI Flexi Cap Fund is more heavily invested in equities, indicating a potentially higher risk/reward profile.
- Liquidity Management: HDFC’s higher cash holdings suggest a more conservative approach to liquidity management.
Market Cap Allocation
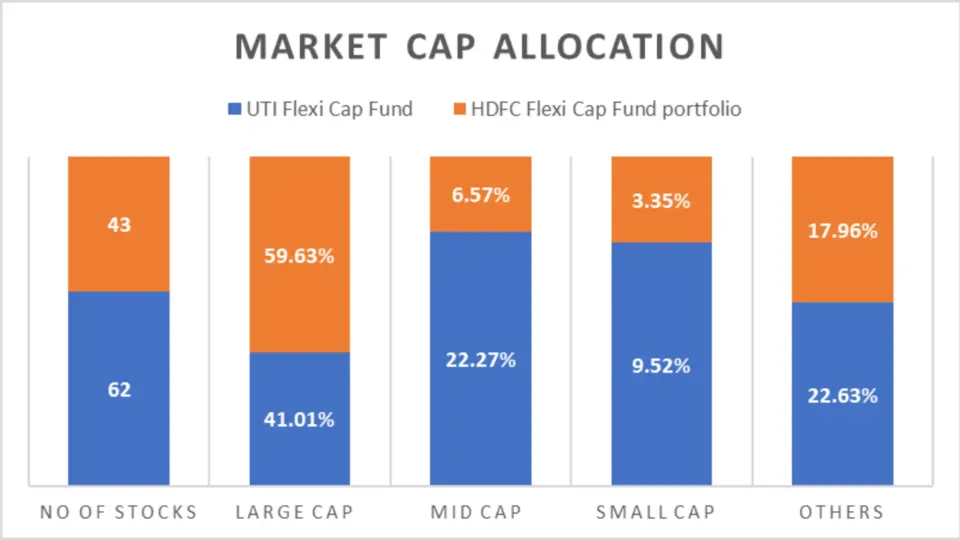
| Category | UTI Flexi Cap Fund | HDFC Flexi Cap Fund |
| No of Stocks | 62 | 43 |
| Large Cap | 41.01% | 59.63% |
| Mid Cap | 22.27% | 6.57% |
| Small Cap | 9.52% | 3.35% |
| Others | 22.63% | 17.96% |
Analysis:
- Number of Stocks: UTI holds more stocks (62) than HDFC (43), indicating greater diversification.
- Large Cap: HDFC has a higher large-cap allocation at 59.63%.
- Mid Cap and Small Cap: UTI has a higher allocation in mid-cap and small-cap stocks, suggesting more exposure to growth-oriented companies.
Key Takeaways:
- Diversification: UTI Flexi Cap Fund is more diversified regarding the number of stocks held.
- Growth Potential: UTI’s higher allocation to mid-cap and small-cap stocks indicates a focus on growth opportunities.
Sector Allocation
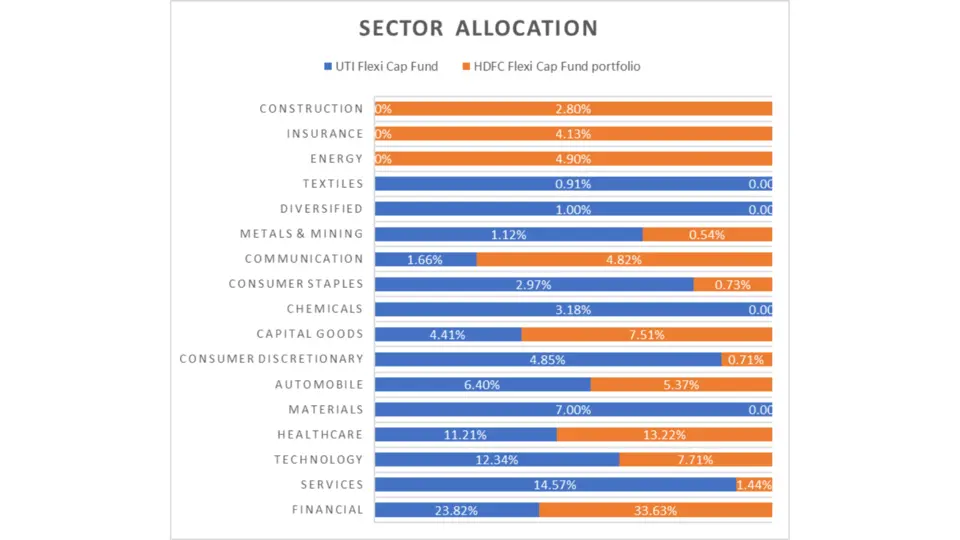
| Sector | UTI Flexi Cap Fund | HDFC Flexi Cap Fund |
| Financial | 23.82% | 33.63% |
| Services | 14.57% | 1.44% |
| Technology | 12.34% | 7.71% |
| Healthcare | 11.21% | 13.22% |
| Materials | 7.00% | NA |
| Automobile | 6.40% | 5.37% |
| Consumer Discretionary | 4.85% | 0.71% |
| Capital Goods | 4.41% | 7.51% |
| Chemicals | 3.18% | NA |
| Consumer Staples | 2.97% | 0.73% |
| Communication | 1.66% | 4.82% |
| Metals & Mining | 1.12% | 0.54% |
| Diversified | 1.00% | NA |
| Textiles | 0.91% | NA |
| Energy | NA | 4.90% |
| Insurance | NA | 4.13% |
| Construction | NA | 2.80% |
Analysis:
- Financial Sector: HDFC has a significantly higher allocation to financials at 33.63%.
- Technology and Healthcare: UTI has more balanced exposure across technology and healthcare sectors.
- Diversification: UTI holds investments across broader sectors, while HDFC has more concentrated sector bets.
Key Takeaways:
- Sector Exposure: UTI Flexi Cap Fund has broader sector exposure, potentially reducing sector-specific risk.
- Focused Bets: HDFC’s higher allocation to financials may benefit from solid performance in this sector but could be riskier if the sector underperforms.
Fund Management
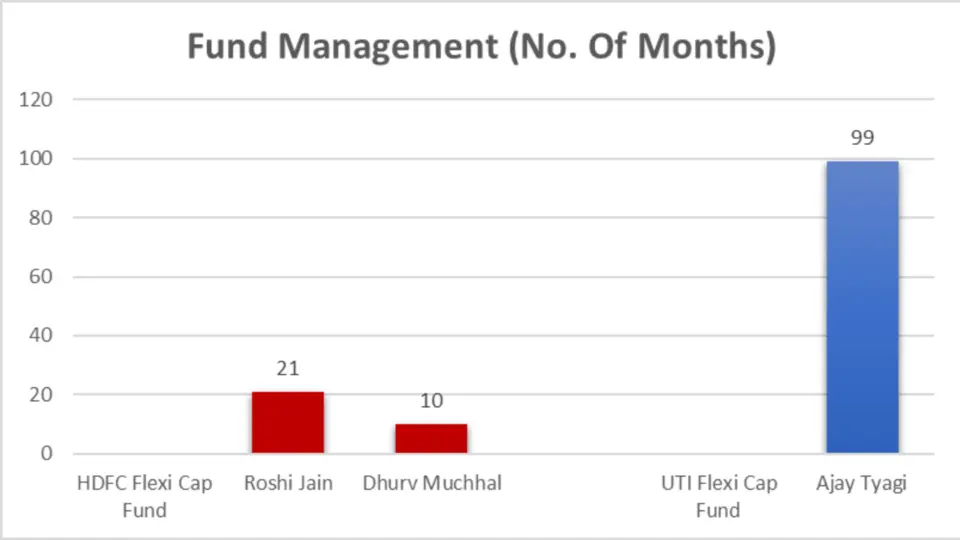
| Fund Manager | No. of Months |
| Roshi Jain | 21 |
| Dhurv Muchhal | 10 |
Fund Manager for UTI Flexi Cap Fund
| Fund Manager | No. of Months |
| Ajay Tyagi | 99 |
Analysis:
- HDFC Flexi Cap Fund:
- Roshi Jain: With 21 months at the helm, Roshi Jain brings a fresh perspective to the fund. Her relatively shorter tenure suggests she is still establishing her strategy and impact on the fund’s performance.
- Dhurv Muchhal: At 10 months, Dhurv Muchhal’s influence is even more recent. His decisions might still be in the early stages of showing their impact on the fund.
- UTI Flexi Cap Fund:
- Ajay Tyagi: With 99 months of managing the fund, Ajay Tyagi has a significant tenure. His long-term management suggests a stable strategy and a deep understanding of the fund’s performance and the market.
Key Takeaways:
- Experience: Ajay Tyagi’s 99 months with UTI Flexi Cap Fund provides a solid foundation of knowledge, likely contributing to consistent fund performance.
- Fresh Perspectives: HDFC Flexi Cap Fund benefits from newer perspectives with Roshi Jain and Dhurv Muchhal, which can be advantageous if they introduce innovative strategies.
General Fund Details
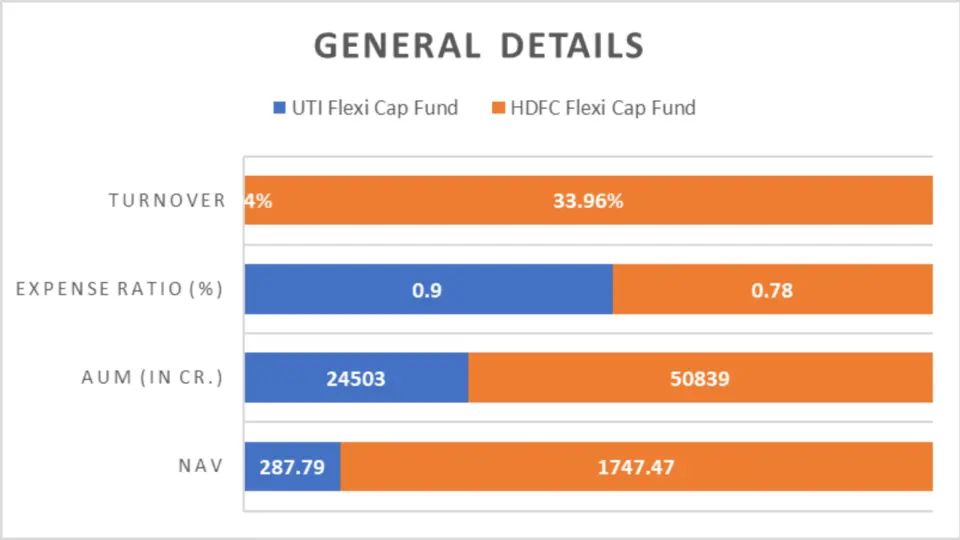
| Fund | NAV (₹) | AUM (in Cr.) | Expense Ratio (%) | Turnover (%) | Benchmark |
| UTI Flexi Cap Fund | 287.79 | 24,503 | 0.9 | 0.04 | NIFTY 500 |
| HDFC Flexi Cap Fund | 1,747.47 | 50,839 | 0.78 | 33.96 | NIFTY 500 |
Analysis:
- NAV: HDFC Flexi Cap Fund has a significantly higher NAV of ₹1,747.47 compared to UTI’s ₹287.79. This indicates a higher per-unit value for HDFC.
- AUM: HDFC also manages a more extensive asset base, with an AUM of ₹50,839 Cr., more than double UTI’s ₹24,503 Cr.
- Expense Ratio: HDFC Flexi Cap Fund has a lower expense ratio of 0.78%, making it more cost-efficient than UTI’s 0.9%.
- Turnover: UTI Flexi Cap Fund exhibits a minimal turnover of 0.04%, suggesting a more passive investment strategy than HDFC’s 33.96%.
Key Takeaways:
- Higher NAV and AUM: HDFC Flexi Cap Fund’s higher NAV and larger AUM indicate a substantial asset base and potentially greater investor confidence.
- Cost Efficiency: With a lower expense ratio, HDFC Flexi Cap Fund might appeal more to cost-conscious investors.
- Investment Strategy: UTI Flexi Cap Fund’s low turnover suggests a buy-and-hold strategy, while HDFC’s higher turnover indicates a more active management style.
Minimum Investment Amount

| Fund | SIP (₹) | Lumpsum (₹) |
| UTI Flexi Cap Fund | 500 | 5,000 |
| HDFC Flexi Cap Fund | 100 | 100 |
Analysis:
- SIP: HDFC Flexi Cap Fund allows for a lower SIP investment starting at ₹100, making it more accessible to smaller investors than UTI’s minimum SIP of ₹500.
- Lumpsum: HDFC Flexi Cap Fund also requires a significantly lower minimum lumpsum investment of ₹100, compared to UTI’s ₹5,000.
Key Takeaways:
- Accessibility: HDFC Flexi Cap Fund’s lower minimum investment requirements make it more accessible to a broader range of investors.
- Flexibility: Investors with smaller capital can start investing in HDFC Flexi Cap Fund with minimal financial commitment.
Conclusion
The HDFC Flexi Cap Fund emerges as the superior option across most performance metrics, including higher returns, better risk-adjusted performance, and superior alpha generation, making it the ideal choice for investors seeking robust growth and higher risk-adjusted returns.
However, the UTI Flexi Cap Fund offers better stability with lower volatility and a more experienced fund manager, making it a suitable choice for conservative investors with a lower risk appetite. Thus, investors with a higher risk tolerance and a focus on maximizing returns should consider the HDFC Flexi Cap Fund. In comparison, those seeking consistent performance with lower risk should lean towards the UTI Flexi Cap Fund.

FAQs- HDFC Flexi Cap Fund vs UTI Flexi Cap Fund
What are the investment styles of UTI Flexi Cap Fund and HDFC Flexi Cap Fund?
Both UTI Flexi Cap Fund and HDFC Flexi Cap Fund follow a growth-oriented investment style, aiming for capital appreciation over the long term.
Which fund has better-trailing returns?
HDFC Flexi Cap Fund consistently outperforms UTI Flexi Cap Fund across all periods, showing solid short-term growth with returns of 43.40% in 1 year and 25.47% in 2 years compared to UTI’s 22.05% and 7.04%, respectively.
How do the lumpsum investment values compare between the two funds?
HDFC Flexi Cap Fund delivers higher lumpsum investment values across all periods. For instance, a ₹10,000 investment in HDFC would be worth ₹14,353.90 in 1 year and ₹50,535.20 in 10 years, significantly outperforming UTI Flexi Cap Fund’s ₹12,211.60 and ₹39,443.80.
What is the volatility comparison between UTI Flexi Cap Fund and HDFC Flexi Cap Fund?
HDFC Flexi Cap Fund exhibits higher volatility over more extended periods. Its 10-year standard deviation is 19.06% compared to UTI’s 16.57%. However, in the short term (3 years), HDFC has slightly lower volatility at 13.04% compared to UTI’s 13.67%.
Which fund has better risk-adjusted performance?
HDFC Flexi Cap Fund offers better risk-adjusted returns across all periods, with higher Sortino and Treynor’s Ratios. For example, HDFC’s 3-year Sharpe Ratio is 1.52, compared to UTI’s 0.33.
How do the funds differ in terms of portfolio allocation?
UTI Flexi Cap Fund has higher equity exposure at 95.44% compared to HDFC’s 87.51%. UTI also holds more stocks (62 vs. HDFC’s 43) and has higher allocations in mid-cap and small-cap stocks, suggesting greater diversification.
What are the sector allocations of UTI Flexi Cap Fund and HDFC Flexi Cap Fund?
HDFC Flexi Cap Fund provides superior SIP returns. Over 1 year, it yielded 38.86%, compared to UTI’s 12.82%. This trend continues across all periods, with HDFC showing higher returns even in the long term.
How do the fund managers compare?
Ajay Tyagi has managed UTI Flexi Cap Fund for 99 months, offering stability and experience. HDFC Flexi Cap Fund, managed by Roshi Jain and Dhurv Muchhal, brings fresh perspectives with shorter tenures of 21 and 10 months, respectively.
What are the general fund details for each fund?vvvvvvv
HDFC Flexi Cap Fund has a higher NAV of ₹1,747.47 and a larger AUM of ₹50,839 Cr., compared to UTI’s ₹287.79 NAV and ₹24,503 Cr. AUM. HDFC also has a lower expense ratio of 0.78% versus UTI’s 0.9%.
What are the minimum investment amounts for each fund?
HDFC Flexi Cap Fund allows for a lower minimum SIP and lumpsum investment, starting at ₹100, making it more accessible than UTI Flexi Cap Fund’s ₹500 SIP and ₹5,000 lumpsum minimums.
Disclaimer:
The information provided in this article is solely the author/advertisers’ opinion and not investment advice – it is provided for educational purposes only. Using this, you agree that the information does not constitute any investment or financial instructions by Ace Equity Research/Mutual Fund Focus/IPO First and the team. Anyone wishing to invest should seek their own independent financial or professional advice. Conduct your research with registered financial advisors before making any investment decisions. Ace Equity Research/ Mutual Fund Focus / IPO First and the team are not accountable for the investment views provided in the article.
Mutual Fund investments are subject to market risks. Read all scheme-related documents carefully.
Investments in the securities market are subject to market risks. Read all the related documents carefully before investing