Are you ready to dive into the exciting world of mutual funds, particularly multi-asset funds? If you are, buckle up because we’re about to embark on a journey to unravel the differences between two big names in this arena: ICICI Prudential Multi-Asset Fund vs Quant Multi-Asset Fund. In this detailed comparison, we’ll dissect these funds from every angle imaginable to help you navigate the complex terrain of investment and choose the best option for your financial aspirations. Let’s jump right in!
Investment Style
Regarding investment style, both ICICI Prudential Multi-Asset Fund and Quant Multi-Asset Fund follow a growth-oriented approach. This means they primarily seek capital appreciation over the long term rather than focusing on generating income through dividends.

Returns Analysis
Let’s delve into the returns analysis to gauge the performance of these funds over different time horizons.
Trailing Returns

Trailing Returns (NAV as of 28th March 2024)
| Period Invested for | ICICI Prudential Multi-Asset Fund | Quant Multi-Asset Fund |
| 1 Year | 33.16% | 49.32% |
| 2 Year | 21.12% | 24.21% |
| 3 Year | 25.43% | 31.05% |
| 5 Year | 19.91% | 29.73% |
| 10 Year | 17.07% | 17.65% |
Analysis:
- 1-Year Returns: Quant Multi-Asset Fund outperformed ICICI Prudential Multi-Asset Fund with a return of 49.32% compared to 33.16%.
- 2-Year Returns: Both funds displayed positive returns, with Quant Multi-Asset Fund marginally ahead at 24.21% compared to 21.12% for ICICI Prudential Multi-Asset Fund.
- 3-Year Returns: Quant Multi-Asset Fund maintained its lead with a return of 31.05% against ICICI Prudential Multi-Asset Fund’s 25.43%.
- 5-Year Returns: Quant Multi-Asset Fund exhibited superior performance over the 5 years, yielding 29.73% returns versus ICICI Prudential Multi-Asset Fund’s 19.91%.
- 10-Year Returns: Over a decade, both funds delivered consistent returns, with Quant Multi-Asset Fund slightly edging out ICICI Prudential Multi-Asset Fund by 0.58%.
Lumpsum Investment Value
Moving on to lumpsum investment values, let’s see how the NAVs (Net Asset Values) compare for different investment durations.

Lumpsum Investment Value (NAV as of 28th March 2024)
| Period Invested for | ICICI Prudential Multi-Asset Fund | Quant Multi-Asset Fund |
| 1 Year | 13357.4 | 14997.9 |
| 2 Year | 14702.1 | 15465.8 |
| 3 Year | 19746.6 | 22523.6 |
| 5 Year | 24809.9 | 36794.7 |
| 10 Year | 48434.1 | 50862.8 |
Analysis:
- 1-Year Lumpsum Investment Value: Quant Multi-Asset Fund exhibited a higher NAV of ₹14,997.9 compared to ₹13,357.4 for ICICI Prudential Multi-Asset Fund, indicating potentially better returns on investment.
- 2-Year Lumpsum Investment Value: The trend continued with Quant Multi-Asset Fund maintaining a higher NAV at ₹15,465.8 versus ₹14,702.1 for ICICI Prudential Multi-Asset Fund.
- 3-Year Lumpsum Investment Value: Quant Multi-Asset Fund again showcased a superior NAV of ₹22,523.6, outperforming ICICI Prudential Multi-Asset Fund, which stood at ₹19,746.6.
- 5-Year Lumpsum Investment Value: Quant Multi-Asset Fund demonstrated a significantly higher NAV of ₹36,794.7, indicating substantial growth compared to ICICI Prudential Multi-Asset Fund’s NAV of ₹24,809.9.
- 10-Year Lumpsum Investment Value: Both funds displayed robust growth over a decade, with Quant Multi-Asset Fund marginally ahead at ₹50,862.8, slightly surpassing ICICI Prudential Multi-Asset Fund’s NAV of ₹48,434.1.
Key Takeaways:
- Quant Multi-Asset Fund consistently outperforms ICICI Prudential Multi-Asset Fund across various time horizons regarding trailing returns.
- While both funds follow a growth investment style, Quant Multi-Asset Fund demonstrates higher returns and lumpsum investment values, indicating potentially better capital appreciation.
- Investors seeking higher returns and growth potential may find Quant Multi-Asset Fund more appealing. At the same time, those prioritizing stability might opt for the ICICI Prudential Multi-Asset Fund.
SIP Returns
Let’s delve into the SIP returns analysis for different investment durations.

SIP RETURNS (NAV as of 28th March 2024)
| Period Invested for | ICICI Prudential Multi-Asset Fund | Quant Multi-Asset Fund |
| 1 Year | 34.54% | 60.77% |
| 2 Year | 28.40% | 39.55% |
| 3 Year | 24.78% | 31.33% |
| 5 Year | 24.95% | 33.51% |
| 10 Year | 18.13% | 22.39% |
Analysis:
- 1-Year SIP Returns: Quant Multi-Asset Fund outperformed ICICI Prudential Multi-Asset Fund with an impressive return of 60.77% compared to 34.54%.
- 2-Year SIP Returns: Quant Multi-Asset Fund continued to lead with a return of 39.55%, surpassing ICICI Prudential Multi-Asset Fund’s 28.40%.
- 3-Year SIP Returns: While both funds delivered positive returns, Quant Multi-Asset Fund maintained its lead with a return of 31.33% against ICICI Prudential Multi-Asset Fund’s 24.78%.
- 5-Year SIP Returns: Quant Multi-Asset Fund showcased better performance over the 5 years, yielding 33.51% returns versus ICICI Prudential Multi-Asset Fund’s 24.95%.
- 10-Year SIP Returns: Over a decade, both funds demonstrated consistent returns, with Quant Multi-Asset Fund slightly ahead at 22.39%, surpassing ICICI Prudential Multi-Asset Fund’s 18.13%.
SIP Investment Value
Now, let’s explore the SIP investment values for different investment durations.

SIP Investment Value (NAV as of 28th March 2024)
| Period Invested for | Investments | ICICI Prudential Multi-Asset Fund | Quant Multi-Asset Fund |
| 1 Year | 12000 | 14146.31 | 15670.49 |
| 2 Year | 24000 | 31470.36 | 34600.44 |
| 3 Year | 36000 | 51579.98 | 56342.98 |
| 5 Year | 60000 | 111251.15 | 136293.34 |
| 10 Year | 120000 | 311389.07 | 392099.32 |
Analysis:
- 1-Year SIP Investment Value: With an initial investment of ₹12,000, Quant Multi-Asset Fund yielded higher returns, resulting in a SIP value of ₹15,670.49 compared to ₹14,146.31 for ICICI Prudential Multi-Asset Fund.
- 2-Year SIP Investment Value: The trend continued with Quant Multi-Asset Fund providing a higher SIP value of ₹34,600.44 compared to ₹31,470.36 for ICICI Prudential Multi-Asset Fund.
- 3-Year SIP Investment Value: Quant Multi-Asset Fund again showcased better growth, resulting in a SIP value of ₹56,342.98, surpassing ICICI Prudential Multi-Asset Fund’s SIP value of ₹51,579.98.
- 5-Year SIP Investment Value: Quant Multi-Asset Fund demonstrated substantial growth over the 5 years, reaching a SIP value of ₹1,36,293.34, outperforming ICICI Prudential Multi-Asset Fund’s SIP value of ₹1,11,251.15.
- 10-Year SIP Investment Value: Both funds displayed commendable growth over a decade, with Quant Multi-Asset Fund yielding a higher SIP value of ₹3,92,099.32, slightly surpassing ICICI Prudential Multi-Asset Fund’s SIP value of ₹3,11,389.07.
Key Takeaways:
- Quant Multi-Asset Fund consistently outperforms ICICI Prudential Multi-Asset Fund across various SIP investment durations, showcasing higher returns.
- Investors seeking higher SIP returns and potential wealth accumulation may find Quant Multi-Asset Fund more appealing.
- However, it’s essential to consider your risk acceptance and investment objectives.
CAGR Analysis
The Compound Annual Growth Rate (CAGR) reflects the mean annual growth rate of an investment over a stated period. Here’s a comparison of the CAGR for ICICI Prudential Multi-Asset Fund and Quant Multi-Asset Fund:

| Category | ICICI Prudential Multi-Asset Fund | Quant Multi-Asset Fund |
| 1 Y | 33.51% | 45.59% |
| 3 Y | 25.08% | 33.30% |
| 5 Y | 19.62% | 28.52% |
| 9 Y | 15.32% | 18.24% |
Analysis:
- 1-Year CAGR: Quant Multi-Asset Fund exhibits a higher CAGR of 45.59%, outperforming ICICI Prudential Multi-Asset Fund’s CAGR of 33.51%.
- 3-Year CAGR: Quant Multi-Asset Fund continues to lead with a CAGR of 33.30%, surpassing ICICI Prudential Multi-Asset Fund’s CAGR of 25.08%.
- 5-Year CAGR: Quant Multi-Asset Fund showcases superior performance with a CAGR of 28.52% compared to ICICI Prudential Multi-Asset Fund’s CAGR of 19.62%.
- 9-Year CAGR: Over a longer horizon, Quant Multi-Asset Fund maintains its lead with a CAGR of 18.24%, slightly ahead of ICICI Prudential Multi-Asset Fund’s CAGR of 15.32%.
Rolling Returns Analysis
Rolling Returns provide a more comprehensive view of a fund’s performance by measuring the average annual Return over consecutive periods. Let’s compare the Rolling Returns of ICICI Prudential Multi-Asset Fund and Quant Multi-Asset Fund:
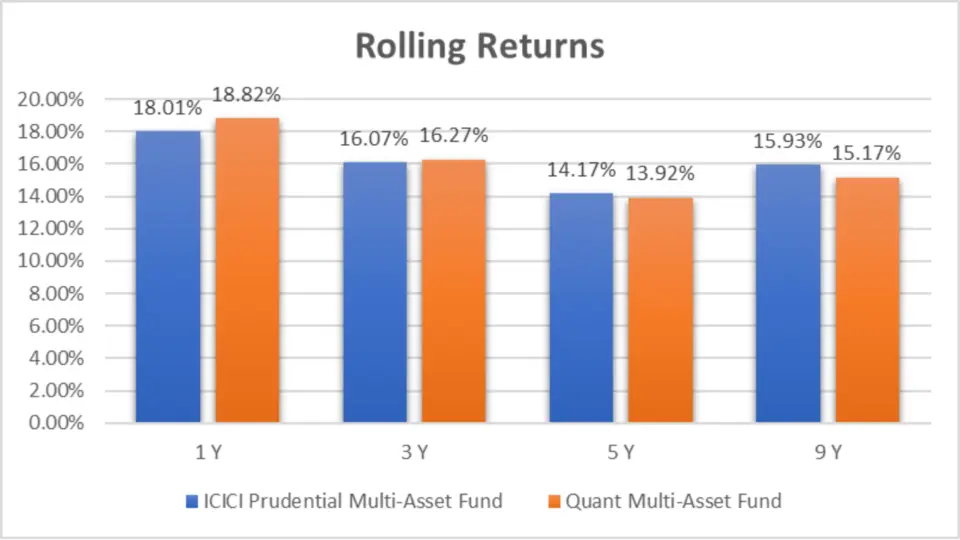
| Category | ICICI Prudential Multi-Asset Fund | Quant Multi-Asset Fund |
| 1 Y | 18.01% | 18.82% |
| 3 Y | 16.07% | 16.27% |
| 5 Y | 14.17% | 13.92% |
| 9 Y | 15.93% | 15.17% |
Analysis:
- 1-Year Rolling Returns: Quant Multi-Asset Fund demonstrates slightly higher Rolling Returns of 18.82% compared to ICICI Prudential Multi-Asset Fund’s 18.01%.
- 3-Year Rolling Returns: Both funds exhibit consistent performance, with Quant Multi-Asset Fund slightly edging out ICICI Prudential Multi-Asset Fund by 0.20%.
- 5-Year Rolling Returns: ICICI Prudential Multi-Asset Fund showcases marginally better Rolling Returns of 14.17% compared to Quant Multi-Asset Fund’s 13.92%.
- 9-Year Rolling Returns: Quant Multi-Asset Fund and ICICI Prudential Multi-Asset Fund display comparable performance over 9 years, with Quant Multi-Asset Fund’s Rolling Returns at 15.17% and ICICI Prudential Multi-Asset Fund’s Rolling Returns at 15.93%.
Key Takeaways:
- Quant Multi-Asset Fund demonstrates higher CAGR across all time horizons than ICICI Prudential Multi-Asset Fund, indicating better growth potential.
- While Quant Multi-Asset Fund generally exhibits slightly higher Rolling Returns, both funds display consistent performance over different periods.
- Investors seeking higher growth potential may find Quant Multi-Asset Fund more appealing. At the same time, those prioritizing stability might opt for the ICICI Prudential Multi-Asset Fund.
Annualized/Calendar Year Returns
Let’s examine the annual returns of both funds over the past several years:

| Period | ICICI Prudential Multi-Asset Fund | Quant Multi-Asset Fund |
| 2023 | 25.19% | 23.86% |
| 2022 | 17.61% | 15.28% |
| 2021 | 33.81% | 55.32% |
| 2020 | 10.42% | 27.60% |
| 2019 | 7.97% | 11.41% |
| 2018 | -0.86% | 3.84% |
| 2017 | 29.37% | 1.99% |
Analysis:
- 2023: ICICI Prudential Multi-Asset Fund delivered a return of 25.19%, slightly surpassing Quant Multi-Asset Fund’s Return of 23.86%.
- 2022: Both funds exhibited positive returns, with ICICI Prudential Multi-Asset Fund at 17.61% and Quant Multi-Asset Fund at 15.28%.
- 2021: Quant Multi-Asset Fund outperformed with a substantial return of 55.32%, while ICICI Prudential Multi-Asset Fund yielded a commendable return of 33.81%.
- 2020: Quant Multi-Asset Fund showcased superior performance with a return of 27.60%, compared to ICICI Prudential Multi-Asset Fund’s Return of 10.42%.
- 2019: Quant Multi-Asset Fund again outperformed with a return of 11.41%, while ICICI Prudential Multi-Asset Fund delivered a return of 7.97%.
- 2018: Both funds experienced positive returns, but Quant Multi-Asset Fund performed better at 3.84% compared to ICICI Prudential Multi-Asset Fund’s -0.86%.
- 2017: ICICI Prudential Multi-Asset Fund significantly outperformed with a return of 29.37%, while Quant Multi-Asset Fund yielded a return of 1.99%.
No. of Times Outperformance
Considering the number of times, each fund outperformed the other:
| Fund | No. of times Outperformance |
| ICICI Prudential Multi-Asset Fund | 3 |
| Quant Multi-Asset Fund | 4 |
Key Takeaways:
- Quant Multi-Asset Fund outperformed ICICI Prudential Multi-Asset Fund in terms of annual returns for most years, indicating its potential for higher growth.
- However, ICICI Prudential Multi-Asset Fund performed better in specific years, showcasing its resilience and ability to capitalize on market opportunities.
- Quant Multi-Asset Fund experienced more outperformance, suggesting it consistently delivers superior returns compared to ICICI Prudential Multi-Asset Fund.
Quarterly Results
Explore the quarterly returns of both funds over the past few years:
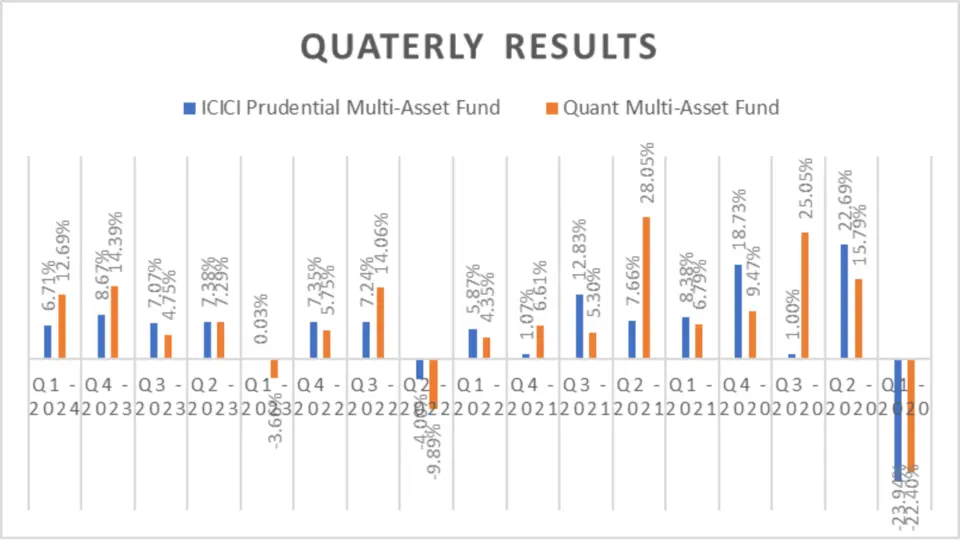
Quarterly Results (NAV as of 28th March 2024)
| Period | ICICI Prudential Multi-Asset Fund | Quant Multi-Asset Fund |
| Q1 – 2024 | 6.71% | 12.69% |
| Q4 – 2023 | 8.67% | 14.39% |
| Q3 – 2023 | 7.07% | 4.75% |
| Q2 – 2023 | 7.38% | 7.29% |
| Q1 – 2023 | 0.03% | -3.66% |
| Q4 – 2022 | 7.35% | 5.75% |
| Q3 – 2022 | 7.24% | 14.06% |
| Q2 – 2022 | -4.00% | -9.89% |
| Q1 – 2022 | 5.87% | 4.35% |
| Q4 – 2021 | 1.07% | 6.61% |
| Q3 – 2021 | 12.83% | 5.30% |
| Q2 – 2021 | 7.66% | 28.05% |
| Q1 – 2021 | 8.38% | 6.79% |
| Q4 – 2020 | 18.73% | 9.47% |
| Q3 – 2020 | 1.00% | 25.05% |
| Q2 – 2020 | 22.69% | 15.79% |
| Q1 – 2020 | -23.94% | -22.40% |
Analysis:
- Q1 – 2024: Quant Multi-Asset Fund showcased a higher return of 12.69% compared to ICICI Prudential Multi-Asset Fund’s Return of 6.71%.
- Q4 – 2023: Quant Multi-Asset Fund outperformed again with a return of 14.39%, surpassing ICICI Prudential Multi-Asset Fund’s Return of 8.67%.
- Q3 – 2023: ICICI Prudential Multi-Asset Fund delivered a return of 7.07%, while Quant Multi-Asset Fund yielded a return of 4.75%.
- Q2 – 2023: Both funds demonstrated positive returns, with ICICI Prudential Multi-Asset Fund at 7.38% and Quant Multi-Asset Fund at 7.29%.
- Q1 – 2023: ICICI Prudential Multi-Asset Fund barely saw positive returns at 0.03%, whereas Quant Multi-Asset Fund incurred a slight loss at -3.66%.
- Q4 – 2022: ICICI Prudential Multi-Asset Fund showcased a return of 7.35%, slightly outperforming Quant Multi-Asset Fund’s Return of 5.75%.
Outperformance
Assessing the number of times each fund outperformed the other:
| Fund | Outperformance |
| ICICI Prudential Multi-Asset Fund | 10 |
| Quant Multi-Asset Fund | 7 |
Risk Analysis
Maximum Drawdown
Let’s explore the Maximum Drawdown for both funds over different time horizons:
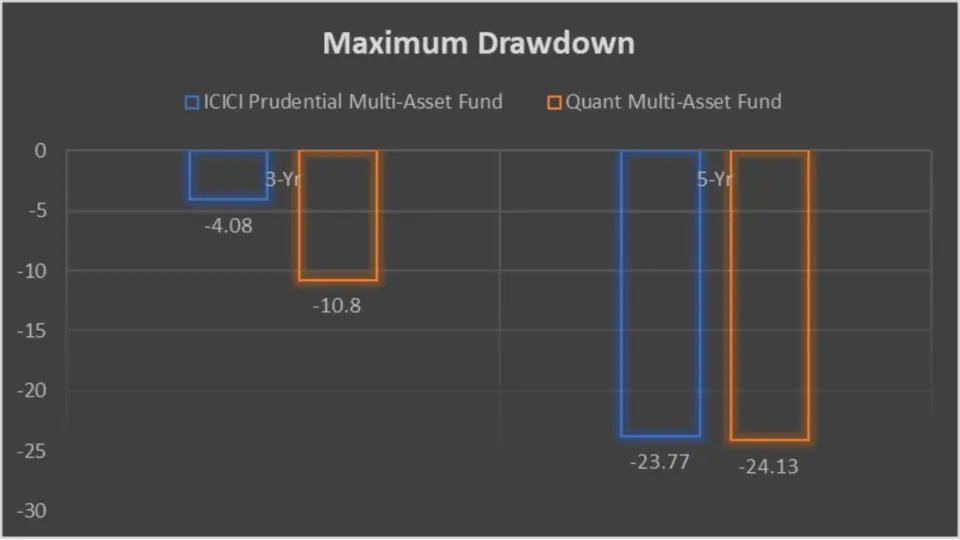
| Category | ICICI Prudential Multi-Asset Fund | Quant Multi-Asset Fund |
| 3-Yr | -4.08 | -10.8 |
| 5-Yr | -23.77 | -24.13 |
Key Takeaways:
- While Quant Multi-Asset Fund showcased higher returns, it also experienced more significant drawdowns, highlighting the importance of risk management and volatility in investment decisions.
Mean Return, Sortino Ratio, and Treynor’s Ratio
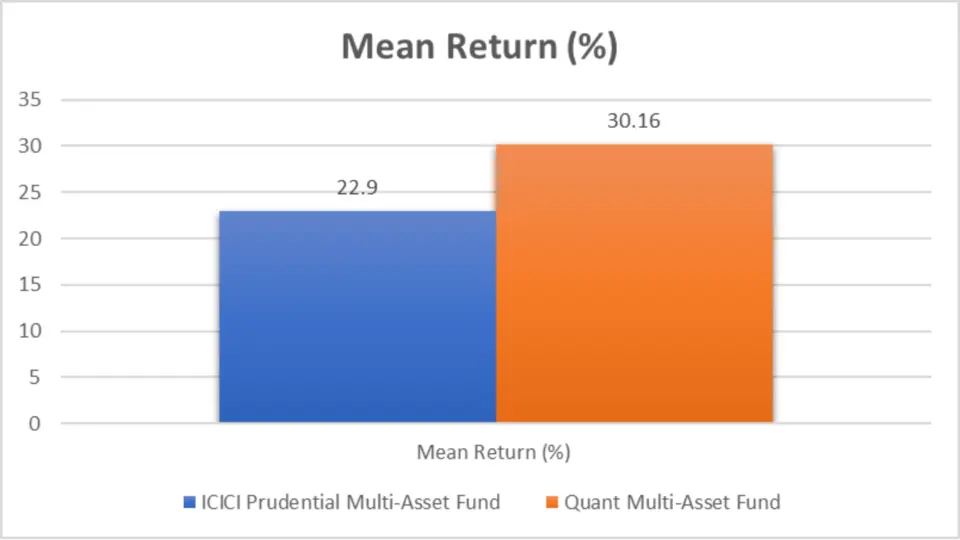
Now, let’s delve into the risk analysis of both funds based on Mean Return, Sortino Ratio, and Treynor’s Ratio:
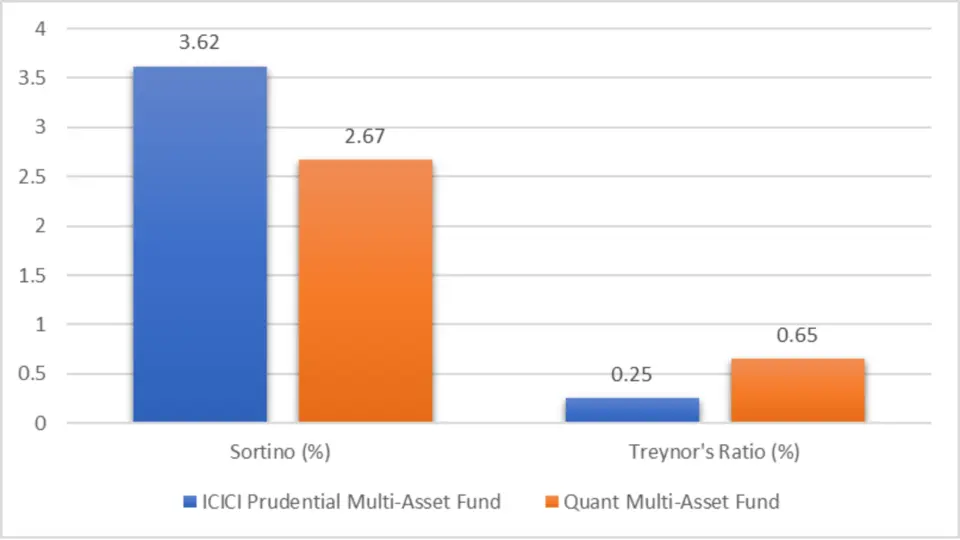
| Category | ICICI Prudential Multi-Asset Fund | Quant Multi-Asset Fund |
| Mean Return (%) | 22.9 | 30.16 |
| Sortino (%) | 3.62 | 2.67 |
| Treynor’s Ratio (%) | 0.25 | 0.65 |
Key Takeaways:
- Quant Multi-Asset Fund has consistently outperformed ICICI Prudential Multi-Asset Fund’s quarterly returns recently, indicating its potential for higher growth.
- However, ICICI Prudential Multi-Asset Fund performed better in certain quarters, showcasing its resilience and ability to navigate market challenges.
- Despite ICICI Prudential Multi-Asset Fund’s higher number of outperformance instances, Quant Multi-Asset Fund exhibited a superior Mean Return and higher Sortino and Treynor’s Ratios, suggesting potentially better risk-adjusted returns.
- Investors should consider these funds’ historical performance and risk analysis to make informed investment decisions aligned with their financial goals and risk tolerance.
Standard Deviation
Standard Deviation shows the volatility or risk of a fund’s returns over a specific period. Here’s a comparison of the standard Deviation for both funds over 3 years
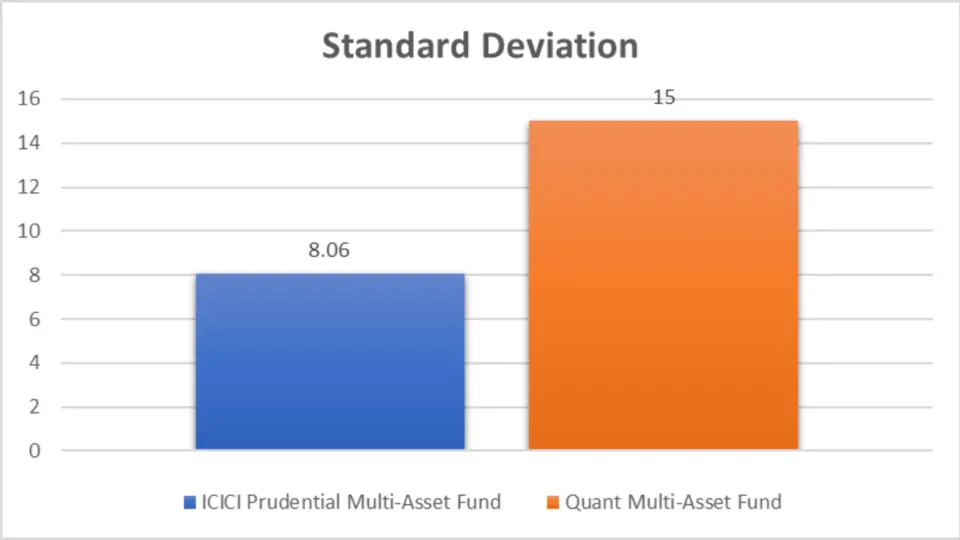
| Category | ICICI Prudential Multi-Asset Fund | Quant Multi-Asset Fund |
| Std Dev (%) 3Y | 8.06 | 15 |
Analysis:
- ICICI Prudential Multi-Asset Fund: With a standard deviation of 8.06%, this fund exhibits relatively lower volatility in its returns over the past 3 years.
- Quant Multi-Asset Fund: On the other hand, Quant Multi-Asset Fund has a higher standard deviation of 15%, indicating greater volatility in its returns compared to ICICI Prudential Multi-Asset Fund.
Sharpe Ratio
The Sharpe ratio indicates the risk-adjusted Return of an investment relative to its volatility. Let’s compare the Sharpe ratio of both funds over 3 years:
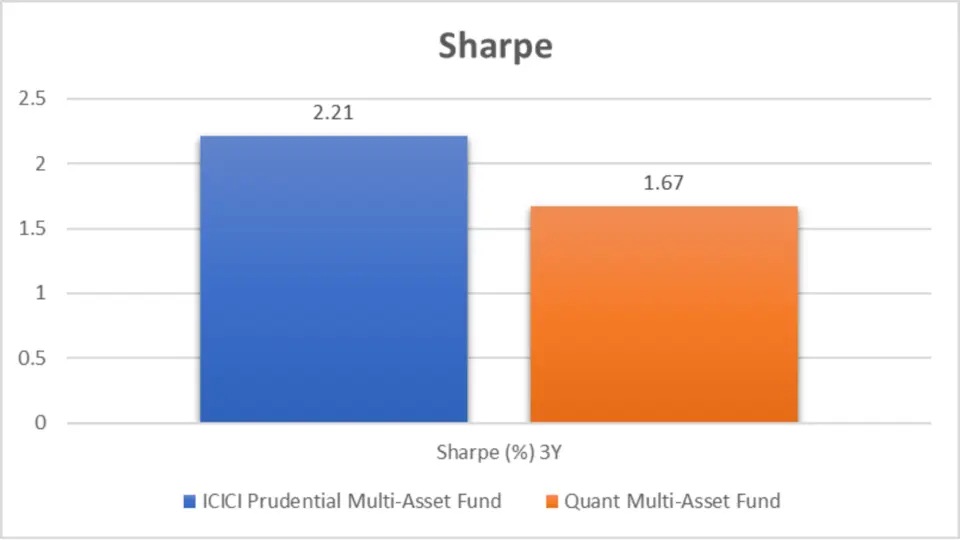
Sharpe Ratio
| Category | ICICI Prudential Multi-Asset Fund | Quant Multi-Asset Fund |
| Sharpe (%) 3Y | 2.21 | 1.67 |
Analysis:
- ICICI Prudential Multi-Asset Fund: With a Sharpe ratio 2.21, this fund offers a higher risk-adjusted return than Quant Multi-Asset Fund.
- Quant Multi-Asset Fund: The Sharpe ratio of 1.67 suggests a lower risk-adjusted return for Quant Multi-Asset Fund relative to its volatility.
Beta
Beta measures the sensitivity and volatility of a fund’s returns to market movements. Let’s compare the beta of both funds over 3 years
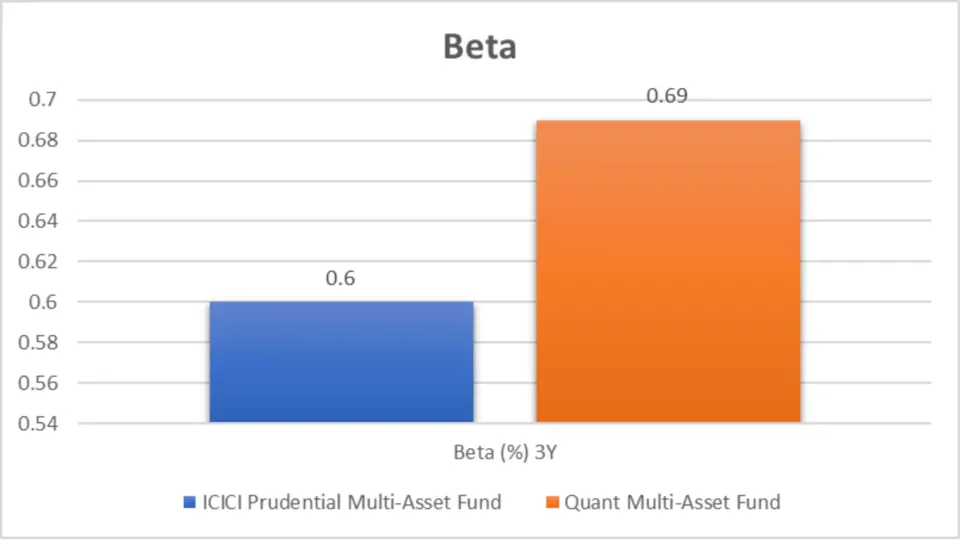
| Category | ICICI Prudential Multi-Asset Fund | Quant Multi-Asset Fund |
| Beta (%) 3Y | 0.6 | 0.69 |
Analysis:
- ICICI Prudential Multi-Asset Fund: With a beta of 0.6, this fund is less sensitive to market movements than Quant Multi-Asset Fund.
- Quant Multi-Asset Fund: The beta of 0.69 indicates that Quant Multi-Asset Fund is slightly more sensitive to market movements than ICICI Prudential Multi-Asset Fund.
Key Takeaways:
- ICICI Prudential Multi-Asset Fund exhibits a lower standard Deviation, indicating relatively lower volatility in its returns than Quant Multi-Asset Fund.
- The Sharpe ratio of ICICI Prudential Multi-Asset Fund is higher, suggesting better risk-adjusted returns relative to its volatility than Quant Multi-Asset Fund.
- ICICI Prudential Multi-Asset Fund has a lower beta, indicating less sensitivity to market movements than Quant Multi-Asset Fund.
Alpha
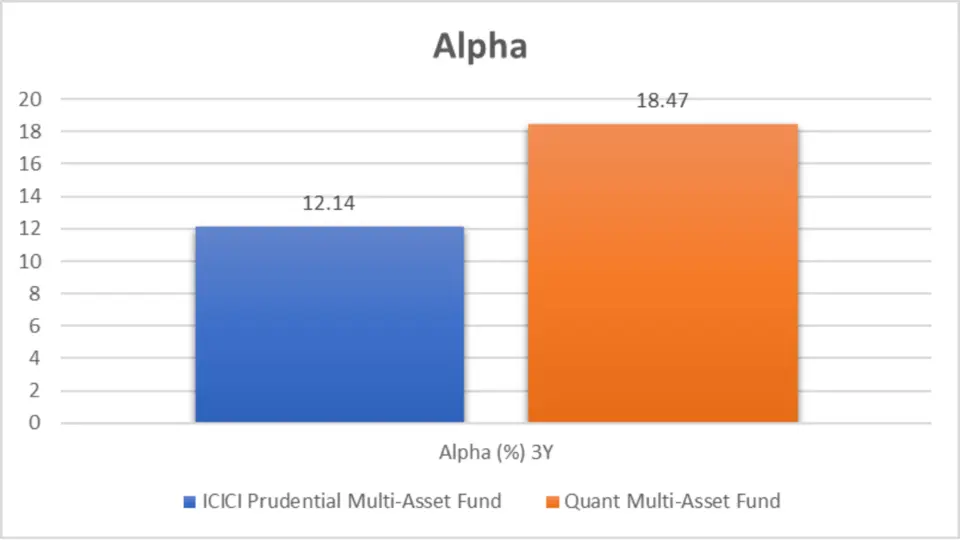
Alpha measures the surplus Return of a fund comparative to its benchmark index, in this case, the Nifty 50. Here’s a comparison of the Alpha for both funds over 3 years
| Category | ICICI Prudential Multi-Asset Fund | Quant Multi-Asset Fund |
| Alpha (%) 3Y | 12.14 | 18.47 |
Analysis:
- ICICI Prudential Multi-Asset Fund: With an Alpha of 12.14%, this fund has outperformed the Nifty 50 index by generating positive excess returns over the past 3 years.
- Quant Multi-Asset Fund: Quant Multi-Asset Fund exhibits a higher Alpha of 18.47%, indicating even stronger outperformance relative to the Nifty 50 index than ICICI Prudential Multi-Asset Fund.
Key Takeaways:
- Both ICICI Prudential Multi-Asset Fund and Quant Multi-Asset Fund have generated positive Alpha relative to the Nifty 50 index, indicating their ability to outperform the benchmark.
- Quant Multi-Asset Fund exhibits a higher Alpha, suggesting more robust performance than ICICI Prudential Multi-Asset Fund over the past 3 years.
Portfolio Analysis
Portfolio Overlapping
Understanding the degree of portfolio overlap between funds is crucial for diversification. Let’s compare the portfolio overlap percentage between ICICI Prudential Multi-Asset Fund and Quant Multi-Asset Fund:

Portfolio Overlap
| Category | ICICI Prudential Multi-Asset Fund | Quant Multi-Asset Fund |
| Portfolio Overlap Total % | 3.91 | 12.48 |
Analysis:
- ICICI Prudential Multi-Asset Fund: The portfolio overlap with the Nifty 50 index is relatively low at 3.91%, indicating a diversified portfolio with minimal correlation to the index.
- Quant Multi-Asset Fund: On the other hand, Quant Multi-Asset Fund has a higher portfolio overlap of 12.48% with the Nifty 50 index, suggesting a more significant correlation between its holdings and the index compared to ICICI Prudential Multi-Asset Fund.
Key Takeaways:
- ICICI Prudential Multi-Asset Fund maintains a lower portfolio overlap with the Nifty 50 index, offering potential diversification benefits for investors seeking exposure beyond the index constituents.
- Conversely, Quant Multi-Asset Fund has a higher portfolio overlap, which may result in a higher correlation with the Nifty 50 index and potentially higher risk.
Asset Allocation
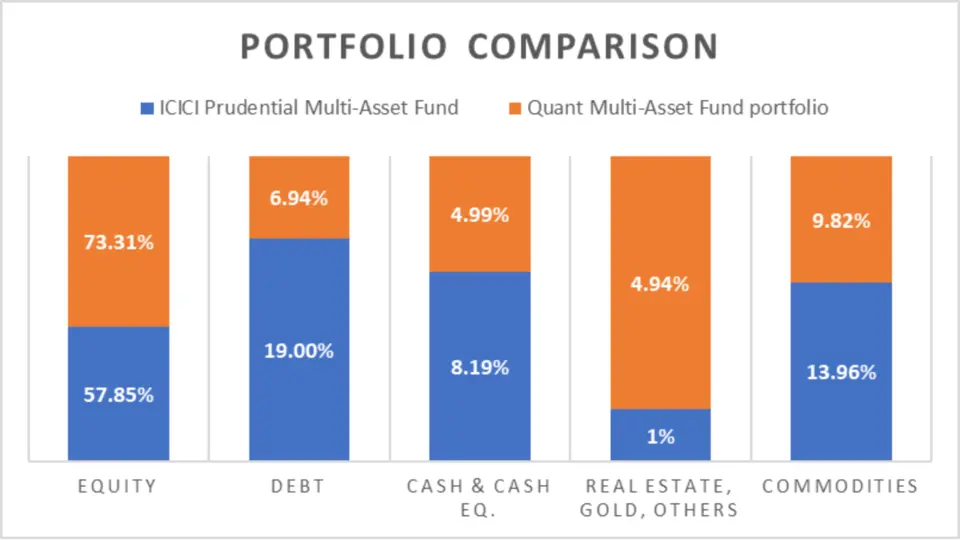
The allocation of assets across various categories provides insights into the diversification strategy employed by each fund. Here’s a comparison of the portfolio composition of ICICI Prudential Multi-Asset Fund and Quant Multi-Asset Fund:
Portfolio Comparison
| Category | ICICI Prudential Multi-Asset Fund | Quant Multi-Asset Fund |
| Equity | 57.85% | 73.31% |
| Debt | 19.00% | 6.94% |
| Cash & Cash Eq. | 8.19% | 4.99% |
| Real Estate, Gold, Others | 1% | 4.94% |
| Commodities | 13.96% | 9.82% |
Analysis:
- ICICI Prudential Multi-Asset Fund: This fund maintains a diversified portfolio with significant allocations to equity (57.85%) and debt (19.00%), providing exposure to growth-oriented and fixed-income securities. It also allocates a small portion to cash & cash equivalents (8.19%) and commodities (13.96%).
- Quant Multi-Asset Fund: Quant Multi-Asset Fund exhibits a higher concentration in equity (73.31%), suggesting a more aggressive growth-oriented strategy. It allocates a smaller portion to debt (6.94%) and holds a comparable amount in cash & cash equivalents (4.99%). Additionally, it has significant exposure to real estate, gold, and other alternative assets (4.94%).
Market Cap Allocation
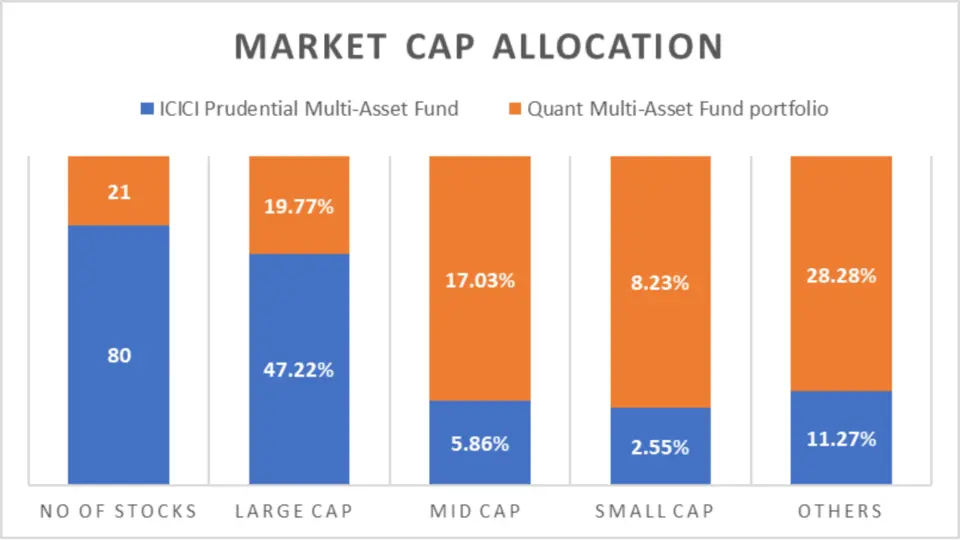
Understanding the distribution of investments across different market capitalizations can provide insights into each fund’s risk-return profile and investment style. Let’s compare the market cap allocation of ICICI Prudential Multi-Asset Fund and Quant Multi-Asset Fund
Market Cap Allocation
| Category | ICICI Prudential Multi-Asset Fund | Quant Multi-Asset Fund portfolio |
| No of Stocks | 80 | 21 |
| Large Cap | 47.22% | 19.77% |
| Mid Cap | 5.86% | 17.03% |
| Small Cap | 2.55% | 8.23% |
| Others | 11.27% | 28.28% |
Analysis:
- ICICI Prudential Multi-Asset Fund: With investments in a broader range of stocks (80), this fund has a relatively balanced allocation across large-cap (47.22%), mid-cap (5.86%), and small-cap (2.55%) companies. It also holds a portion of its portfolio in other categories (11.27%).
- Quant Multi-Asset Fund: Quant Multi-Asset Fund has a more concentrated portfolio with investments in fewer stocks (21). It allocates a smaller portion to large-cap stocks (19.77%) but has a higher exposure to mid-cap (17.03%) and small-cap (8.23%) companies. Additionally, it holds a significant portion in other categories (28.28%).
Key Takeaways:
- ICICI Prudential Multi-Asset Fund maintains a diversified portfolio across equity, debt, cash, and commodities, providing a balanced approach to risk and Return.
- Quant Multi-Asset Fund exhibits a more aggressive growth-oriented strategy with a higher allocation to equity, particularly in mid-cap and small-cap stocks and alternative assets.
- Investors should consider their risk acceptance and investment objectives when choosing between these funds, as their portfolio compositions and market cap allocations differ significantly.
Sector Allocation
Understanding the sector-wise distribution of investments can provide valuable insights into the diversification strategy and risk exposure of each fund. Here’s a comparison of the sector allocation of ICICI Prudential Multi-Asset Fund and Quant Multi-Asset Fund:

Sector Allocation
| Category | ICICI Prudential Multi-Asset Fund | Quant Multi-Asset Fund portfolio |
| Financial | 16.35% | 17.72% |
| Energy | 10.28% | 21.25% |
| Automobile | 5.31% | NA |
| Services | 4.08% | 1.98% |
| Technology | 3.39% | 3.55% |
| Healthcare | 3.38% | 7.21% |
| Consumer Staples | 2.80% | 2.66% |
| Insurance | 2.40% | 1.60% |
| Communication | 2.31% | NA |
| Materials | 2.22% | 2.44% |
| Metals & Mining | 2.16% | 10.21% |
| Construction | 1.53% | 2.24% |
| Chemicals | 1.07% | NA |
| Capital Goods | 0.66% | 2.45% |
Analysis:
- ICICI Prudential Multi-Asset Fund exhibits a diversified sector allocation, with significant investments in the financials (16.35%) and energy (10.28%) sectors. It also holds notable positions in sectors like automobile, technology, and healthcare, providing exposure to various segments of the economy.
- Quant Multi-Asset Fund: Quant Multi-Asset Fund shows a different sector allocation, with a higher emphasis on the energy sector (21.25%). It also allocates substantial portions to metals & mining and healthcare sectors, indicating a more focused investment approach.
Star Ratings Comparison
| Ratings Source | ICICI Prudential Multi-Asset Fund | Quant Multi-Asset Fund |
| CRISIL Ratings (as on 31st Mar 2024) | NA | NA |
| CRISIL Ratings (as on 31st Dec 2023) | NA | NA |
| CRISIL Ratings (as on 30th Sep 2023) | NA | NA |
| CRISIL Ratings (as on 30th Jun 2023) | NA | NA |
| CRISIL Ratings (as on 31st Mar 2023) | NA | NA |
| Value Research Ratings | ⭐⭐⭐⭐☆ | ⭐⭐⭐⭐⭐ |
| Economic Times Ratings | ⭐⭐⭐⭐☆ | ⭐⭐⭐⭐⭐ |
| Morning Star Ratings | NA | NA |
| Groww Ratings | ⭐⭐⭐⭐☆ | ⭐⭐⭐⭐⭐ |
| AngelOne AQR Ratings | ⭐⭐⭐⭐⭐ | ⭐⭐⭐⭐☆ |
| 5Paisa Ratings | ⭐⭐⭐⭐☆ | ⭐⭐⭐⭐⭐ |
| KUVERA ratings | ⭐⭐⭐☆☆ | ⭐⭐⭐☆☆ |
| Average Ratings | ⭐⭐⭐⭐☆ | ⭐⭐⭐⭐☆ |
Analysis
ICICI Prudential Multi-Asset Fund: Solid and Reliable
ICICI Prudential Multi-Asset Fund holds steady ratings across multiple platforms, with an average rating of 4.0 stars. It’s like that dependable vehicle that always gets you where you need to go. This fund is a solid choice for investors seeking stability and reliable performance.
Quant Multi-Asset Fund: High Performer
Quant Multi-Asset Fund shines with higher ratings on several platforms, achieving an average rating of 4.5 stars. This fund is like a high-speed train, offering robust performance and potentially higher returns. It’s ideal for investors looking for a more dynamic option.
Fund Management Comparison
The expertise and experience of fund managers play a vital role in the performance of mutual funds. Let’s compare the tenure of fund managers associated with ICICI Prudential Multi-Asset Fund and Quant Multi-Asset Fund

Analysis:
- ICICI Prudential Multi-Asset Fund: This fund is managed by seasoned professionals, with Sankaran Naren leading the team for 147 months, followed by Ihab Dalwai (82 months) and Sri Sharma (37 months). The fund benefits from the extensive experience and expertise of its management team.
- Quant Multi-Asset Fund: Quant Multi-Asset Fund has a relatively newer team of fund managers, with Vasav Sahgal (58 months) being the most experienced among them. However, other managers have shorter tenures, indicating a relatively less established track record.
Key Takeaways:
- ICICI Prudential Multi-Asset Fund and Quant Multi-Asset Fund exhibit differences in sector allocation, reflecting their distinct investment strategies and outlooks on various sectors.
- The tenure of fund managers is an essential factor to consider, with ICICI Prudential Multi-Asset Fund having a more experienced management team compared to Quant Multi-Asset Fund.
Other Imp. General details
NAV (Net Asset Value)
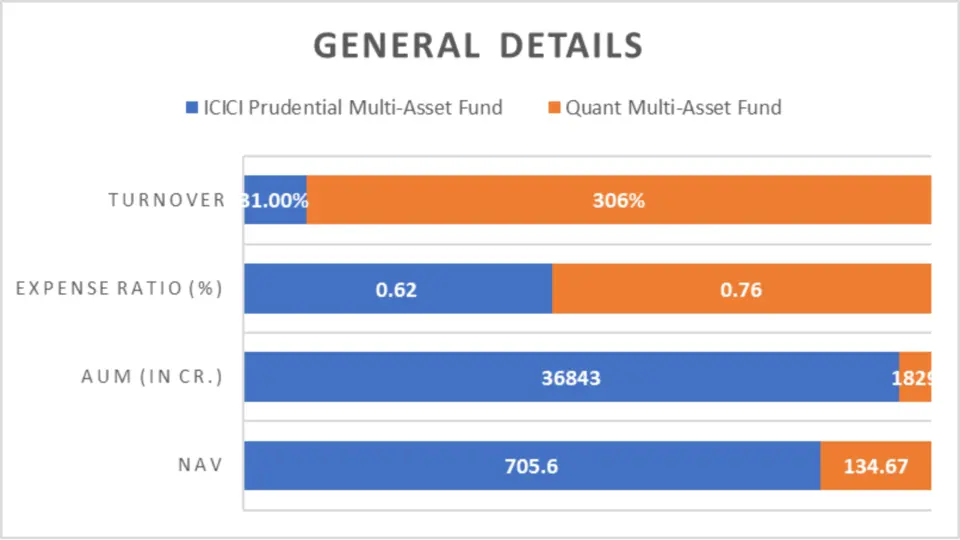
NAV represents the per-unit market value of a mutual fund on a specific date. Let’s take a look at the NAV of both funds
General Details
| Fund | NAV | AUM (in Cr.) | Expense Ratio (%) | Turnover | Benchmark |
| ICICI Prudential Multi-Asset Fund | 705.6 | 36843 | 0.62 | 31.00% | iCOMDEX Composite Index |
| Quant Multi-Asset Fund | 134.67 | 1829 | 0.76 | 306% | iCOMDEX Composite Index |
Analysis:
- The NAV of the ICICI Prudential Multi-Asset Fund is significantly higher than that of the Quant Multi-Asset Fund, indicating a higher per-unit value than the former.
AUM (Assets Under Management)
AUM denotes to the total market value of assets managed by a mutual fund. Here’s a comparison of AUM for both funds:
| Fund | AUM (in Cr.) |
| ICICI Prudential Multi-Asset Fund | ₹ 36,843 |
| Quant Multi-Asset Fund | ₹ 1,829 |
Analysis:
- ICICI Prudential Multi-Asset Fund manages a substantially higher AUM compared to Quant Multi-Asset Fund, indicating greater investor trust and confidence in the former.
Expense Ratio
The expense ratio represents the annual fees charged by mutual funds as a percentage of AUM. Let’s see how the expense ratios compare:
| Fund | Expense Ratio (%) |
| ICICI Prudential Multi-Asset Fund | 0.62 |
| Quant Multi-Asset Fund | 0.76 |
Analysis:
- ICICI Prudential Multi-Asset Fund has a lower expense ratio compared to Quant Multi-Asset Fund, indicating relatively lower costs for investors.
Turnover
Turnover measures the rate with which assets within a mutual fund are bought and sold. Here’s a comparison of turnover for both funds:
| Fund | Turnover (%) |
| ICICI Prudential Multi-Asset Fund | 31.00% |
| Quant Multi-Asset Fund | 306% |
Analysis:
- ICICI Prudential Multi-Asset Fund maintains a significantly lower turnover rate compared to Quant Multi-Asset Fund, suggesting a more conservative investment approach.
Benchmark
A benchmark is a measure against which the performance of a mutual fund is measured. Let’s explore the benchmarks for both funds:
| Fund | Benchmark |
| ICICI Prudential Multi-Asset Fund | iCOMDEX Composite Index |
| Quant Multi-Asset Fund | iCOMDEX Composite Index |
Analysis:
- Both funds use the iCOMDEX Composite Index as their benchmark, providing investors with a clear reference point for evaluating performance.
Minimum Investment Amount
The minimum investment amount indicates the minimum initial investment required to invest in a mutual fund. Let’s compare the minimum investment amounts for SIP and lump sum investments:
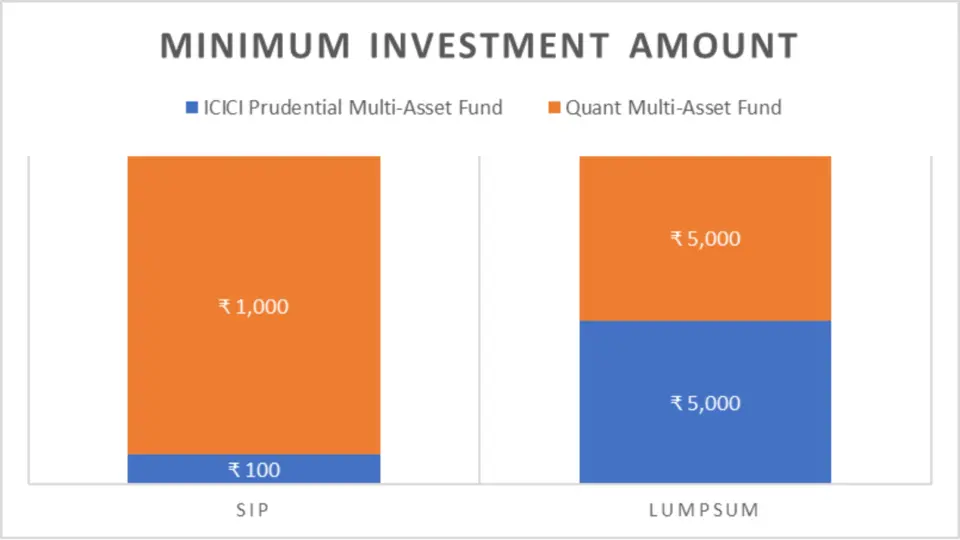
Minimum Investment Amount
| Fund | SIP | Lumpsum |
| ICICI Prudential Multi-Asset Fund | ₹ 100 | ₹ 5,000 |
| Quant Multi-Asset Fund | ₹ 1,000 | ₹ 5,000 |
Analysis:
- ICICI Prudential Multi-Asset Fund offers a lower minimum investment amount for SIPs compared to Quant Multi-Asset Fund, making it more accessible to investors looking to invest small amounts regularly.
Conclusion
the comparative analysis between ICICI Prudential Multi-Asset Fund and Quant Multi-Asset Fund has provided valuable insights into these funds, including investment style, returns, risk analysis, portfolio composition, and fund management.
Quant Multi-Asset Fund emerges as the better option regarding trailing returns, lumpsum and SIP investment values, CAGR, and Alpha relative to the Nifty 50 index, indicating its potential for higher growth. However, it’s essential to consider risk tolerance and investment objectives. For investors seeking higher returns and growth potential, Quant Multi-Asset Fund is more suitable.
At the same time, those prioritizing stability might opt for the ICICI Prudential Multi-Asset Fund. ICICI Prudential Multi-Asset Fund has a lower expense ratio and a more experienced management team, which could benefit you in achieving your long term investment objective.

We hope you found this guide on mutual funds helpful.
If you have any mutual fund-related queries, feel free to comment below—we’re here to help! S.K. Singh, a registered professional with the Association of Mutual Funds in India (AMFI), will answer your queries and holds the ARN-251149.
Invest wisely!
FAQs – ICICI Prudential Multi-Asset Fund vs Quant Multi-Asset Fund
What is the investment style of ICICI Prudential Multi-Asset Fund and Quant Multi-Asset Fund?
ICICI Prudential Multi-Asset Fund and Quant Multi-Asset Fund follow a growth-oriented approach, seeking capital appreciation over the long term rather than focusing on generating income through dividends.
How do the returns of ICICI Prudential Multi-Asset Fund and Quant Multi-Asset Fund compare over different time horizons?
Quant Multi-Asset Fund has consistently outperformed ICICI Prudential Multi-Asset Fund across various time horizons, showcasing higher trailing returns, SIP returns, and CAGR.
Which fund has a higher NAV for lumpsum and SIP investments?
Quant Multi-Asset Fund generally exhibits a higher NAV for both lump sum and SIP investments than ICICI Prudential Multi-Asset Fund, indicating potentially better returns on investment.
How do the risk-adjusted returns of ICICI Prudential Multi-Asset Fund and Quant Multi-Asset Fund compare?
Quant Multi-Asset Fund generally demonstrates higher returns but also higher volatility. In comparison, ICICI Prudential Multi-Asset Fund offers lower risk-adjusted returns with lower volatility.
Which fund has a more diversified portfolio and lower expense ratio?
ICICI Prudential Multi-Asset Fund maintains a diversified portfolio with lower expenses than Quant Multi-Asset Fund, offering potential benefits for investors seeking diversification at a lower cost.
How do the fund managers’ tenures differ between ICICI Prudential Multi-Asset Fund and Quant Multi-Asset Fund?
ICICI Prudential Multi-Asset Fund has a more experienced management team with longer average tenures than Quant Multi-Asset Fund, indicating a potentially more established track record and stability in decision-making.
Which fund has a higher Assets Under Management (AUM)?
ICICI Prudential Multi-Asset Fund manages a substantially higher AUM than Quant Multi-Asset Fund, indicating greater investor trust and confidence in the former.
What is the key takeaway for investors comparing ICICI Prudential Multi-Asset Fund and Quant Multi-Asset Fund?
Investors seeking higher returns and growth potential may find Quant Multi-Asset Fund direct growth more appealing. At the same time, those prioritizing stability and lower risk may opt for the ICICI Prudential Multi-Asset Fund – Growth.
How do the fund expenses and turnover rates differ between the two funds?
ICICI Prudential Multi-Asset Fund – Growth generally has lower expenses and turnover rates than Quant Multi-Asset Fund, potentially offering cost savings and more stable investment strategies.
What are the sector allocations of ICICI Prudential Multi-Asset Fund and Quant Multi-Asset Fund?
ICICI Prudential Multi-Asset Fund and Quant Multi-Asset Fund have different sector allocations, reflecting their distinct investment strategies and outlooks on various sectors.
Disclaimer:
The information provided in this article is solely the author/advertisers’ opinion and not investment advice – it is provided for educational purposes only. Using this, you agree that the information does not constitute any investment or financial instructions by Ace Equity Research/Mutual Fund Focus/IPO First and the team. Anyone wishing to invest should seek their own independent financial or professional advice. Conduct your research with registered financial advisors before making any investment decisions. Ace Equity Research/ Mutual Fund Focus / IPO First and the team are not accountable for the investment views provided in the article.
Mutual Fund investments are subject to market risks. Read all scheme-related documents carefully.
Investments in the securities market are subject to market risks. Read all the related documents carefully before investing.


