Are you pondering over the right Flexi cap fund to invest in? JM Flexi Cap Fund vs Parag Parikh Flexi Cap Fund are popular choices, but how do you decide which suits your investment goals? This blog post will provide a detailed, data-driven, and engaging comparative analysis of these two funds, helping you make an informed decision. Let’s dive into their investment styles, historical returns, and lumpsum investment values to see how they stack against each other.
Understanding Flexi Cap Funds
Before jumping into the details, let’s quickly revisit Flexi cap funds. Flexi-cap category mutual funds that invest in companies across various market capitalizations—large-cap, mid-cap, and small-cap—depending on where the fund manager sees the best opportunities. These funds offer flexibility and diversification, which can help manage risks and maximize returns.
Investment Style
JM Flexi Cap Fund and Parag Parikh Flexi Cap Fund follow a growth investment style. This means they focus on investing in companies likely to expand at an above-average rate compared to other companies. Growth funds are typically characterized by high price-to-earnings (P/E) ratios. They concentrate on companies investing their earnings into expansion, acquisitions, or research and development.
| Fund | Investment Style |
| JM Flexi Cap Fund | Growth |
| Parag Parikh Flexi Cap Fund | Growth |

Returns Analysis
Analysing the historical returns of mutual funds is crucial for making informed investment decisions. Let’s look at the trailing returns for both funds as of May 20, 2024.
Trailing Returns

| Period Invested for | JM Flexi Cap Fund | Parag Parikh Flexi Cap Fund |
| 1 Year | 68.18% | 37.24% |
| 2 Year | 43.07% | 27.78% |
| 3 Year | 31.88% | 22.86% |
| 5 Year | 26.15% | 25.08% |
| 10 Year | 20.57% | 19.86% |
Analysis
- 1 Year: The JM Flexi Cap Fund has delivered an impressive return of 68.18% compared to the 37.24% of the Parag Parikh Flexi Cap Fund. This shows that JM Flexi Cap Fund had a more robust performance over the past year.
- 2 Years: Over two years, JM Flexi Cap Fund continued to outperform with a return of 43.07% versus 27.78% from Parag Parikh Flexi Cap Fund.
- 3 Years: The trend remains consistent, with JM Flexi Cap Fund posting a 31.88% return against the 22.86% return of Parag Parikh Flexi Cap Fund.
- 5 Years: The gap narrows over five years, with JM Flexi Cap Fund yielding 26.15% and Parag Parikh Flexi Cap Fund closely trailing with 25.08%.
- 10 Years: Regarding long-term performance, JM Flexi Cap Fund shows a return of 20.57%, slightly ahead of Parag Parikh Flexi Cap Fund’s 19.86%.
Key Takeaways
- Short-term Performance: Over the short term (1-3 years), JM Flexi Cap Fund has shown significantly higher returns than Parag Parikh Flexi Cap Fund.
- Mid-term Performance: In the mid-term (5 years), the performance gap between the two funds narrows, although JM Flexi Cap Fund still holds a slight edge.
- Long-term Performance: Over a decade, both funds have performed similarly, with JM Flexi Cap Fund having a marginally better return.
Lumpsum Investment Value
Let’s compare the lumpsum investment values for both funds over different periods. This will give us a clearer picture of how much your investment would have grown with each fund.
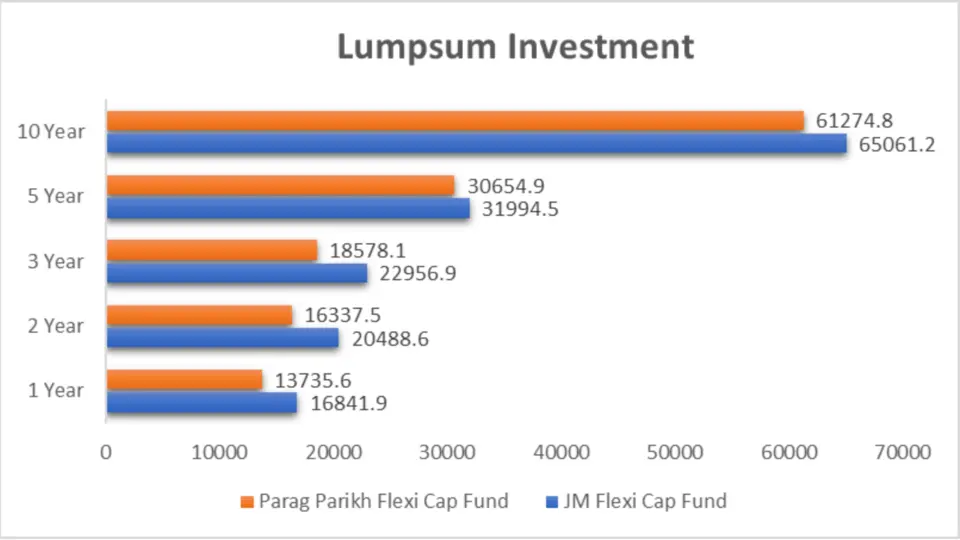
| Period Invested for | JM Flexi Cap Fund (₹) | Parag Parikh Flexi Cap Fund (₹) |
| 1 Year | 16,841.9 | 13,735.6 |
| 2 Year | 20,488.6 | 16,337.5 |
| 3 Year | 22,956.9 | 18,578.1 |
| 5 Year | 31,994.5 | 30,654.9 |
| 10 Year | 65,061.2 | 61,274.8 |
Analysis
1 Year Analysis
- JM Flexi Cap Fund: ₹16,841.9
- Parag Parikh Flexi Cap Fund: ₹13,735.6
The JM Flexi Cap Fund significantly outperformed the Parag Parikh Flexi Cap Fund in just one year, growing your investment by a substantial margin.
2 Years Analysis
- JM Flexi Cap Fund: ₹20,488.6
- Parag Parikh Flexi Cap Fund: ₹16,337.5
Over two years, the JM Flexi Cap Fund continues to lead, indicating consistent short-term performance.
3 Years Analysis
- JM Flexi Cap Fund: ₹22,956.9
- Parag Parikh Flexi Cap Fund: ₹18,578.1
The three-year performance gap suggests that JM Flexi Cap Fund has also been a better choice for medium-term investors.
5 Years Analysis
- JM Flexi Cap Fund: ₹31,994.5
- Parag Parikh Flexi Cap Fund: ₹30,654.9
The gap narrows over five years, with both funds performing quite closely. This indicates that Parag Parikh Flexi Cap Fund is catching up in the mid-term.
10 Years Analysis
- JM Flexi Cap Fund: ₹65,061.2
- Parag Parikh Flexi Cap Fund: ₹61,274.8
Over a decade, both funds have shown strong growth, with JM Flexi Cap Fund slightly ahead, demonstrating its ability to deliver consistent long-term returns.
Key Takeaways
- Short-term Performance: The JM Flexi Cap Fund has demonstrated superior short-term performance, making it an attractive option for quick gains.
- Mid-term Performance: The gap between the two funds narrows over five years, suggesting that Parag Parikh Flexi Cap Fund may be a viable option for medium-term investments.
- Long-term Performance: Both funds have performed well over a decade, with JM Flexi Cap Fund holding a slight edge. This indicates strong and consistent performance over the long term.
SIP Returns
Analysing SIP returns is essential for those who prefer Systematic Investment Plans (SIPs). Let’s see how both funds have performed in this regard.
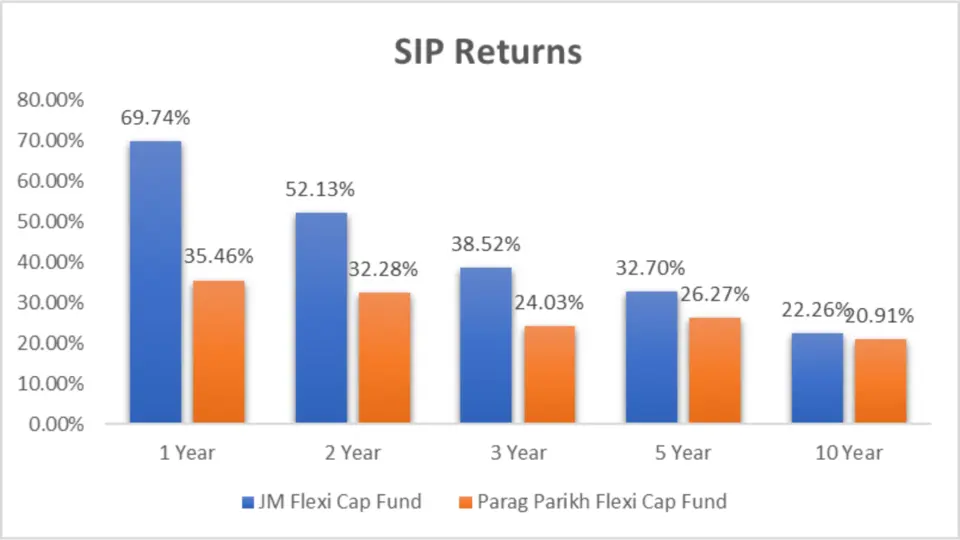
| Period Invested for | JM Flexi Cap Fund | Parag Parikh Flexi Cap Fund |
| 1 Year | 69.74% | 35.46% |
| 2 Year | 52.13% | 32.28% |
| 3 Year | 38.52% | 24.03% |
| 5 Year | 32.70% | 26.27% |
| 10 Year | 22.26% | 20.91% |
Analysis
- Superior Short-term Performance: Over the short term (1-3 years), JM Flexi Cap Fund significantly outperforms Parag Parikh Flexi Cap Fund in SIP returns. For instance, the 1-year SIP return for JM Flexi Cap Fund is 69.74%, compared to 35.46% for Parag Parikh Flexi Cap Fund. This makes JM Flexi Cap Fund an attractive option for investors seeking quick gains.
- Consistent Mid-term Gains: In the mid-term (5 years), JM Flexi Cap Fund continues to hold an edge with a 32.70% return versus 26.27% from Parag Parikh Flexi Cap Fund. This indicates that JM Flexi Cap Fund maintains its performance advantage over a more extended period, appealing to medium-term investors.
Key Takeaways
- Better Risk-Adjusted Returns: The higher SIP returns across all periods for JM Flexi Cap Fund suggest that it offers better risk-adjusted returns, making it a more favourable choice for investors with varying risk appetites.
- Parag Parikh Flexi Cap Fund’s Stability: Despite trailing JM Flexi Cap Fund in returns, Parag Parikh Flexi Cap Fund demonstrates stable performance, especially suitable for investors looking for steady, long-term growth with slightly lower volatility
SIP Investment Value
To give a better perspective for SIP investors, let’s compare the SIP investment values of both funds over different periods.
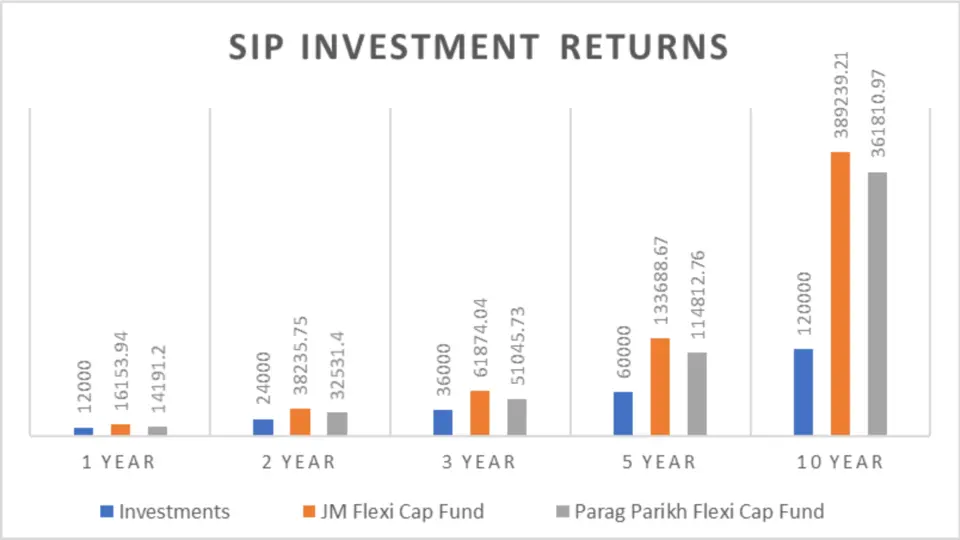
| Period Invested for | Investments (₹) | JM Flexi Cap Fund (₹) | Parag Parikh Flexi Cap Fund (₹) |
| 1 Year | 12,000 | 16,153.94 | 14,191.2 |
| 2 Year | 24,000 | 38,235.75 | 32,531.4 |
| 3 Year | 36,000 | 61,874.04 | 51,045.73 |
| 5 Year | 60,000 | 133,688.67 | 114,812.76 |
| 10 Year | 120,000 | 389,239.21 | 361,810.97 |
Analysis
1 Year Analysis
- JM Flexi Cap Fund: ₹16,153.94 (69.74% returns)
- Parag Parikh Flexi Cap Fund: ₹14,191.2 (35.46% returns)
The JM Flexi Cap Fund significantly outperformed the Parag Parikh Flexi Cap Fund in just one year, growing your investment by a substantial margin.
2 Years Analysis
- JM Flexi Cap Fund: ₹38,235.75 (52.13% returns)
- Parag Parikh Flexi Cap Fund: ₹32,531.4 (32.28% returns)
Over two years, the JM Flexi Cap Fund continues to lead, indicating consistent short-term performance.
3 Years Analysis
- JM Flexi Cap Fund: ₹61,874.04 (38.52% returns)
- Parag Parikh Flexi Cap Fund: ₹51,045.73 (24.03% returns)
The three-year performance gap suggests that JM Flexi Cap Fund has also been a better choice for medium-term investors.
5 Years Analysis
- JM Flexi Cap Fund: ₹133,688.67 (32.70% returns)
- Parag Parikh Flexi Cap Fund: ₹114,812.76 (26.27% returns)
The gap narrows over five years, with both funds performing quite closely. This indicates that Parag Parikh Flexi Cap Fund is catching up in the mid-term.
10 Years Analysis
- JM Flexi Cap Fund: ₹389,239.21 (22.26% returns)
- Parag Parikh Flexi Cap Fund: ₹361,810.97 (20.91% returns)
Over a decade, both funds have shown strong growth, with JM Flexi Cap Fund slightly ahead, demonstrating its ability to deliver consistent long-term returns.
Key Takeaways
- Short-term Performance: The JM Flexi Cap Fund has demonstrated superior short-term performance, making it an attractive option for quick gains.
- Mid-term Performance: The gap between the two funds narrows over five years, suggesting that Parag Parikh Flexi Cap Fund may be a viable option for medium-term investments.
- Long-term Performance: Both funds have performed well over a decade, with JM Flexi Cap Fund holding a slight edge. This indicates strong and consistent performance over the long term.
CAGR Comparison
When it comes to mutual funds, CAGR is a crucial metric. It smooths out the returns over time, clearly showing the annual growth rate. Let’s compare the CAGR of JM Flexi Cap Fund and Parag Parikh Flexi Cap Fund across different periods.
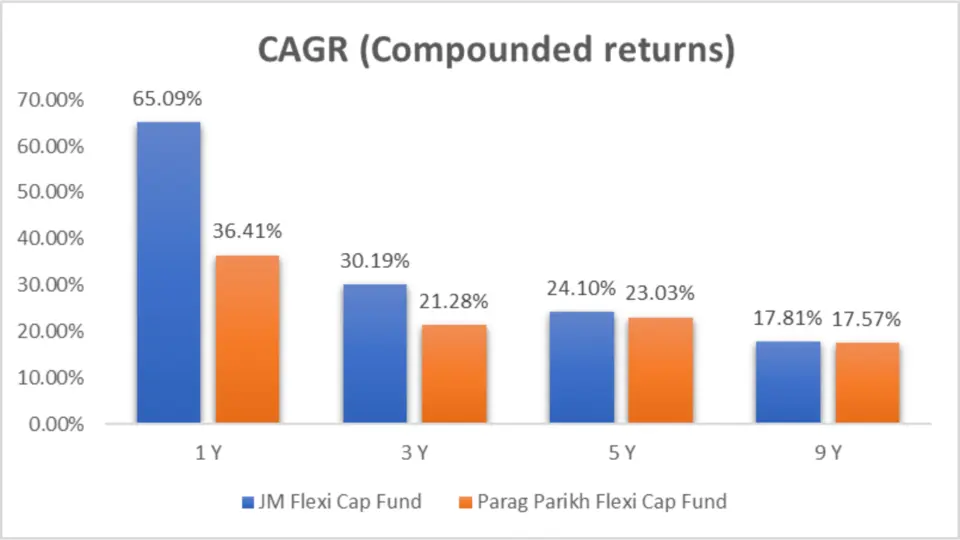
| Category | 1 Year | 3 Years | 5 Years | 9 Years |
| JM Flexi Cap Fund | 65.09% | 30.19% | 24.10% | 17.81% |
| Parag Parikh Flexi Cap Fund | 36.41% | 21.28% | 23.03% | 17.57% |
Analysis
Let’s break down these numbers to understand what they mean for you as an investor.
1 Year CAGR
- JM Flexi Cap Fund: 65.09%
- Parag Parikh Flexi Cap Fund: 36.41%
In just one year, the JM Flexi Cap Fund has outperformed the Parag Parikh Flexi Cap Fund by a significant margin. This high CAGR indicates that JM Flexi Cap Fund has generated substantial returns, making it a standout performer in the short term.
3 Years CAGR
- JM Flexi Cap Fund: 30.19%
- Parag Parikh Flexi Cap Fund: 21.28%
Over three years, JM Flexi Cap Fund continues to lead with a CAGR of 30.19%, compared to Parag Parikh Flexi Cap Fund’s 21.28%. This highlights JM Flexi Cap Fund’s strong performance in the medium term, showcasing its ability to generate robust returns.
5 Years CAGR
- JM Flexi Cap Fund: 24.10%
- Parag Parikh Flexi Cap Fund: 23.03%
In the five-year horizon, the gap narrows slightly. JM Flexi Cap Fund still holds a slight edge with a CAGR of 24.10% against Parag Parikh Flexi Cap Fund’s 23.03%. This shows that while both funds are strong performers, JM Flexi Cap Fund has maintained a slight lead in generating returns over five years.
9 Years CAGR
- JM Flexi Cap Fund: 17.81%
- Parag Parikh Flexi Cap Fund: 17.57%
Over nine years, the performance of both funds converges. JM Flexi Cap Fund’s CAGR is 17.81%, while Parag Parikh Flexi Cap Fund is 17.57%. The difference here is minimal, indicating that both funds have delivered steady returns over the long term.
Key Takeaways
- Short-term Outperformance: JM Flexi Cap Fund has outperformed Parag Parikh Flexi Cap Fund in the short term with a CAGR of 65.09% compared to 36.41%. This makes it an excellent choice for investors looking for quick gains.
- Consistent Medium-term Growth: Over three years, JM Flexi Cap Fund’s CAGR of 30.19% still surpasses Parag Parikh Flexi Cap Fund’s 21.28%, showcasing its strong growth potential in the medium term.
- Narrowing Performance Gap: The difference in CAGR narrows over the five-year and nine-year periods. While JM Flexi Cap Fund leads slightly with a CAGR of 24.10% over five years and 17.81% over nine years, Parag Parikh Flexi Cap Fund’s performance is not far behind.
Rolling Returns
Rolling returns are a great way to evaluate the consistency of a fund’s performance. Let’s compare the rolling returns of both funds over different periods.
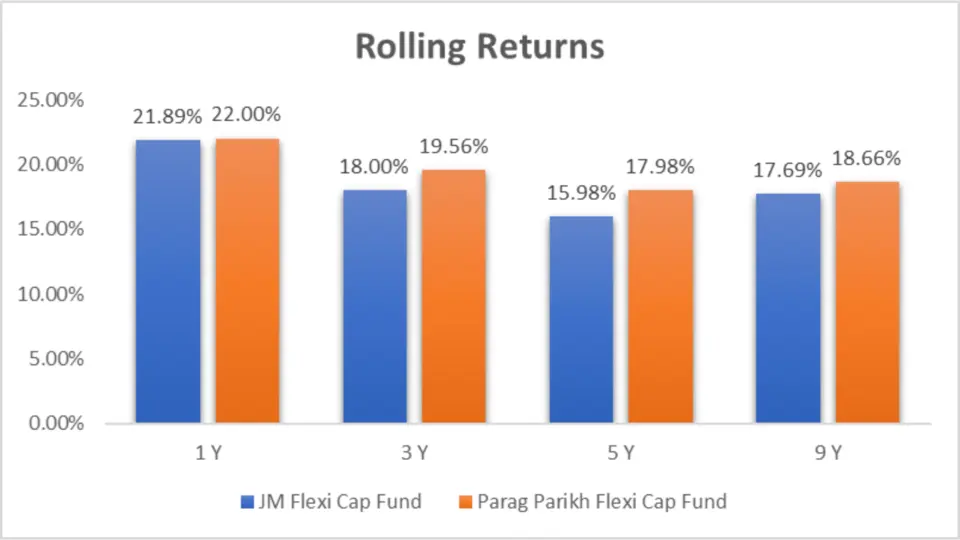
| Category | 1 Year | 3 Years | 5 Years | 9 Years |
| JM Flexi Cap Fund | 21.89% | 18.00% | 15.98% | 17.69% |
| Parag Parikh Flexi Cap Fund | 22.00% | 19.56% | 17.98% | 18.66% |
Analysis
1 Year Analysis
- JM Flexi Cap Fund: 21.89%
- Parag Parikh Flexi Cap Fund: 22.00%
In the one-year rolling returns category, Parag Parikh Flexi Cap Fund slightly outperforms JM Flexi Cap Fund, indicating marginally better short-term consistency.
3 Years Analysis
- JM Flexi Cap Fund: 18.00%
- Parag Parikh Flexi Cap Fund: 19.56%
Over three years, Parag Parikh Flexi Cap Fund continues to lead with a rolling return of 19.56%, compared to JM Flexi Cap Fund’s 18.00%. This highlights its more vital performance consistency over the medium term.
5 Years Analysis
- JM Flexi Cap Fund: 15.98%
- Parag Parikh Flexi Cap Fund: 17.98%
In the five-year horizon, Parag Parikh Flexi Cap Fund again outshines with a rolling return of 17.98%, compared to JM Flexi Cap Fund’s 15.98%, showing better consistency over the long term.
9 Years Analysis
- JM Flexi Cap Fund: 17.69%
- Parag Parikh Flexi Cap Fund: 18.66%
Over nine years, Parag Parikh Flexi Cap Fund has maintained its lead with a rolling return of 18.66%, while JM Flexi Cap Fund has 17.69%. This consistency is crucial for long-term investors looking for stable returns.
Key Takeaways
- Short-term Consistency: Parag Parikh Flexi Cap Fund has shown marginally better short-term consistency with a rolling return of 22.00% over one year compared to JM Flexi Cap Fund’s 21.89%.
- Medium-term Consistency: Over three years, Parag Parikh Flexi Cap Fund leads with a rolling return of 19.56%, highlighting its robust performance in the medium term.
- Long-term Stability: Over five and nine years, Parag Parikh Flexi Cap Fund continues to outperform with rolling returns of 17.98% and 18.66%, respectively, showcasing its consistent long-term stability.
Annualized/Calendar Year Returns
One of the most crucial factors to consider when choosing a mutual fund is its historical returns. Let’s look at both funds’ annualized/calendar year returns as of May 20, 2024.
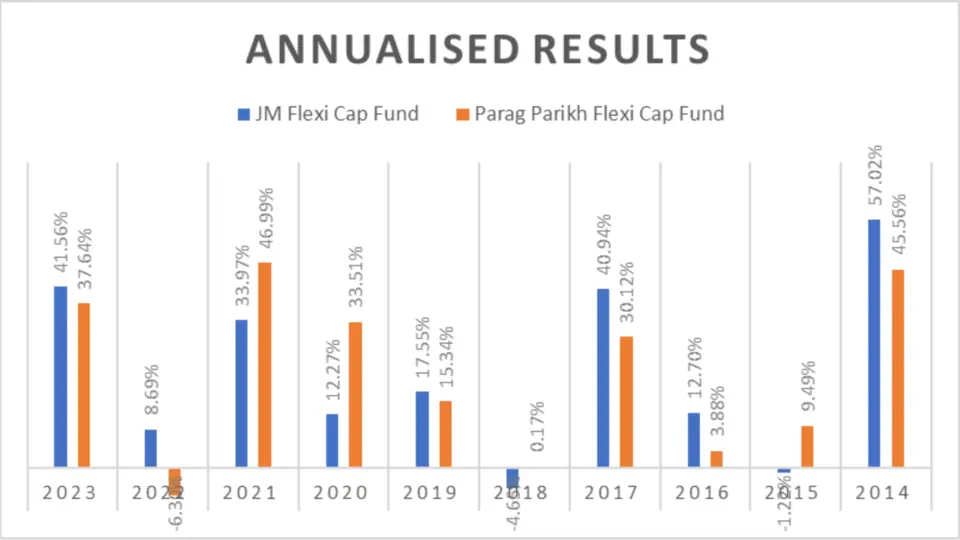
| Period | JM Flexi Cap Fund | Parag Parikh Flexi Cap Fund |
| 2023 | 41.56% | 37.64% |
| 2022 | 8.69% | -6.30% |
| 2021 | 33.97% | 46.99% |
| 2020 | 12.27% | 33.51% |
| 2019 | 17.55% | 15.34% |
| 2018 | -4.65% | 0.17% |
| 2017 | 40.94% | 30.12% |
| 2016 | 12.70% | 3.88% |
| 2015 | -1.22% | 9.49% |
| 2014 | 57.02% | 45.56% |
| Total Return | 218.83% | 216.40% |
| Ave Return | 21.88% | 21.64% |
| No. of times Outperformance | 6 | 4 |
Analysis
2023 Performance
- JM Flexi Cap Fund: 41.56%
- Parag Parikh Flexi Cap Fund: 37.64%
In 2023, the JM Flexi Cap Fund outperformed the Parag Parikh Flexi Cap Fund, showcasing its strong performance with a return of 41.56%.
2022 Performance
- JM Flexi Cap Fund: 8.69%
- Parag Parikh Flexi Cap Fund: -6.30%
During a challenging year, JM Flexi Cap Fund managed a positive return of 8.69%, while Parag Parikh Flexi Cap Fund recorded a negative return of -6.30%.
2021 Performance
- JM Flexi Cap Fund: 33.97%
- Parag Parikh Flexi Cap Fund: 46.99%
In 2021, Parag Parikh Flexi Cap Fund outshined with an impressive 46.99% return, surpassing JM Flexi Cap Fund’s 33.97%.
2020 Performance
- JM Flexi Cap Fund: 12.27%
- Parag Parikh Flexi Cap Fund: 33.51%
The Parag Parikh Flexi Cap Fund demonstrated strong performance in 2020, delivering a 33.51% return compared to JM Flexi Cap Fund’s 12.27%.
2019 Performance
- JM Flexi Cap Fund: 17.55%
- Parag Parikh Flexi Cap Fund: 15.34%
In 2019, JM Flexi Cap Fund led with a return of 17.55%, slightly ahead of Parag Parikh Flexi Cap Fund’s 15.34%.
2018 Performance
- JM Flexi Cap Fund: -4.65%
- Parag Parikh Flexi Cap Fund: 0.17%
In a challenging year for markets, Parag Parikh Flexi Cap Fund stayed in positive territory with a return of 0.17%. In comparison, JM Flexi Cap Fund recorded a 4.65% return.
2017 Performance
- JM Flexi Cap Fund: 40.94%
- Parag Parikh Flexi Cap Fund: 30.12%
JM Flexi Cap Fund excelled in 2017 with a robust return of 40.94%, outperforming Parag Parikh Flexi Cap Fund’s 30.12%.
2016 Performance
- JM Flexi Cap Fund: 12.70%
- Parag Parikh Flexi Cap Fund: 3.88%
In 2016, JM Flexi Cap Fund delivered a solid return of 12.70%, compared to Parag Parikh Flexi Cap Fund’s 3.88%.
2015 Performance
- JM Flexi Cap Fund: -1.22%
- Parag Parikh Flexi Cap Fund: 9.49%
Parag Parikh Flexi Cap Fund performed better in 2015, with a return of 9.49%, while JM Flexi Cap Fund had a negative return of -1.22%.
2014 Performance
- JM Flexi Cap Fund: 57.02%
- Parag Parikh Flexi Cap Fund: 45.56%
JM Flexi Cap Fund had an outstanding performance in 2014 with a return of 57.02%, outperforming Parag Parikh Flexi Cap Fund’s 45.56%.
Key Takeaways
- Short-term Performance: JM Flexi Cap Fund has demonstrated short-term solid performance, particularly in recent years.
- Consistency: Parag Parikh Flexi Cap Fund has consistently performed, especially during challenging market conditions.
- Long-term Stability: Both funds have shown long-term solid performance, with JM Flexi Cap Fund slightly leading in total and average returns.
Quarterly Results
Quarterly performance gives a snapshot of how a fund has performed over shorter periods, providing insights into its consistency and response to market changes.
Quarterly Results Comparison Table
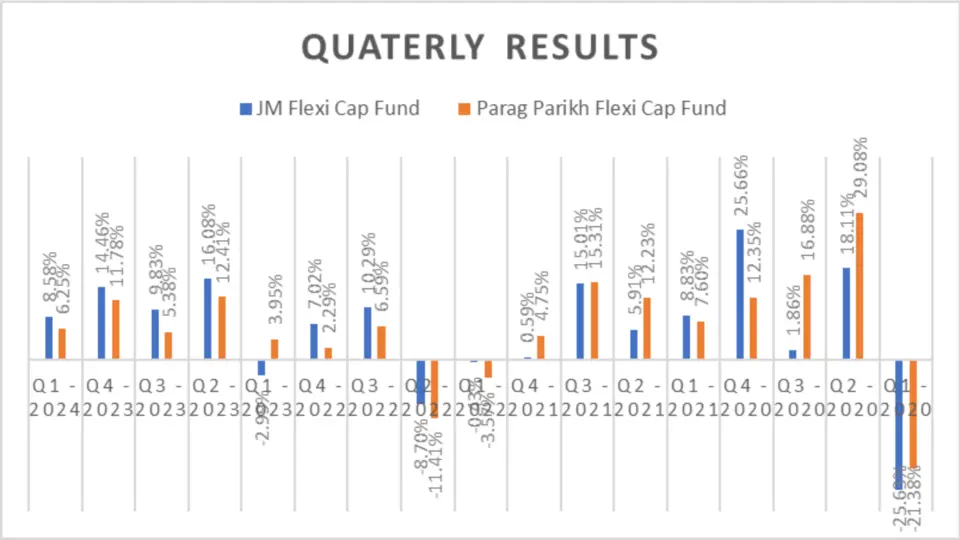
| Period | JM Flexi Cap Fund | Parag Parikh Flexi Cap Fund |
| Q1 – 2024 | 8.58% | 6.25% |
| Q4 – 2023 | 14.46% | 11.78% |
| Q3 – 2023 | 9.83% | 5.38% |
| Q2 – 2023 | 16.08% | 12.41% |
| Q1 – 2023 | -2.99% | 3.95% |
| Q4 – 2022 | 7.02% | 2.29% |
| Q3 – 2022 | 10.29% | 6.59% |
| Q2 – 2022 | -8.70% | -11.41% |
| Q1 – 2022 | -0.43% | -3.57% |
| Q4 – 2021 | 0.59% | 4.75% |
| Q3 – 2021 | 15.01% | 15.31% |
| Q2 – 2021 | 5.91% | 12.23% |
| Q1 – 2021 | 8.83% | 7.60% |
| Q4 – 2020 | 25.66% | 12.35% |
| Q3 – 2020 | 1.86% | 16.88% |
| Q2 – 2020 | 18.11% | 29.08% |
| Q1 – 2020 | -25.63% | -21.38% |
Analysis
Recent Performance (2023-2024)
- Q1 2024: JM Flexi Cap Fund outperformed with an 8.58% return compared to Parag Parikh Flexi Cap Fund’s 6.25%.
- Q4 2023: JM Flexi Cap Fund led again with a 14.46% return versus 11.78% for Parag Parikh Flexi Cap Fund.
- Q3 2023: JM Flexi Cap Fund delivered 9.83%, while Parag Parikh Flexi Cap Fund managed 5.38%.
- Q2 2023: JM Flexi Cap Fund achieved 16.08%, outperforming Parag Parikh Flexi Cap Fund’s 12.41%.
Challenging Periods
- Q1 2023: Parag Parikh Flexi Cap Fund performed better with a 3.95% return, whereas JM Flexi Cap Fund had a negative return of -2.99%.
- Q2 2022: Both funds struggled, but JM Flexi Cap Fund’s -8.70% was less severe than Parag Parikh Flexi Cap Fund’s -11.41%.
Total and Average Returns
The total and average returns provide a broader perspective on a fund’s performance over time, offering insights into its growth potential.
| Category | JM Flexi Cap Fund | Parag Parikh Flexi Cap Fund |
| Total Return | 104.48% | 110.49% |
| Average Return | 6.15% | 6.50% |
Key Takeaways
- Quarterly Performance: JM Flexi Cap Fund generally outperformed Parag Parikh Flexi Cap Fund in recent quarters, though Parag Parikh Flexi Cap Fund showed resilience in some challenging periods.
- Total and Average Returns: Parag Parikh Flexi Cap Fund slightly outperformed in total and average returns, showcasing its long-term growth potential.


Risk Analysis
Maximum Drawdown
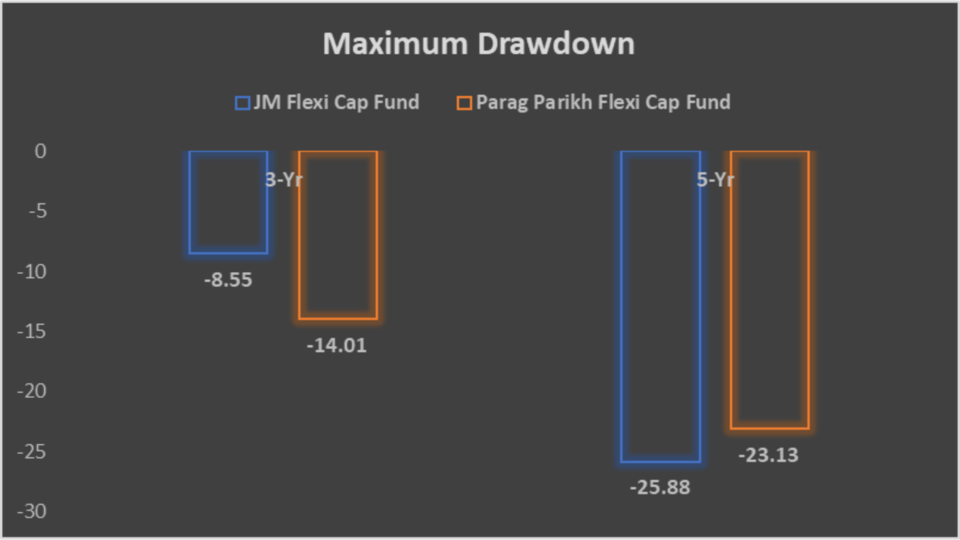
Understanding a fund’s maximum Drawdown is crucial for assessing its risk. Maximum Drawdown measures the most significant drop from peak to trough in the fund’s value, providing insight into potential losses during market downturns.
| Period | JM Flexi Cap Fund | Parag Parikh Flexi Cap Fund |
| 3-Year | -8.55% | -23.13% |
| 5-Year | -25.88% | -23.13% |
Analysis
3-Year Drawdown
- JM Flexi Cap Fund: -8.55%
- Parag Parikh Flexi Cap Fund: -23.13%
JM Flexi Cap Fund had a significantly lower maximum drawdown in the three years than Parag Parikh Flexi Cap Fund, indicating less volatility and better risk management.
5-Year Drawdown
- JM Flexi Cap Fund: -25.88%
- Parag Parikh Flexi Cap Fund: -23.13%
Over five years, both funds experienced significant market fluctuations. Still, the Parag Parikh Flexi Cap Fund had a slightly better maximum drawdown, indicating it handled long-term volatility better.
Key Takeaway
- Maximum Drawdown: JM Flexi Cap Fund had a lower maximum drawdown over three years, indicating better short-term risk management
Mean, Sortino Ratio and Treynor’s Ratio
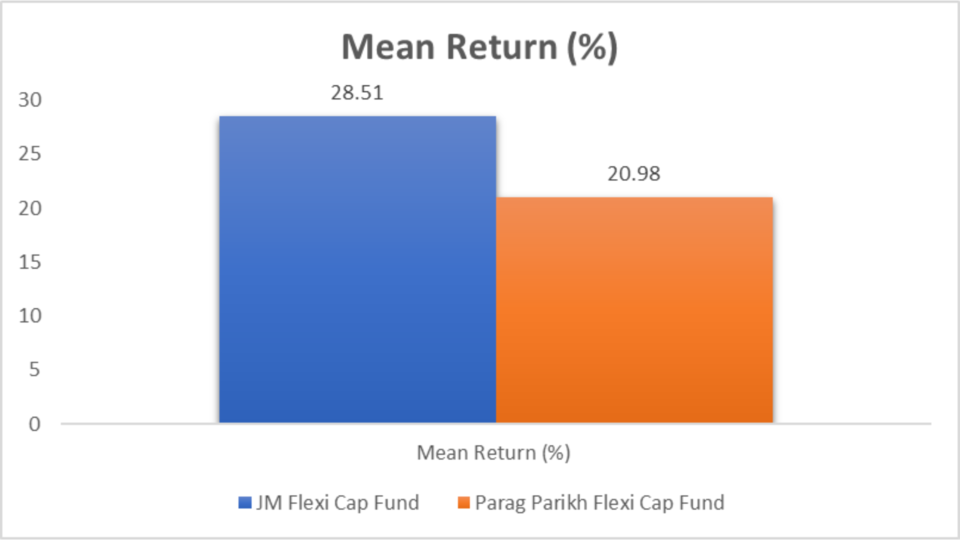
| Metric | JM Flexi Cap Fund | Parag Parikh Flexi Cap Fund |
| Mean Return (%) | 28.51 | 20.98 |
| Sortino Ratio (%) | 3.8 | 2.09 |
| Treynor’s Ratio (%) | 0.21 | 0.18 |

Detailed Data Analysis
Mean Return
- JM Flexi Cap Fund: 28.51%
- Parag Parikh Flexi Cap Fund: 20.98%
The mean Return indicates the average performance of a fund. JM Flexi Cap Fund has a higher mean return, suggesting it has provided better average returns than Parag Parikh Flexi Cap Fund.
Sortino Ratio
- JM Flexi Cap Fund: 3.8%
- Parag Parikh Flexi Cap Fund: 2.09%
The Sortino ratio measures the risk-adjusted Return, focusing on downside volatility. A higher Sortino ratio represents better risk-adjusted performance. JM Flexi Cap Fund’s higher Sortino ratio suggests it has managed downside risk more effectively than Parag Parikh Flexi Cap Fund.
Treynor’s Ratio
- JM Flexi Cap Fund: 0.21%
- Parag Parikh Flexi Cap Fund: 0.18%
Treynor’s Ratio assesses the Return per unit of market risk. A higher Treynor’s Ratio indicates better risk-adjusted returns. JM Flexi Cap Fund’s slightly higher Treynor’s Ratio suggests it has delivered better returns relative to market risk than Parag Parikh Flexi Cap Fund.
Key Takeaways
- Mean Return: JM Flexi Cap Fund has a higher mean return, indicating better average performance.
- Sortino Ratio: JM Flexi Cap Fund’s higher Sortino ratio suggests better risk-adjusted returns focused on downside protection.
- Treynor’s Ratio: JM Flexi Cap Fund has a slightly better Treynor’s Ratio, indicating superior returns relative to market risk.
Standard Deviation
Standard deviation represents the volatility of a fund’s returns. A lower standard deviation represents lower volatility and, thus, a more stable investment.
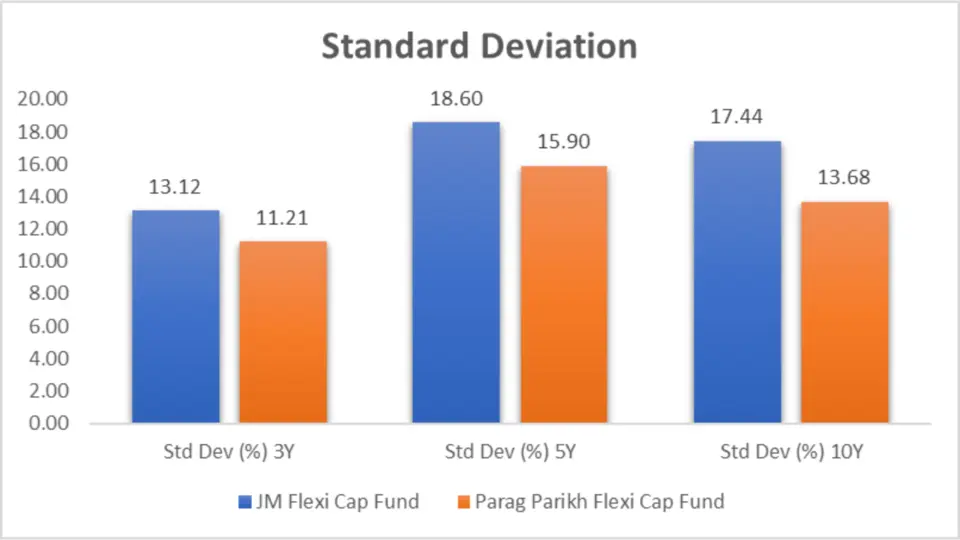
| Period | JM Flexi Cap Fund | Parag Parikh Flexi Cap Fund |
| Std Dev (%) 3Y | 13.12 | 11.21 |
| Std Dev (%) 5Y | 18.60 | 15.90 |
| Std Dev (%) 10Y | 17.44 | 13.68 |
Analysis
3-Year Standard Deviation
- JM Flexi Cap Fund: 13.12%
- Parag Parikh Flexi Cap Fund: 11.21%
Parag Parikh Flexi Cap Fund had a lower standard deviation than JM Flexi Cap Fund in the three years, indicating less volatility and a more stable performance.
5-Year Standard Deviation
- JM Flexi Cap Fund: 18.60%
- Parag Parikh Flexi Cap Fund: 15.90%
Over five years, Parag Parikh Flexi Cap Fund again demonstrated lower volatility with a standard deviation of 15.90% versus JM Flexi Cap Fund’s 18.60%.
10-Year Standard Deviation
- JM Flexi Cap Fund: 17.44%
- Parag Parikh Flexi Cap Fund: 13.68%
Over a decade, Parag Parikh Flexi Cap Fund maintained lower volatility, showing a standard deviation of 13.68% compared to JM Flexi Cap Fund’s 17.44%.
Key Takeaways
- Lower Volatility: Across all periods (3-year, 5-year, and 10-year), Parag Parikh Flexi Cap Fund exhibited lower standard deviation, indicating less volatility and a more stable performance than JM Flexi Cap Fund.
- Consistent Stability: Parag Parikh Flexi Cap Fund’s lower standard deviation over the 10 years (13.68% vs. 17.44%) highlights its consistent stability and lower risk for long-term investors.
- Better Risk Management: The consistently lower standard deviation of the Parag Parikh Flexi Cap Fund suggests better risk management and a smoother performance trajectory over different time frames.
Sharpe Ratio
The Sharpe ratio measures a fund’s risk-adjusted Return, with a higher Sharpe ratio indicating better performance per unit of risk.
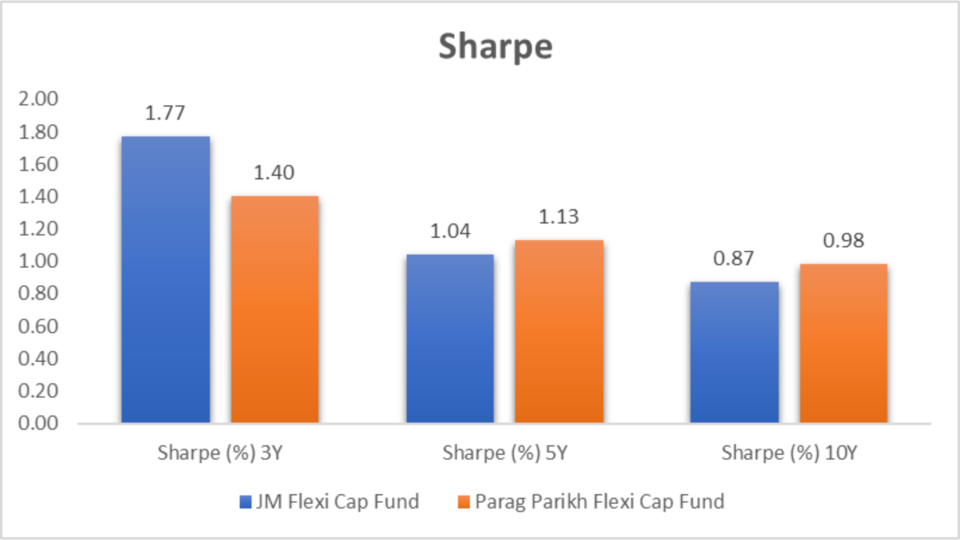
| Period | JM Flexi Cap Fund | Parag Parikh Flexi Cap Fund |
| Sharpe (%) 3Y | 1.77 | 1.40 |
| Sharpe (%) 5Y | 1.04 | 1.13 |
| Sharpe (%) 10Y | 0.87 | 0.98 |
Analysis
3-Year Sharpe Ratio
- JM Flexi Cap Fund: 1.77
- Parag Parikh Flexi Cap Fund: 1.40
Over the past three years, JM Flexi Cap Fund had a higher Sharpe ratio, indicating better risk-adjusted returns than Parag Parikh Flexi Cap Fund.
5-Year Sharpe Ratio
- JM Flexi Cap Fund: 1.04
- Parag Parikh Flexi Cap Fund: 1.13
Parag Parikh Flexi Cap Fund outperformed in the five years with a higher Sharpe ratio, suggesting better risk-adjusted performance than JM Flexi Cap Fund.
10-Year Sharpe Ratio
- JM Flexi Cap Fund: 0.87
- Parag Parikh Flexi Cap Fund: 0.98
Over a decade, Parag Parikh Flexi Cap Fund again demonstrated superior risk-adjusted returns with a higher Sharpe ratio.
Key Takeaways
- Higher Risk-Adjusted Returns (3Y): JM Flexi Cap Fund has a higher Sharpe ratio in the 3 years (1.77 vs. 1.40), indicating better risk-adjusted returns in the short term.
- Superior Mid and Long-term Performance: Parag Parikh Flexi Cap Fund shows better Sharpe ratios over the 5-year and 10-year periods (1.13 vs. 1.04 and 0.98 vs. 0.87), suggesting superior mid- and long-term risk-adjusted performance.
- Balanced Risk and Reward: The Sharpe ratio analysis underscores the balance between risk and reward for both funds. Parag Parikh Flexi Cap Fund generally offers better long-term risk-adjusted returns.
Beta
Beta represents the volatility of a fund relative to the market. A beta of one indicates that the fund’s price moves with the market, less than one means less volatility than the market, and more than 1 indicates higher volatility.

| Period | JM Flexi Cap Fund | Parag Parikh Flexi Cap Fund |
| Beta (%) 3Y | 0.91 | 0.70 |
| Beta (%) 5Y | 0.92 | 0.75 |
| Beta (%) 10Y | 0.97 | 0.70 |
Analysis
3-Year Beta
- JM Flexi Cap Fund: 0.91
- Parag Parikh Flexi Cap Fund: 0.70
Over the past three years, JM Flexi Cap Fund had a higher beta, indicating it is more volatile than Parag Parikh Flexi Cap Fund.
5-Year Beta
- JM Flexi Cap Fund: 0.92
- Parag Parikh Flexi Cap Fund: 0.75
In the five years, JM Flexi Cap Fund had a higher beta, suggesting greater volatility relative to the market than Parag Parikh Flexi Cap Fund.
10-Year Beta
- JM Flexi Cap Fund: 0.97
- Parag Parikh Flexi Cap Fund: 0.70
Over a decade, JM Flexi Cap Fund exhibited higher market volatility, with a beta of 0.97 compared to Parag Parikh Flexi Cap Fund’s 0.70.
Key Takeaways
- Lower Market Volatility: Parag Parikh Flexi Cap Fund consistently exhibited lower Beta across all periods, indicating less market volatility than JM Flexi Cap Fund.
- Stable Long-term Investment: With a beta of 0.70 over 10 years, Parag Parikh Flexi Cap Fund offers a more stable investment, less influenced by market fluctuations.
- Higher Volatility: JM Flexi Cap Fund shows higher beta values, suggesting it is more volatile. It may offer higher returns in a bullish market but poses a higher risk during market downturns.
Alpha
Alpha measures a fund’s performance relative to a benchmark index, with a positive alpha indicating outperformance and a negative alpha indicating underperformance.
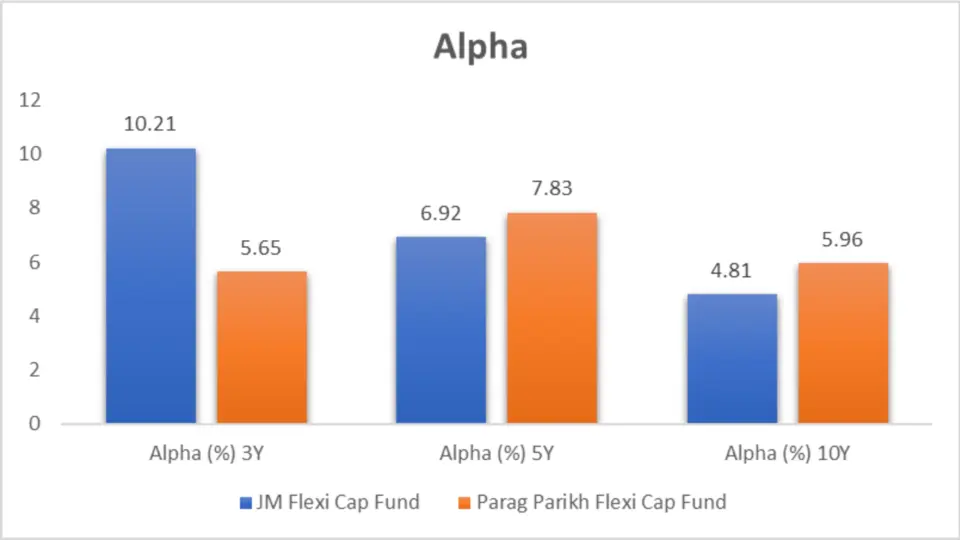
| Period | JM Flexi Cap Fund | Parag Parikh Flexi Cap Fund |
| Alpha (%) 3Y | 10.21 | 5.65 |
| Alpha (%) 5Y | 6.92 | 7.83 |
| Alpha (%) 10Y | 4.81 | 5.96 |
Detailed Analysis of Alpha
3-Year Alpha
- JM Flexi Cap Fund: 10.21
- Parag Parikh Flexi Cap Fund: 5.65
Over the past three years, JM Flexi Cap Fund had a higher alpha, indicating it significantly outperformed its benchmark index compared to Parag Parikh Flexi Cap Fund.
5-Year Alpha
- JM Flexi Cap Fund: 6.92
- Parag Parikh Flexi Cap Fund: 7.83
In the five years, Parag Parikh Flexi Cap Fund outperformed with a higher alpha, suggesting better performance relative to its benchmark than JM Flexi Cap Fund.
10-Year Alpha
- JM Flexi Cap Fund: 4.81
- Parag Parikh Flexi Cap Fund: 5.96
Key takeaways
- Higher Short-term Outperformance: JM Flexi Cap Fund has a higher alpha in the 3 years (10.21 vs. 5.65), indicating it significantly outperformed its benchmark index in the short term.
- Superior Mid and Long-term Outperformance: Parag Parikh Flexi Cap Fund shows better alphas over the 5-year and 10-year periods (7.83 vs. 6.92 and 5.96 vs. 4.81), suggesting superior performance relative to its mid and long-term benchmark.
- Consistent Benchmark Outperformance: The alpha analysis highlights Parag Parikh Flexi Cap Fund’s consistent ability to outperform its benchmark over more extended periods, making it a strong contender for long-term investors.
Ratings
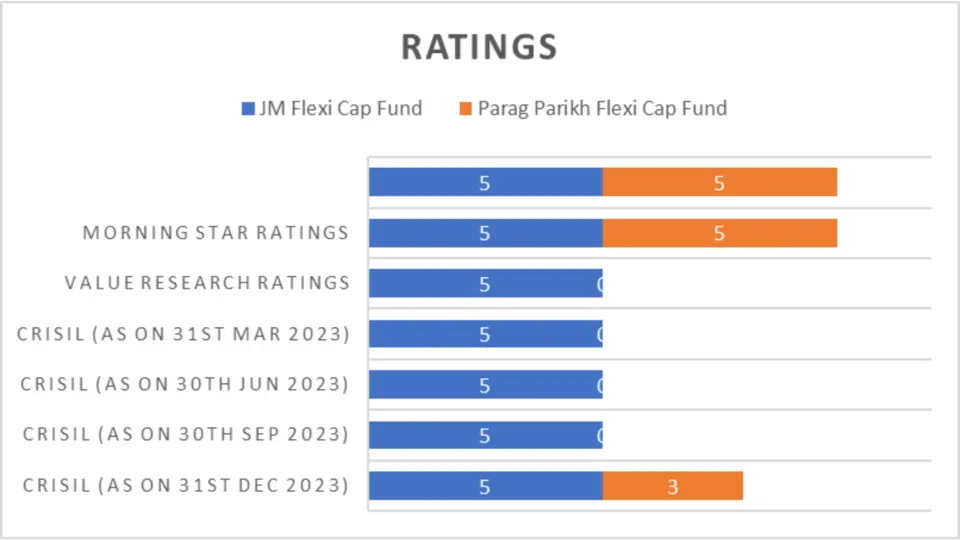
| Rating Agency | JM Flexi Cap Fund | Parag Parikh Flexi Cap Fund |
| CRISIL (31st Mar 2024) | 5 | 3 |
| CRISIL (December 31 2023) | 5 | NA |
| CRISIL (30th Sep 2023) | 5 | NA |
| CRISIL (30th Jun 2023) | 5 | NA |
| CRISIL (31st Mar 2023) | 5 | NA |
| Value Research Ratings | 5 | 5 |
| Morning Star Ratings | 5 | 5 |
Detailed Analysis of Ratings
CRISIL Ratings
- JM Flexi Cap Fund consistently received a rating of 5 from CRISIL over multiple quarters, indicating strong performance and stability.
- Parag Parikh Flexi Cap Fund had a CRISIL rating of 3 as of March 2024, with no ratings for previous quarters, suggesting potential areas for improvement.
Value Research and Morning Star Ratings
- Both funds received top ratings (5) from Value Research and Morning Star, highlighting their overall excellence and reliability in the market.
Key Takeaways
- Consistent High Ratings: JM Flexi Cap Fund consistently received high ratings from CRISIL, Value Research, and Morning Star, highlighting its strong performance and stability.
- Parag Parikh Flexi Cap Fund has room for improvement in CRISIL ratings but is highly rated by Value Research and Morning Star.
Portfolio Analysis
Portfolio Overlapping Comparison
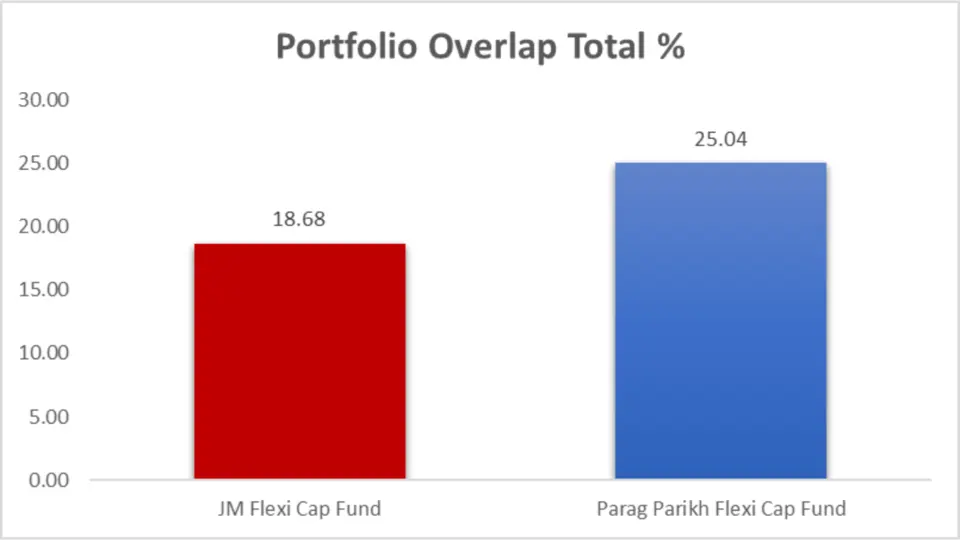
| Fund | Portfolio Overlap Total % |
| JM Flexi Cap Fund | 18.68 |
| Parag Parikh Flexi Cap Fund | 25.04 |
Analysis
- JM Flexi Cap Fund has a lower portfolio overlap percentage (18.68%), indicating a more distinct selection of investments than Parag Parikh Flexi Cap Fund.
- Parag Parikh Flexi Cap Fund shows a higher portfolio overlap (25.04%), suggesting a more similar investment strategy to other funds in the market.
Key Takeaways
- Lower Portfolio Overlap: JM Flexi Cap Fund has a lower portfolio overlap percentage, indicating a more distinct investment strategy.
- Balanced Portfolio: Parag Parikh Flexi Cap Fund includes debt and foreign equity holdings, offering a balanced risk profile.
Portfolio Composition
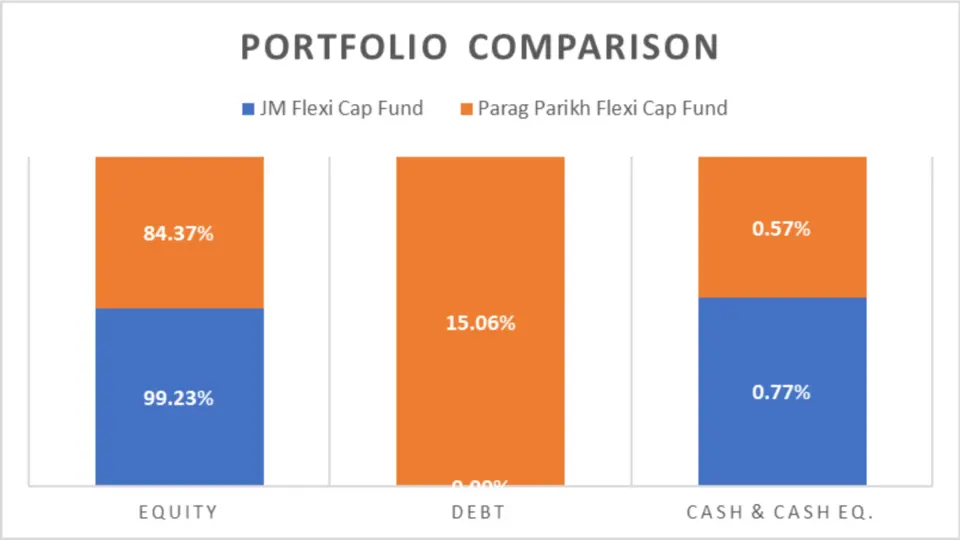
| Category | JM Flexi Cap Fund | Parag Parikh Flexi Cap Fund |
| Equity | 99.23% | 84.37% |
| Debt | 0.00% | 15.06% |
| Cash & Cash Equivalents | 0.77% | 0.57% |
Analysis
Equity Allocation
- JM Flexi Cap Fund has a higher equity allocation (99.23%), focusing predominantly on stocks for growth.
- Parag Parikh Flexi Cap Fund has a lower equity allocation (84.37%) and includes a significant portion of debt (15.06%), providing a balanced risk profile.
Key Takeaways
- Lower Portfolio Overlap: JM Flexi Cap Fund has a lower portfolio overlap percentage, indicating a more distinct investment strategy.
- Balanced Portfolio: Parag Parikh Flexi Cap Fund includes debt and foreign equity holdings, offering a balanced risk profile.
Market Cap Allocation
Market Cap Allocation Comparison Table
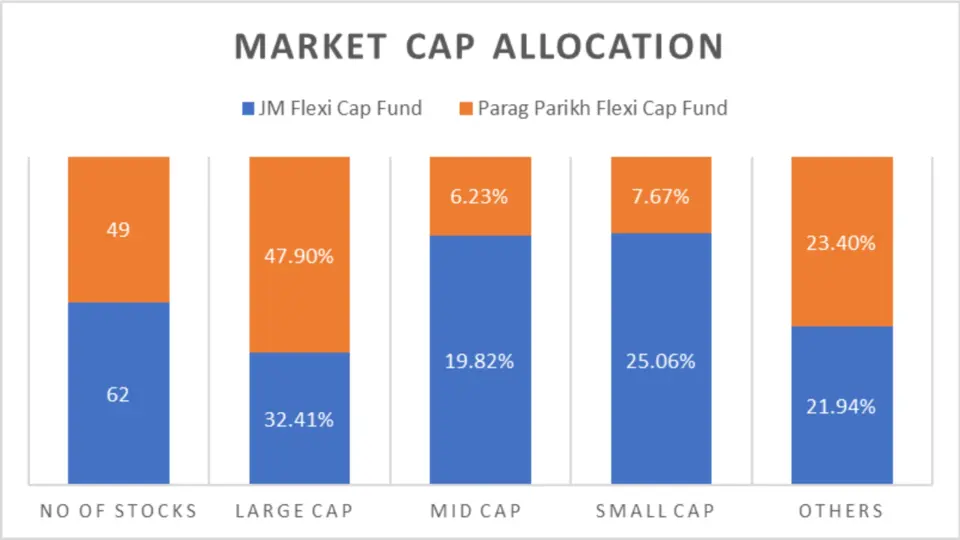
| Category | JM Flexi Cap Fund | Parag Parikh Flexi Cap Fund |
| Number of Stocks | 62 | 49 |
| Large Cap | 32.41% | 47.90% |
| Mid Cap | 19.82% | 6.23% |
| Small Cap | 25.06% | 7.67% |
| Others | 21.94% | 23.40% |
| Foreign Equity Holdings | 0.00% | 14.13% |
Analysis
Number of Stocks
- JM Flexi Cap Fund holds more stocks (62) than Parag Parikh Flexi Cap Fund (49), indicating a broader diversification strategy.
Large Cap Focus
- Parag Parikh Flexi Cap Fund has a higher allocation to large-cap stocks (47.90%), suggesting a focus on established companies with stable growth.
- JM Flexi Cap Fund has a more balanced approach with significant investments in mid-cap (19.82%) and small-cap (25.06%) stocks.
Foreign Equity Holdings
- Parag Parikh Flexi Cap Fund includes a notable portion of foreign equity holdings (14.13%), providing international exposure.
- JM Flexi Cap Fund does not have foreign equity holdings but maintains a domestic focus.
Key Takeaways
- Broader Diversification: JM Flexi Cap Fund holds more stocks and has a balanced allocation across large-cap, mid-cap, and small-cap stocks.
- Higher Large Cap Focus: Parag Parikh Flexi Cap Fund focuses more on large-cap and foreign equities, suggesting a preference for established and international companies.
Sector Allocation
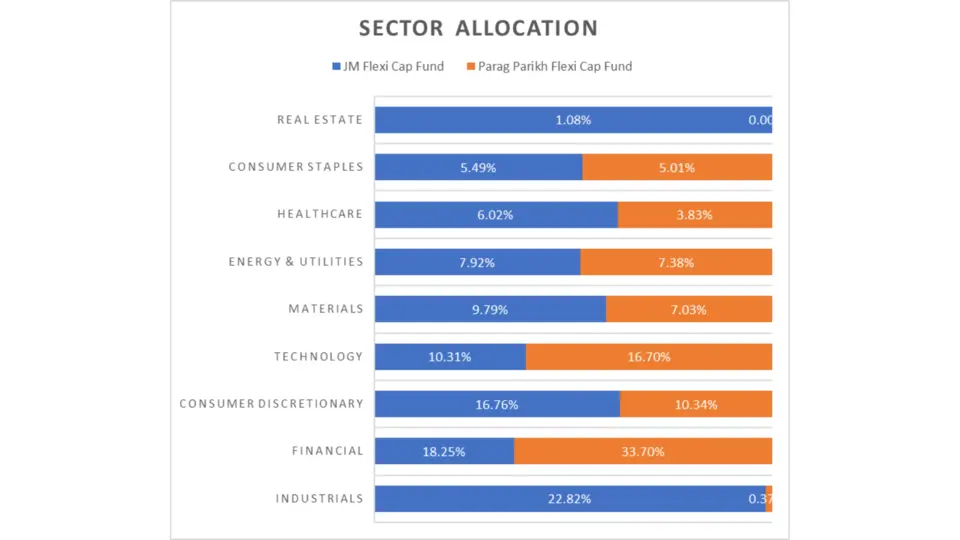
| Sector | JM Flexi Cap Fund | Parag Parikh Flexi Cap Fund |
| Industrials | 22.82% | 0.37% |
| Financial | 18.25% | 33.70% |
| Consumer Discretionary | 16.76% | 10.34% |
| Technology | 10.31% | 16.70% |
| Materials | 9.79% | 7.03% |
| Energy & Utilities | 7.92% | 7.38% |
| Healthcare | 6.02% | 3.83% |
| Consumer Staples | 5.49% | 5.01% |
| Real Estate | 1.08% | NA |
| Diversified | 0.79% | NA |
Analysis
Industrials and Financial Sectors
- JM Flexi Cap Fund has a significant allocation to industrials (22.82%) and financial sectors (18.25%), focusing on industrial growth and economic stability.
- Parag Parikh Flexi Cap Fund heavily invests in the financial sector (33.70%), suggesting confidence in financial services and banking.
Technology and Consumer Discretionary
- Parag Parikh Flexi Cap Fund has a higher allocation to technology (16.70%), reflecting a solid belief in tech growth.
- JM Flexi Cap Fund balances its portfolio with consumer discretionary (16.76%) and technology (10.31%).
Key Takeaways
- Sector Diversification: JM Flexi Cap Fund invests significantly in industrials and financials, while Parag Parikh Flexi Cap Fund focuses on financials and technology.
- International Exposure: Parag Parikh Flexi Cap Fund includes foreign equity holdings, providing additional diversification and exposure to global markets.
Fund Management Comparison
The experience and stability of fund managers can significantly impact a fund’s performance. Here’s a comparison of the fund managers for both funds.
Fund Management Comparison Table
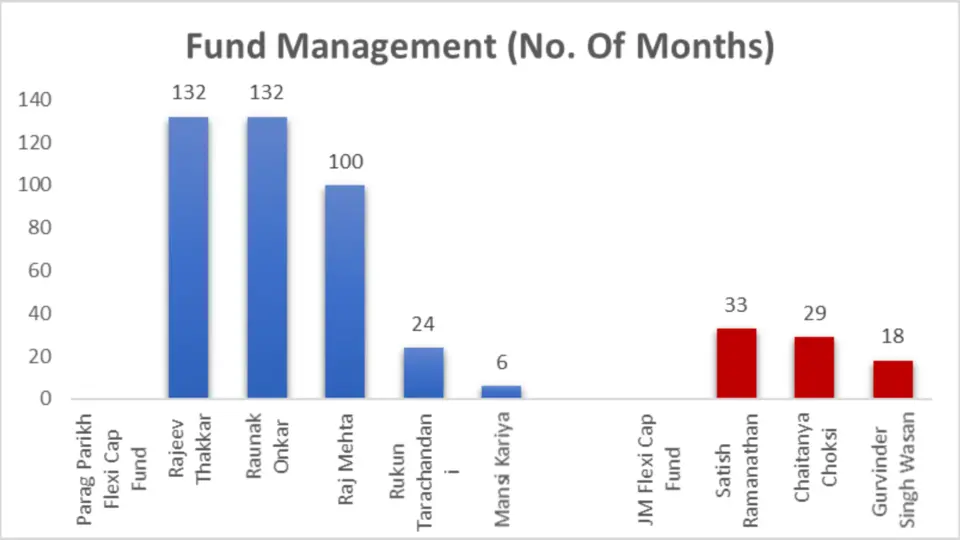
| Fund | Fund Manager | No. Of Months |
| Parag Parikh Flexi Cap Fund | Rajeev Thakkar | 132 |
| Raunak Onkar | 132 | |
| Raj Mehta | 100 | |
| Rukun Tarachandani | 24 | |
| Mansi Kariya | 6 | |
| JM Flexi Cap Fund | Satish Ramanathan | 33 |
| Chaitanya Choksi | 29 | |
| Gurvinder Singh Wasan | 18 |
Analysis
Experience and Stability
- Parag Parikh Flexi Cap Fund benefits from highly experienced fund managers like Rajeev Thakkar and Raunak Onkar, each with 132 months of experience, providing stability and consistent strategy.
- JM Flexi Cap Fund has relatively newer managers. Satish Ramanathan has 33 months of experience, followed by Chaitanya Choksi and Gurvinder Singh Wasan.
Key takeaways
- Experienced Managers: Parag Parikh Flexi Cap Fund benefits from highly experienced fund managers with long tenures, ensuring stability.
- Newer Management: JM Flexi Cap Fund has relatively newer managers, which may bring fresh perspectives but less historical stability
Other Important General Details
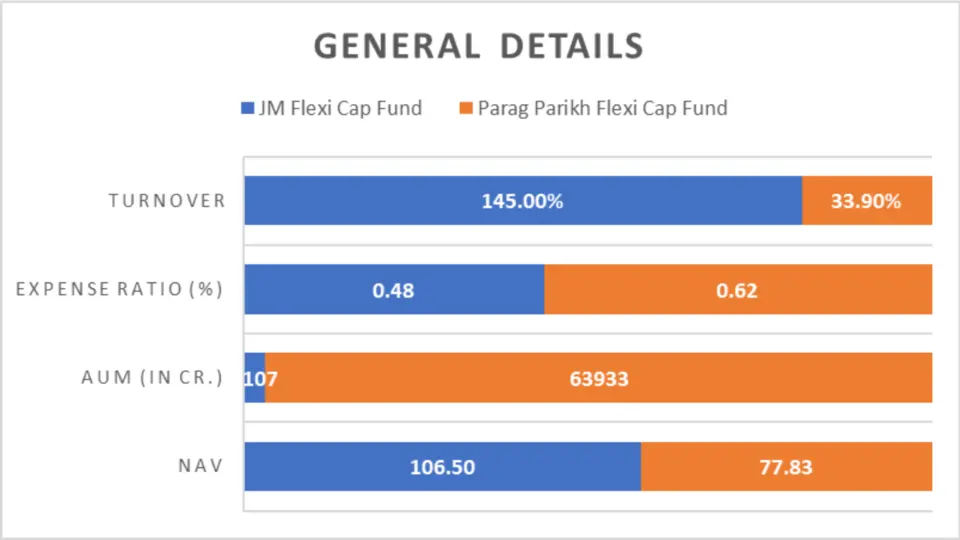
| Metric | JM Flexi Cap Fund | Parag Parikh Flexi Cap Fund |
| NAV | 106.50 | 77.83 |
| AUM (in Cr.) | 2107 | 63933 |
| Expense Ratio (%) | 0.48 | 0.62 |
| Turnover | 145.00% | 33.90% |
| Benchmark | S&P BSE 500 – TRI | NIFTY 500 – TRI |
Analysis
NAV and AUM
- JM Flexi Cap Fund has a higher NAV (106.50) than Parag Parikh Flexi Cap Fund (77.83).
- Parag Parikh Flexi Cap Fund has a significantly larger AUM (63933 Cr.) than JM Flexi Cap Fund (2107 Cr.), indicating greater investor confidence and a more extensive capital base.
Expense Ratio and Turnover
- JM Flexi Cap Fund has a lower expense ratio (0.48%), making it more cost-effective for investors.
- Parag Parikh Flexi Cap Fund has a lower turnover (33.90%), indicating a more stable and less frequently changing portfolio.
Key takeaways
- Lower Expense Ratio: JM Flexi Cap Fund offers a lower expense ratio, making it more cost-effective.
- Higher AUM: Parag Parikh Flexi Cap Fund has a significantly larger AUM, indicating strong investor confidence.
Conclusion
The JM Flexi Cap Fund generally outperforms the Parag Parikh Flexi Cap Fund in terms of short-term and mid-term returns, portfolio diversification, and cost-effectiveness due to its lower expense ratio. It is particularly suitable for investors with a higher risk appetite looking for robust short-term gains and active management.
On the other hand, the Parag Parikh Flexi Cap Fund excels in long-term consistency, lower volatility, and international exposure, making it a better choice for conservative investors seeking stable, risk-adjusted returns over the long term. Investors should align their choices with their financial goals and risk tolerance. JM Flexi Cap Fund is the better pick for aggressive growth. Parag Parikh Flexi Cap Fund offers balanced, stable growth with lower risk.

We hope you found this guide on mutual funds helpful.
If you have any mutual fund-related queries, feel free to comment below—we’re here to help! S.K. Singh, a registered professional with the Association of Mutual Funds in India (AMFI), will answer your queries and holds the ARN-251149.
Invest wisely!
FAQs: JM Flexi Cap Fund vs Parag Parikh Flexi Cap Fund
What are Flexi Cap Funds?
Flexi Cap Funds are mutual funds that invest in companies across various market capitalizations—large-cap, mid-cap, and small-cap—based on the fund manager’s assessment of the best opportunities. They offer flexibility and diversification to manage risks and maximize returns.
How do JM Flexi Cap Fund and Parag Parikh Flexi Cap Fund differ in investment style?
JM Flexi Cap Fund and Parag Parikh Flexi Cap Fund follow a growth investment style, focusing on companies expected to mature at an above-average rate. These funds typically invest in companies reinvesting their earnings into expansion, acquisitions, or research and development.
Which fund has better short-term performance?
The JM Flexi Cap Fund has demonstrated superior short-term performance with significantly higher returns over 1-3 years than the Parag Parikh Flexi Cap Fund.
How do the funds compare in terms of mid-term performance?
Over five years, the performance gap between the two funds narrows, with JM Flexi Cap Fund holding a slight edge. Both funds perform quite closely, indicating competitive mid-term returns.
What are the long-term performance trends for these funds?
Over a decade, both JM Flexi Cap Fund and Parag Parikh Flexi Cap Fund perform similarly, with JM Flexi Cap Fund having a marginally better return. Both funds show strong and consistent long-term performance
How does the lumpsum investment value differ between the two funds?
JM Flexi Cap Fund generally outperforms in terms of lumpsum investment value, especially in the short term. The gap narrows over five years, and both funds show strong growth over ten years, with JM Flexi Cap Fund slightly ahead.
What is the performance comparison for SIP investments?
JM Flexi Cap Fund has demonstrated superior returns in the short and mid-term for SIP investments. Over ten years, both funds have shown strong growth, with JM Flexi Cap Fund holding a slight edge in cumulative returns.
Which fund has better risk-adjusted returns?
JM Flexi Cap Fund generally has better risk-adjusted returns in the short term, as indicated by the higher mean Return and Sortino Ratio. Parag Parikh Flexi Cap Fund shows better mid- and long-term risk-adjusted performance, as reflected in Sharpe and Treynor’s ratios.
How do the funds compare in terms of volatility?
Parag Parikh Flexi Cap Fund consistently exhibits lower volatility, indicated by a lower standard deviation across all periods (3-year, 5-year, and 10-year), suggesting more stable performance than JM Flexi Cap Fund.
What does the Beta comparison reveal about these funds?
Parag Parikh Flexi Cap Fund has a consistently lower Beta, indicating less market volatility and a more stable investment than JM Flexi Cap Fund, which shows higher volatility.
How do the Alpha values compare for these funds?
JM Flexi Cap Fund has a higher Alpha in the short term, indicating significant outperformance of its benchmark index. Parag Parikh Flexi Cap Fund shows superior mid and long-term outperformance, making it a strong contender for long-term investors.
Which fund has better ratings from agencies?
JM Flexi Cap Fund consistently receives high ratings from CRISIL, Value Research, and Morning Star, indicating strong performance and stability. Parag Parikh Flexi Cap Fund has high-value Research and Morning Star ratings but shows room for improved CRISIL ratings.
How do the funds compare in terms of portfolio overlap?
JM Flexi Cap Fund has a lower portfolio overlap percentage, indicating a more distinct investment strategy. Parag Parikh Flexi Cap Fund has a higher portfolio overlap, suggesting a similar approach to other market funds.
What is the market cap allocation for these funds?
JM Flexi Cap Fund has a balanced allocation across large-cap, mid-cap, and small-cap stocks with broader diversification. Parag Parikh Flexi Cap Fund focuses more on large-cap and foreign equities, providing a preference for established and international companies.
How do the funds differ in sector allocation?
JM Flexi Cap Fund invests significantly in industrial and financial sectors, while Parag Parikh Flexi Cap Fund focuses on financials and technology sectors. Parag Parikh Flexi Cap Fund also includes foreign equity holdings, providing international exposure.
What are the differences in fund management between the two funds?
Parag Parikh Flexi Cap Fund benefits from highly experienced fund managers with long tenures, ensuring stability. JM Flexi Cap Fund has relatively newer managers, which may bring fresh perspectives but less historical stability.
How do the funds compare regarding general details like NAV, AUM, and expense ratio?
JM Flexi Cap Fund has a higher NAV and a lower expense ratio, making it more cost-effective. Parag Parikh Flexi Cap Fund has a significantly larger AUM, indicating strong investor confidence and a more extensive capital base.
Which fund suits investors with a higher risk appetite?
JM Flexi Cap Fund is ideal for investors with a higher risk appetite, offering robust short-term gains and higher volatility.
Which fund is better for conservative investors seeking stable, long-term returns?
Parag Parikh Flexi Cap Fund is better for conservative investors seeking stable, long-term returns with lower volatility and consistent performance.
Based on the overall analysis, which fund is better in all parameters?
Both funds have their strengths, but JM Flexi Cap Fund generally outperforms in short and mid-term returns. At the same time, Parag Parikh Flexi Cap Fund excels in long-term stability, lower volatility, and risk-adjusted returns. Investors should choose based on their specific financial goals and risk tolerance.
Disclaimer:
The information provided in this article is solely the author/advertisers’ opinion and not investment advice – it is provided for educational purposes only. Using this, you agree that the information does not constitute any investment or financial instructions by Ace Equity Research/Mutual Fund Focus/IPO First and the team. Anyone wishing to invest should seek their own independent financial or professional advice. Conduct your research with registered financial advisors before making any investment decisions. Ace Equity Research/ Mutual Fund Focus / IPO First and the team are not accountable for the investment views provided in the article.
Mutual Fund investments are subject to market risks. Read all scheme-related documents carefully.
Investments in the securities market are subject to market risks. Read all the related documents carefully before investing