If you are planning to invest in Midcap funds and need clarification on Nippon India Growth Fund vs Quant Mid Cap Fund. In that case, this blog will help you resolve all your doubts. Here, we will dive deep into a five-step comprehensive comparative analysis of these two Midcap mutual funds. This is to help you choose the most consistent and best Midcap mutual funds for your long-term investment portfolio by investing in the fund that has done well consistently over the period in terms of better risk-adjusted returns and Alpha generation.
Investment Style
| Fund | Investment Style |
| Nippon India Growth Fund | Blend |
| Quant Mid Cap Fund | Blend |
Nippon India Growth Fund and Quant Mid Cap Fund adopt a blend of investment styles. This approach combines growth and value investing features, providing a balanced exposure to different investment strategies. This style is ideal for investors looking for a mix of stability and growth potential in their midcap investments.

Returns Analysis
Trailing Returns
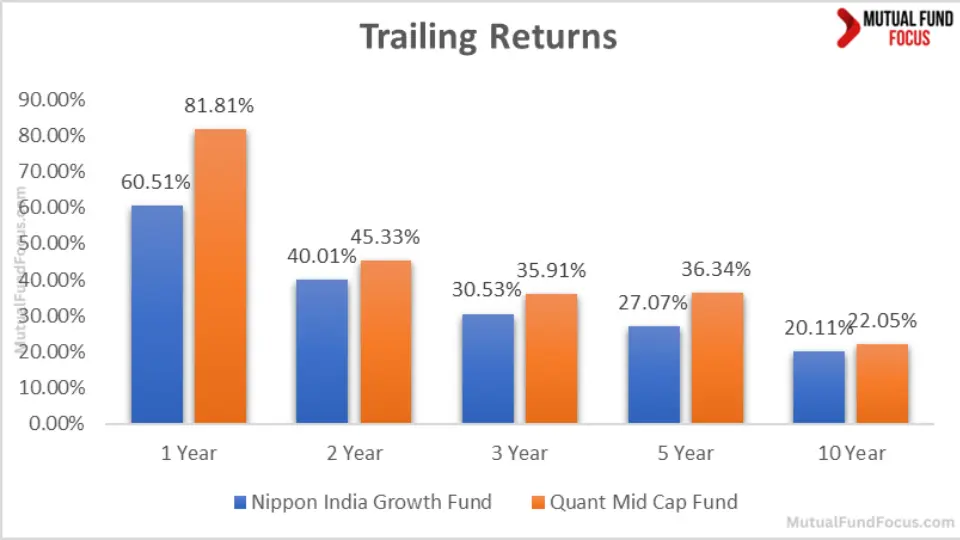
| Period Invested for | Nippon India Growth Fund | Quant Mid Cap Fund |
| 1 Year | 60.51% | 81.81% |
| 2 Years | 40.01% | 45.33% |
| 3 Years | 30.53% | 35.91% |
| 5 Years | 27.07% | 36.34% |
| 10 Years | 20.11% | 22.05% |
Analysis
- 1-Year Returns: Quant Mid Cap Fund has significantly outperformed Nippon India Growth Fund with a whopping 81.81% return compared to Nippon’s 60.51%. This indicates a solid short-term performance for Quant Mid Cap Fund.
- 2-Year Returns: Quant Mid Cap Fund still leads with 45.33% against Nippon’s 40.01%. Though the gap narrows, Quant Mid Cap Fund maintains its edge.
- 3-Year Returns: Quant Mid Cap Fund shows 35.91%, outperforming Nippon’s 30.53%. Over this period, Quant’s strategy seems to deliver more consistent results.
- 5-Year Returns: Quant Mid Cap Fund has 36.34%, while Nippon trails with 27.07%. This substantial difference highlights Quant’s strong performance over the medium term.
- 10-Year Returns: The gap narrows further, with Quant at 22.05% and Nippon at 20.11%. This suggests that Quant has been a strong performer, but Nippon also offers solid long-term returns.
Key Takeaways
- Short-Term Growth: Quant Mid Cap Fund demonstrates stronger short-term growth than Nippon India Growth Fund.
- Consistency: Quant Mid Cap Fund shows consistent outperformance over 2, 3, and 5 years.
- Medium-Term Returns: Quant’s strategy pays off well in the medium term, showcasing higher returns.
- Long-Term Performance: Quant maintains an edge over a decade, indicating robust long-term growth.
Lumpsum Investment Value
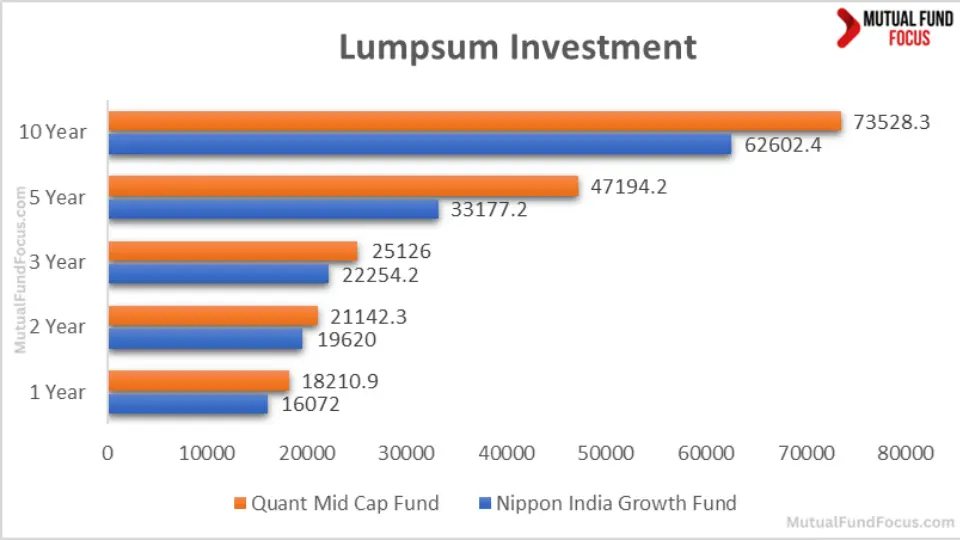
| Period Invested for | Nippon India Growth Fund | Quant Mid Cap Fund |
| 1 Year | ₹ 16,072 | ₹ 18,210.9 |
| 2 Years | ₹ 19,620 | ₹ 21,142.3 |
| 3 Years | ₹ 22,254.2 | ₹ 25,126 |
| 5 Years | ₹ 33,177.2 | ₹ 47,194.2 |
| 10 Years | ₹ 62,602.4 | ₹ 73,528.3 |
Analysis
- 1-Year Investment Value: A lumpsum investment in Quant Mid Cap Fund grows to ₹ 18,210.9, compared to ₹ 16,072 in Nippon India Growth Fund. Quant shows a stronger growth trajectory, even in the short term.
- 2-Year Investment Value: After two years, Quant Mid Cap Fund’s investment value reaches ₹ 21,142.3, outperforming Nippon’s ₹ 19,620. The consistency in Quant’s performance is evident.
- 3-Year Investment Value: Quant Mid Cap Fund continues to lead with ₹ 25,126 against Nippon’s ₹ 22,254.2. Quant’s blend strategy appears to pay off over this period.
- 5-Year Investment Value: The difference becomes more pronounced over five years, with Quant at ₹ 47,194.2 and Nippon at ₹ 33,177.2. Quant’s strong medium-term returns are straightforward.
- 10-Year Investment Value: Over a decade, Quant Mid Cap Fund’s investment value is ₹ 73,528.3, compared to Nippon’s ₹ 62,602.4. While both funds show substantial growth, Quant maintains its edge.
Key Takeaways
- Short-Term Growth: Quant Mid Cap Fund demonstrates more robust short-term growth than Nippon India Growth Fund.
- Consistency: Quant Mid Cap Fund shows consistent outperformance over 2, 3, and 5 years.
- Medium-Term Returns: Quant’s strategy pays off well in the medium term, showcasing higher returns.
- Long-Term Performance: Quant maintains an edge over a decade, indicating robust long-term growth.
SIP Returns Analysis
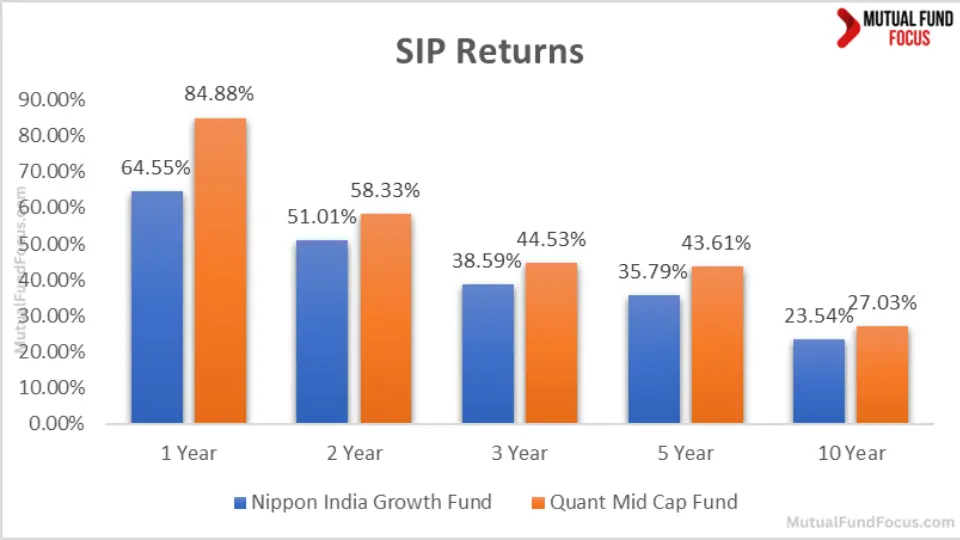
| Period Invested for | Nippon India Growth Fund | Quant Mid Cap Fund |
| 1 Year | 64.55% | 84.88% |
| 2 Years | 51.01% | 58.33% |
| 3 Years | 38.59% | 44.53% |
| 5 Years | 35.79% | 43.61% |
| 10 Years | 23.54% | 27.03% |
Analysis
- 1-Year SIP Returns: Quant Mid Cap Fund leads with 84.88% compared to Nippon’s 64.55%. This shows Quant’s impressive short-term performance.
- 2-Year SIP Returns: Quant maintains an edge with 58.33% over Nippon’s 51.01%.
- 3-Year SIP Returns: Quant’s 44.53% outperforms Nippon’s 38.59%, indicating better mid-term consistency.
- 5-Year SIP Returns: Quant Mid Cap Fund delivers 43.61% compared to Nippon’s 35.79%.
- 10-Year SIP Returns: Quant leads again with 27.03%, showing better long-term SIP performance than Nippon’s 23.54%.
Key Takeaways
- Short-Term Performance: Quant Mid Cap Fund’s SIP returns significantly outshine Nippon’s, indicating short-term solid performance.
- Mid-Term Consistency: Quant maintains a consistent performance edge over 2 and 3 years.
- Long-Term SIP Returns: Quant’s SIP returns show superior performance over a decade, making it a solid choice for long-term SIP investors.
SIP Investment Value

| Period Invested for | Investments | Nippon India Growth Fund | Quant Mid Cap Fund |
| 1 Year | ₹ 12,000 | ₹ 17,327.28 | ₹ 16,980.7 |
| 2 Years | ₹ 24,000 | ₹ 39,787.43 | ₹ 40,083.01 |
| 3 Years | ₹ 36,000 | ₹ 64,060.7 | ₹ 66,774.88 |
| 5 Years | ₹ 60,000 | ₹ 147,135.9 | ₹ 171,947.85 |
| 10 Years | ₹ 120,000 | ₹ 422,895.26 | ₹ 503,847.01 |
Analysis
- 1-Year SIP Investment Value: Nippon India Growth Fund slightly leads with ₹ 17,327.28 over Quant’s ₹ 16,980.7.
- 2-Year SIP Investment Value: Quant takes the lead with ₹ 40,083.01 compared to Nippon’s ₹ 39,787.43.
- 3-Year SIP Investment Value: Quant maintains a higher value of ₹ 66,774.88 over Nippon’s ₹ 64,060.7.
- 5-Year SIP Investment Value: Quant’s investment value is ₹ 171,947.85, significantly higher than Nippon’s ₹ 147,135.9.
- 10-Year SIP Investment Value: Quant Mid Cap Fund leads with ₹ 503,847.01 compared to Nippon’s ₹ 422,895.26.
Key Takeaways
- Initial Investment Lead: Nippon leads slightly in the 1-year SIP investment value.
- Mid to Long-Term Advantage: Quant consistently outperforms Nippon in SIP investment value over 2, 3, 5, and 10 years.
- Significant Long-Term Returns: Quant’s superior performance over a decade makes it a better choice for long-term SIP investors.
CAGR (Compound Annual Growth Rate)

| Category | 1 Year | 3 Years | 5 Years | 9 Years |
| Nippon India Growth Fund | 54.04% | 28.57% | 25.65% | 17.91% |
| Quant Mid Cap Fund | 73.43% | 32.55% | 33.24% | 19.57% |
Analysis
- 1-Year CAGR: Quant Mid Cap Fund has a higher CAGR of 73.43% compared to Nippon’s 54.04%, indicating superior short-term growth.
- 3-Year CAGR: Quant’s 32.55% outperforms Nippon’s 28.57%.
- 5-Year CAGR: Quant leads with 33.24% over Nippon’s 25.65%.
- 9-Year CAGR: Quant Mid Cap Fund shows a higher CAGR of 19.57% compared to Nippon’s 17.91%.
Key Takeaways
- Superior Short-Term Growth: Quant Mid Cap Fund shows higher short-term growth than Nippon.
- Consistent Outperformance: Quant maintains higher CAGR over 3 and 5 years, demonstrating consistent outperformance.
- Long-Term CAGR Advantage: Over 9 years, Quant’s CAGR has surpassed Nippon’s, making it a solid long-term investment choice.
Rolling Returns

| Category | 1 Year | 3 Years | 5 Years | 9 Years |
| Nippon India Growth Fund | 23.78% | 19.12% | 16.36% | 18.64% |
| Quant Mid Cap Fund | 24.10% | 19.26% | 16.39% | 18.34% |
Analysis
- 1-Year Rolling Returns: Quant Mid Cap Fund slightly leads with 24.10% over Nippon’s 23.78%.
- 3-Year Rolling Returns: Quant’s 19.26% edges out Nippon’s 19.12%.
- 5-Year Rolling Returns: Both funds show similar returns, with Quant at 16.39% and Nippon at 16.36%.
- 9-Year Rolling Returns: Nippon slightly leads with 18.64% over Quant’s 18.34%.
Key Takeaways
- Close Competition: Quant and Nippon show close competition in rolling returns across all periods.
- Slight Edge: Quant maintains a slight edge in short-term and mid-term rolling returns.
- Long-Term Performance: Nippon edges out Quant in long-term rolling returns, making it a competitive choice.
Annualized/Calendar Year Returns
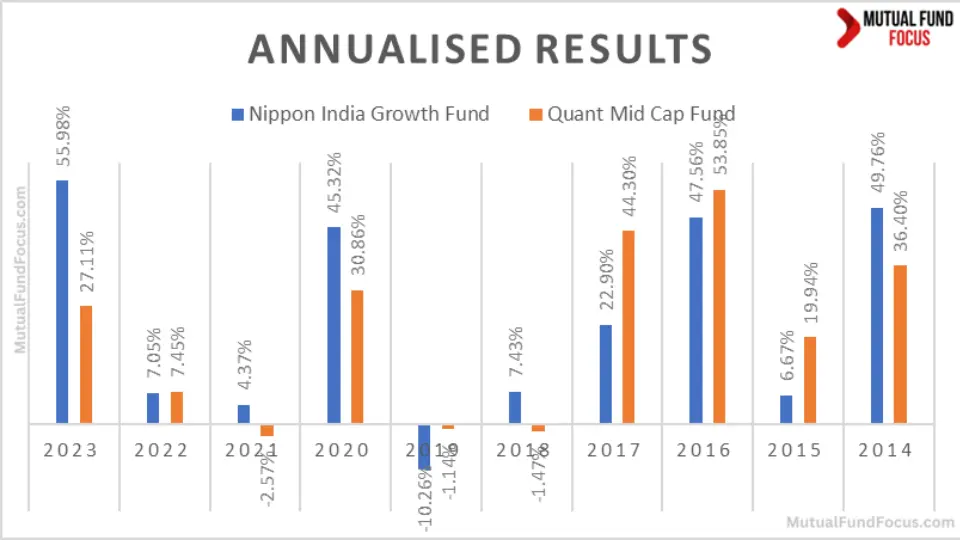
| Period | Nippon India Growth Fund | Quant Mid Cap Fund |
| 2023 | 55.98% | 27.11% |
| 2022 | 7.05% | 7.45% |
| 2021 | 4.37% | -2.57% |
| 2020 | 45.32% | 30.86% |
| 2019 | -10.26% | -1.14% |
| 2018 | 7.43% | -1.47% |
| 2017 | 22.90% | 44.30% |
| 2016 | 47.56% | 53.85% |
| 2015 | 6.67% | 19.94% |
| 2014 | 49.76% | 36.40% |
Analysis
- 2023 Performance: Nippon India Growth Fund significantly outperformed Quant Mid Cap Fund with a return of 55.98% compared to Quant’s 27.11%.
- 2022 Performance: Both funds showed similar performance, with Quant slightly leading at 7.45% over Nippon’s 7.05%.
- 2021 Performance: Nippon outperformed Quant with 4.37%, while Quant showed a negative return of -2.57%.
- 2020 Performance: Both funds performed well, but Nippon led with 45.32% over Quant’s 30.86%.
- 2019 Performance: Both funds experienced negative returns, with Nippon at -10.26% and Quant at -1.14%.
- 2018 Performance: Nippon showed a positive return of 7.43%, while Quant had a negative return of -1.47%.
- 2017 Performance: Quant significantly outperformed Nippon with a return of 44.30% compared to Nippon’s 22.90%.
- 2016 Performance: Both funds performed well, with Quant leading at 53.85% over Nippon’s 47.56%.
- 2015 Performance: Quant outperformed Nippon with 19.94% compared to 6.67%.
- 2014 Performance: Nippon led with a return of 49.76% over Quant’s 36.40%.
Key Takeaways
- Short-Term Performance: Nippon showed significant outperformance in 2023 and 2020, indicating short-term solid returns.
- Consistent Performance: Quant has consistently demonstrated more consistency, especially in 2017 and 2016.
- Negative Years: Both funds had negative returns in specific years, but Quant’s negative returns were less severe than Nippon’s.
- Overall Returns: Nippon’s total Return over the period is higher at 236.78% compared to Quant’s 214.73%.
Best Quarters
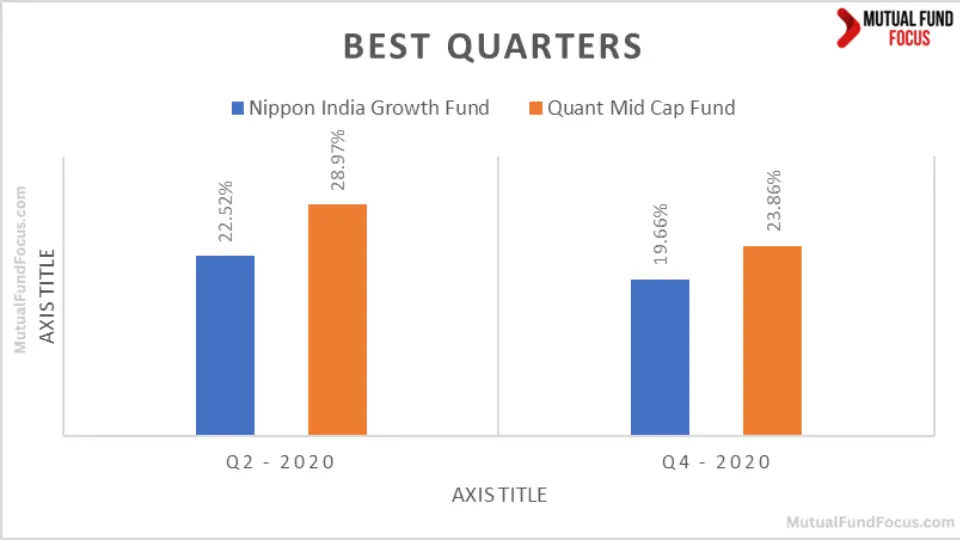
| Period | Nippon India Growth Fund | Quant Mid Cap Fund |
| Q2 – 2020 | 22.52% | 28.97% |
| Q4 – 2020 | 19.66% | 23.86% |
Analysis
- Q2 – 2020: Quant Mid Cap Fund outperformed Nippon with 28.97% compared to Nippon’s 22.52%.
- Q4 – 2020: Quant led again with 23.86% over Nippon’s 19.66%.
Key Takeaways
- Superior Performance: Quant Mid Cap Fund performed in the best quarters.
- Consistent Outperformance: Quant consistently outperformed Nippon in the best-performing quarters.
Worst Quarters

| Period | Nippon India Growth Fund | Quant Mid Cap Fund |
| Q1 – 2020 | -27.07% | -21.28% |
| Q2 – 2022 | -8.82% | -12.53% |
Analysis
- Q1 – 2020: Both funds experienced significant negative returns, with Nippon at -27.07% and Quant at -21.28%.
- Q2 – 2022: Nippon outperformed Quant, showing a smaller negative return of -8.82% compared to Quant’s -12.53%.
Key Takeaways
- Negative Performance: Both funds experienced significant losses in the worst quarters.
- Relative Stability: Nippon showed relative stability with smaller negative returns in the worst quarters.
Quarterly Results
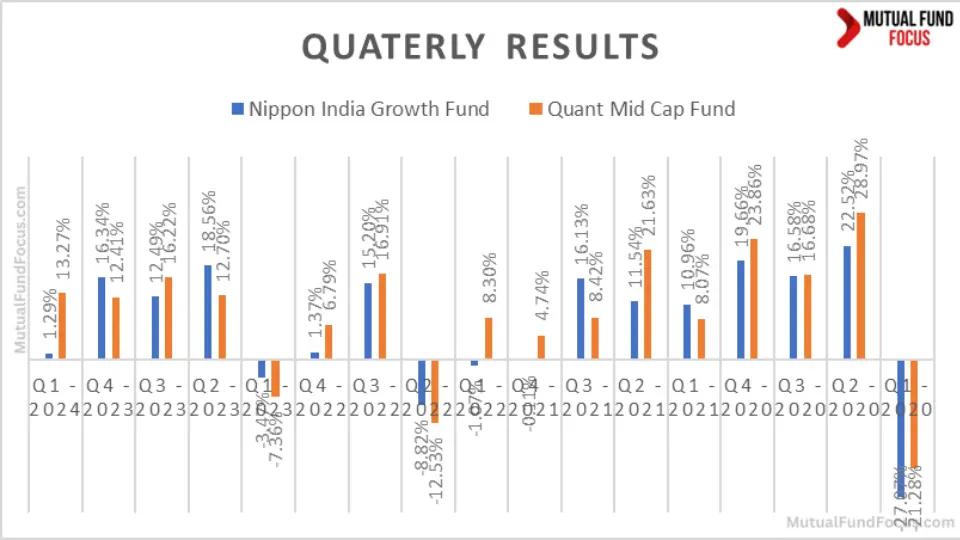
| Period | Nippon India Growth Fund | Quant Mid Cap Fund |
| Q1 – 2024 | 1.29% | 13.27% |
| Q4 – 2023 | 16.34% | 12.41% |
| Q3 – 2023 | 12.49% | 16.22% |
| Q2 – 2023 | 18.56% | 12.70% |
| Q1 – 2023 | -3.47% | -7.36% |
| Q4 – 2022 | 1.37% | 6.79% |
| Q3 – 2022 | 15.20% | 16.91% |
| Q2 – 2022 | -8.82% | -12.53% |
| Q1 – 2022 | -1.07% | 8.30% |
| Q4 – 2021 | -0.11% | 4.74% |
| Q3 – 2021 | 16.13% | 8.42% |
| Q2 – 2021 | 11.54% | 21.63% |
| Q1 – 2021 | 10.96% | 8.07% |
| Q4 – 2020 | 19.66% | 23.86% |
| Q3 – 2020 | 16.58% | 16.68% |
| Q2 – 2020 | 22.52% | 28.97% |
| Q1 – 2020 | -27.07% | -21.28% |
Analysis
- Recent Performance: In Q1 – 2024, Quant significantly outperformed Nippon with 13.27% compared to Nippon’s 1.29%.
- Q4 – 2023: Nippon led 16.34% over Quant’s 12.41%.
- Q3 – 2023: Quant outperformed Nippon with 16.22% compared to 12.49%.
- Q2 – 2023: Nippon led with 18.56% over Quant’s 12.70%.
- Worst Quarter: Both funds had their worst performance in Q1 – 2020, with Nippon at -27.07% and Quant at -21.28%.
Key Takeaways
- Recent Outperformance: Quant Mid Cap Fund showed recent outperformance in the latest quarter.
- Inconsistent Performance: Both funds exhibited periods of outperformance and underperformance in different quarters.
- Worst Performance: Both funds had significant negative returns in their worst quarters, with Quant showing less severe losses.
Risk Analysis
Maximum Drawdown
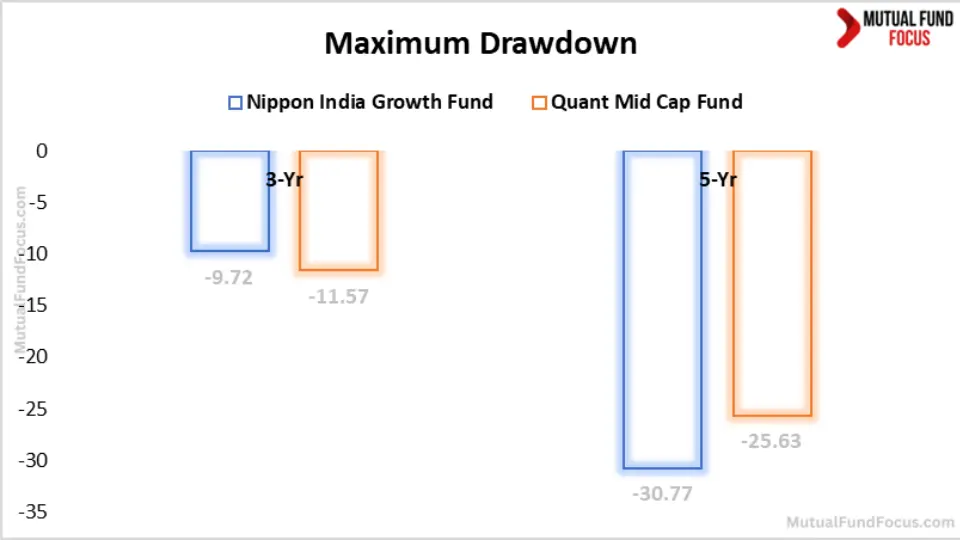
Maximum Drawdown Analysis
| Fund | 3-Year | 5-Year |
| Nippon India Growth Fund | -9.72 | -30.77 |
| Quant Mid Cap Fund | -11.57 | -25.63 |
Analysis
- 3-Year Drawdown: Nippon had a lower maximum drawdown of -9.72% compared to Quant’s -11.57%.
- 5-Year Drawdown: Quant had a lower maximum drawdown of -25.63% compared to Nippon’s -30.77%.
Key Takeaways
- Short-Term Stability: Nippon shows better short-term stability with a lower 3-year drawdown.
- Long-Term Stability: Quant shows better long-term stability with a lower 5-year drawdown.
Mean Return, Treynor’s Ratio & Sortino Ratio
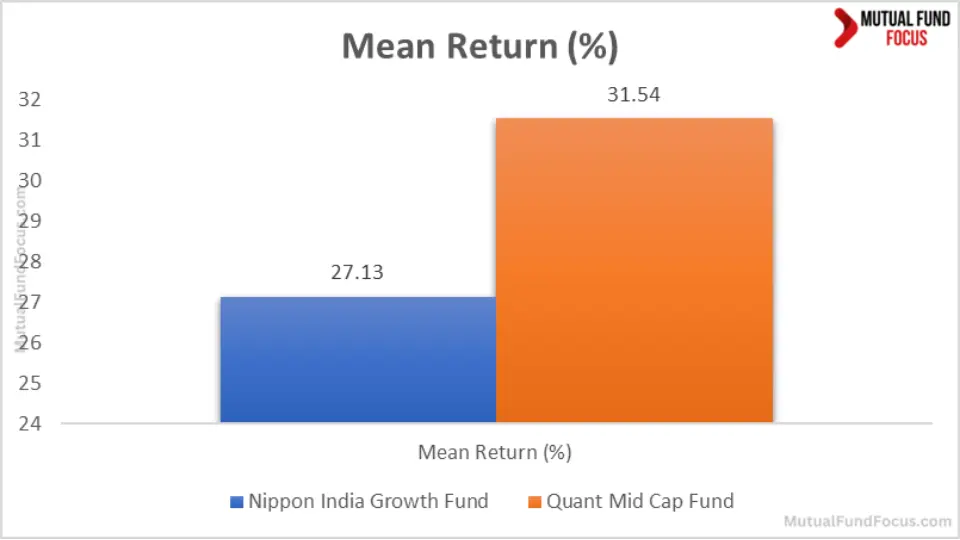
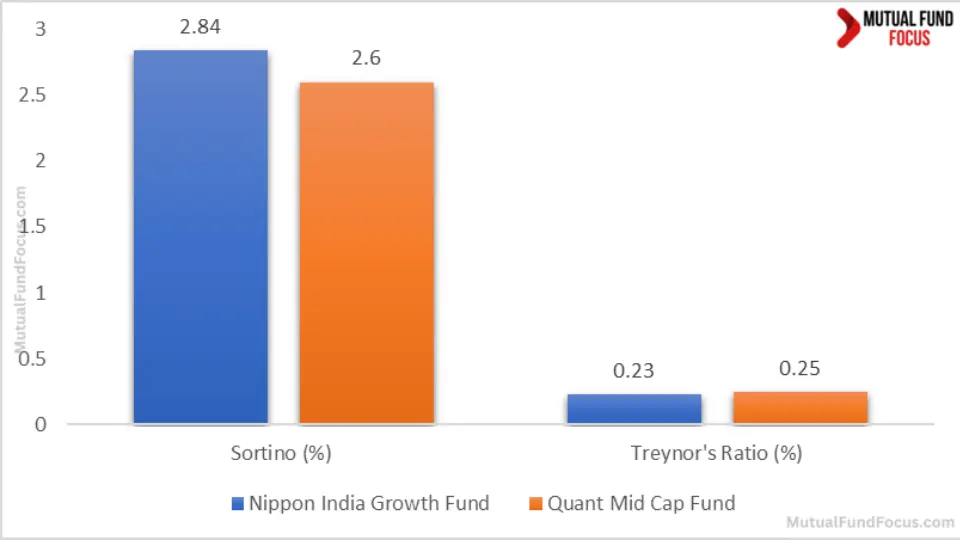
| Risk Analysis | Nippon India Growth Fund | Quant Mid Cap Fund |
| Mean Return (%) | 27.13 | 31.54 |
| Sortino Ratio (%) | 2.84 | 2.60 |
| Treynor’s Ratio (%) | 0.23 | 0.25 |
Analysis
Let’s break down these metrics to see what they mean for your investment strategy.
Mean Return
The mean Return indicates the average performance of the fund. With Quant Mid Cap Fund leading at 31.54%, it suggests higher returns than Nippon India Growth Fund’s 27.13%. However, higher returns often arise higher risk, which we’ll examine next.
Sortino Ratio
The Sortino Ratio helps us understand the risk-adjusted Return, focusing on negative volatility. Nippon India Growth Fund’s higher Sortino Ratio (2.84%) shows it has better-managed downside risk than Quant Mid Cap Fund (2.60%).
Treynor’s Ratio
Treynor’s Ratio assesses Return per unit of market risk. Quant Mid Cap Fund’s slightly higher Ratio (0.25% vs. 0.23%) suggests it provides better returns for the risk undertaken. Interactive and
Key Takeaways
- Nippon India Growth Fund: Offers a balanced approach with decent returns and efficient downside risk management. Ideal for investors seeking steady growth with controlled risk.
- Quant Mid Cap Fund: Delivers higher returns with a marginally higher risk, making it suitable for those willing to take on more risk for greater rewards.
Standard Deviation
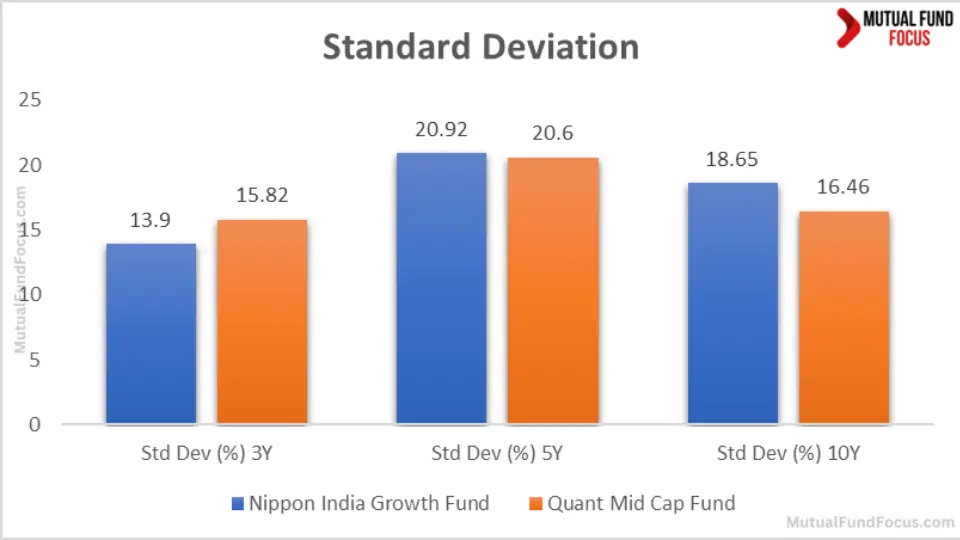
Here’s a consolidated view of the standard deviation across different time frames for both funds:
| Std Dev (%) | Nippon India Growth Fund | Quant Mid Cap Fund |
| 3Y | 13.9 | 15.82 |
| 5Y | 20.92 | 20.6 |
| 10Y | 18.65 | 16.46 |
Analysis
3-Year Standard Deviation
The 3-year standard deviation reflects the recent volatility of the funds. Nippon India Growth Fund’s lower deviation (13.9%) indicates less short-term risk than Quant Mid Cap Fund (15.82%).
5-Year Standard Deviation
For the 5 years, both funds show moderate volatility, with the Nippon India Growth Fund slightly more volatile at 20.92% compared to the Quant Mid Cap Fund at 20.6%.
10-Year Standard Deviation
Over a decade, the standard deviation of Quant Mid Cap Fund (16.46%) is lower than that of Nippo.
Key Takeaways
- Nippon India Growth Fund: Exhibits lower short-term volatility, making it a better choice for risk-averse investors looking for moderate growth.
- Quant Mid Cap Fund: Shows higher short-term volatility but stabilizes significantly over the long term, making it suitable for long-term investors seeking higher returns.
Sharpe Ratio
| Sharpe Ratio (%) | Nippon India Growth Fund | Quant Mid Cap Fund |
| 3 Years | 1.55 | 1.65 |
| 5 Years | 1.01 | 1.35 |
| 10 Years | 0.77 | 0.93 |
Analysis
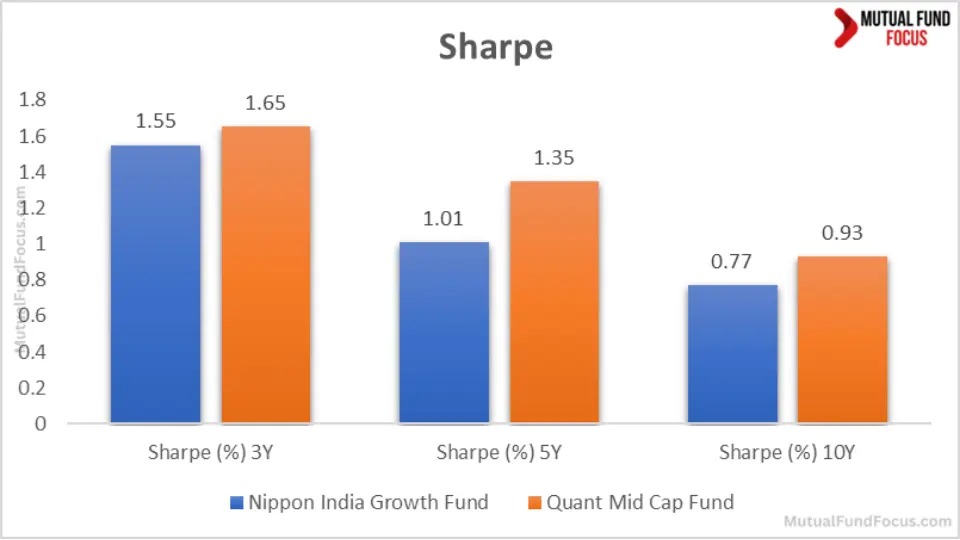
- 3-Year Sharpe Ratio: Quant Mid Cap Fund has a higher 3-year Sharpe Ratio of 1.65 compared to Nippon’s 1.55, indicating better risk-adjusted returns over this period.
- 5-Year Sharpe Ratio: Over 5 years, Quant Mid Cap Fund continues to outperform with a Sharpe Ratio of 1.35 against Nippon’s 1.01.
- 10-Year Sharpe Ratio: Quant maintains its edge over 10 years with a Sharpe Ratio of 0.93 compared to Nippon’s 0.77.
Key Takeaways
- Superior Risk-Adjusted Returns: Quant consistently shows higher Sharpe ratios, indicating better risk-adjusted returns.
- Long-Term Advantage: Quant maintains an advantage in risk-adjusted returns over extended periods.
Beta
| Beta (%) | Nippon India Growth Fund | Quant Mid Cap Fund |
| 3 Years | 0.90 | 0.91 |
| 5 Years | 0.96 | 0.86 |
| 10 Years | 0.95 | 0.73 |
Analysis
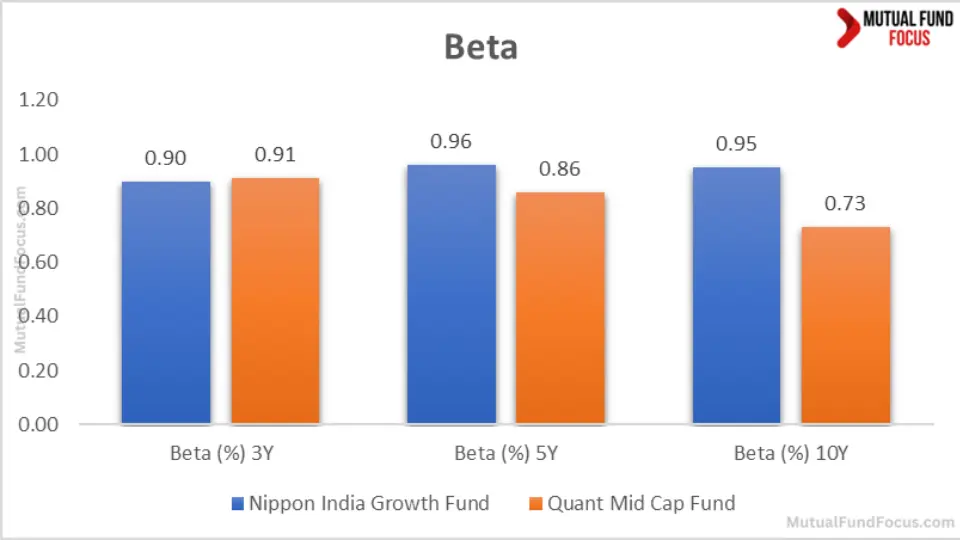
- 3-Year Beta: Both funds show similar market volatility over 3 years, with Nippon at 0.90 and Quant at 0.91.
- 5-Year Beta: Over 5 years, Quant shows lower volatility with a Beta of 0.86 compared to Nippon’s 0.96.
- 10-Year Beta: Quant exhibits significantly lower market volatility over 10 years with a Beta of 0.73 compared to Nippon’s 0.95.
Key Takeaways
- Lower Volatility: Quant’s lower Beta values indicate lower market volatility, making it a potentially more stable investment.
- Long-Term Stability: Quant’s significantly lower Beta over 10 years suggests better long-term stability.
Alpha
| Alpha (%) | Nippon India Growth Fund | Quant Mid Cap Fund |
| 3 Years | 4.18 | 8.3 |
| 5 Years | 2.32 | 11.23 |
| 10 Years | 1.63 | 5.6 |
Analysis

- 3-Year Alpha: Quant Mid Cap Fund shows a higher Alpha of 8.3 compared to Nippon’s 4.18, indicating better performance than the benchmark over this period.
- 5-Year Alpha: Over 5 years, Quant’s Alpha is significantly higher at 11.23 compared to Nippon’s 2.32.
- 10-Year Alpha: Quant maintains its advantage over 10 years with an Alpha of 5.6 compared to Nippon’s 1.63.
Key Takeaways
- Superior Performance: Quant consistently demonstrates higher Alpha values, indicating better performance than the benchmark.
- Long-Term Outperformance: Quant’s higher Alpha over more extended periods suggests sustained outperformance.
Ratings
Fund Ratings
| Rating Agency | Nippon India Growth Fund | Quant Mid Cap Fund |
| CRISIL (Mar 2024) | 4 | 5 |
| CRISIL (Dec 2023) | 5 | 4 |
| CRISIL (Sep 2023) | 4 | 4 |
| CRISIL (Jun 2023) | 4 | 4 |
| CRISIL (Mar 2023) | 3 | 5 |
| Value Research Ratings | 4 | 5 |
| Morning Star Ratings | 4 | 5 |
Analysis
- CRISIL Ratings: Both funds have fluctuating CRISIL ratings, but Quant Mid Cap Fund generally scores higher.
- Value Research Ratings: Quant has a higher rating of 5 than Nippon’s 4.
- Morning Star Ratings: Quant also scores higher, rating 5 compared to Nippon’s 4.
Key Takeaways
- Higher Ratings: Quant Mid Cap Fund receives ratings from various rating agencies.
- Consistent Performance: Higher ratings reflect consistent performance and investor confidence.
Portfolio Analysis
Portfolio Overlapping Comparison
| Metric | Nippon India Growth Fund | Quant Mid Cap Fund |
| Portfolio Overlap Total | 5.30% | 27.36% |
Analysis
- Portfolio Overlap: Quant Mid Cap Fund has a higher portfolio overlap, indicating more common holdings with other funds.
Key Takeaways
- Higher Overlap: Quant’s higher portfolio overlap suggests it shares more common holdings with other funds.
Portfolio Comparison
| Metric | Nippon India Growth Fund | Quant Mid Cap Fund |
| Equity | 98.73% | 96.22% |
| Debt | 0.01% | 3.44% |
| Cash & Cash Equivalents | 1.26% | 0.34% |
Analysis
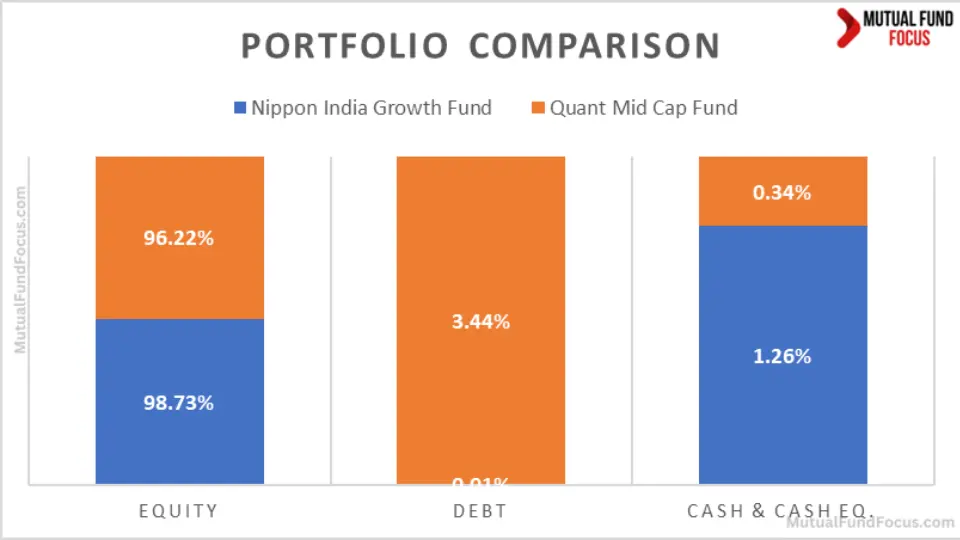
- Equity Allocation: Nippon has a higher equity allocation at 98.73% compared to Quant’s 96.22%.
- Debt Allocation: Quant allocates 3.44% to debt, while Nippon has a negligible debt allocation.
Key Takeaways
- Higher Equity Allocation: Nippon has a higher focus on equity.
- Debt Allocation: Quant includes a small portion of debt for diversification.
Market Cap Allocation
| Metric | Nippon India Growth Fund | Quant Mid Cap Fund |
| Number of Stocks | 96 | 32 |
| Large Cap | 13.98% | 43.79% |
| Mid Cap | 51.60% | 31.86% |
| Small Cap | 11.75% | 15.91% |
| Others | 22.05% | 5.85% |
Analysis
- Stock Diversification: Nippon holds more stocks (96) than Quant (32).
- Large Cap Allocation: Quant has a higher allocation to large caps at 43.79% compared to Nippon’s 13.98%.
- Mid-Cap Allocation: Nippon focuses more on mid-caps, with 51.60% compared to Quant’s 31.86%.
- Small Cap Allocation: Quant has a higher small cap allocation at 15.91% compared to Nippon’s 11.75%.
Key Takeaways
- Higher Diversification: Nippon’s broader stock base indicates higher diversification.
- Significant Cap Focus: Quant’s higher large-cap allocation suggests focusing on more stable, established companies.
- Mid-Cap Focus: Nippon’s focus on mid-caps aligns with its growth strategy.
Sector Allocation
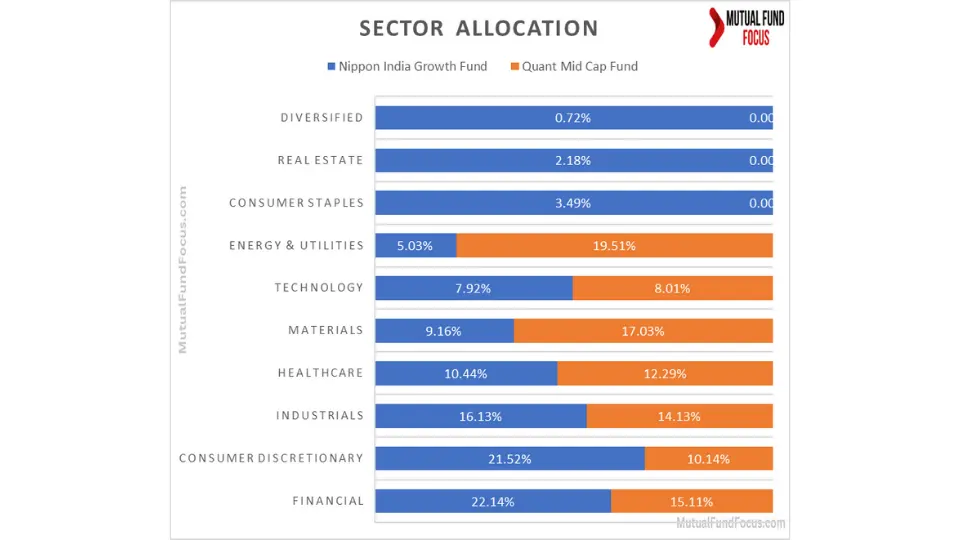
| Sector | Nippon India Growth Fund | Quant Mid Cap Fund |
| Financial | 22.14% | 15.11% |
| Consumer Discretionary | 21.52% | 10.14% |
| Industrials | 16.13% | 14.13% |
| Healthcare | 10.44% | 12.29% |
| Materials | 9.16% | 17.03% |
| Technology | 7.92% | 8.01% |
| Energy & Utilities | 5.03% | 19.51% |
Analysis
- Sector Focus: Nippon has higher allocations in the Financial and Consumer Discretionary sectors, while Quant focuses more on Materials, Energy & Utilities.
- Diversification: Both funds have diversified sector allocations but with different focuses.
Key Takeaways
- Sector Preferences: Nippon prefers the Financial and Consumer Discretionary sectors, while Quant focuses on Materials, Energy & Utilities.
- Diversified Allocations: Both funds maintain diversified sector allocations, aligning with their investment strategies.
Fund Management Comparison

| Fund | Fund Manager | No. of Months |
| Quant Mid Cap Fund | Sanjeev Sharma | 89 |
| Vasav Sahgal | 60 | |
| Ankit A. Pande | 49 | |
| Nippon India Growth Fund | Kinjal Desai | 65 |
| Rupesh Patel | 18 | |
| Sanjay Doshi | 18 |
Analysis
- Experience: Sanjeev Sharma of Quant Mid Cap Fund has the longest tenure among the fund managers, indicating potentially more stability and experience in fund management.
- Team Structure: Quant Mid Cap Fund’s management team has combined experience, which can contribute to diverse investment strategies.
Key Takeaways
- Experienced Management: Quant Mid Cap Fund benefits from more experienced fund managers.
- Diverse Management Team: Quant’s management team’s combined experience suggests a well-rounded approach to fund management.
Other Important General Details
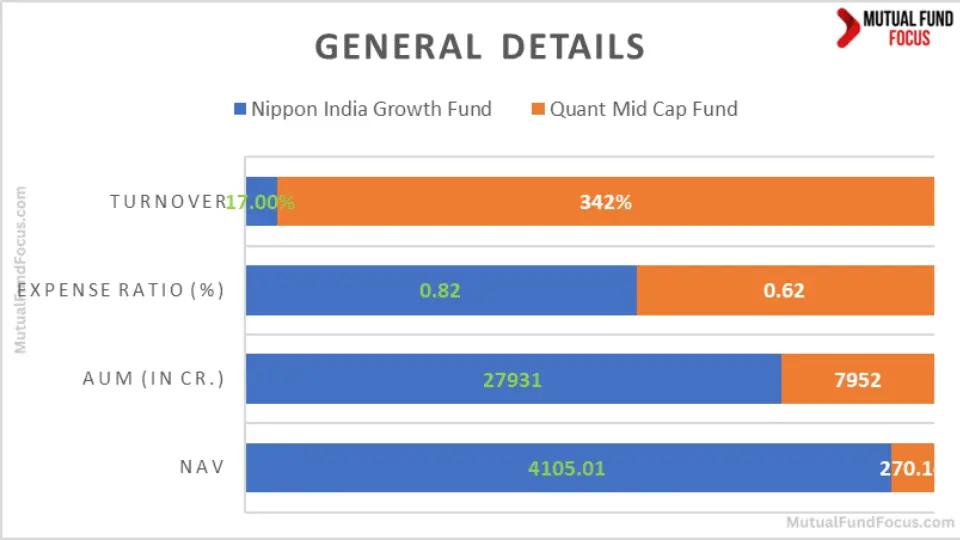
| Metric | Nippon India Growth Fund | Quant Mid Cap Fund |
| NAV | ₹ 4105.01 | ₹ 270.14 |
| AUM (in Cr.) | 27931 | 7952 |
| Expense Ratio (%) | 0.82 | 0.62 |
| Turnover | 17.00% | 342% |
| Benchmark | Nifty Midcap 150 – TRI | Nifty Midcap 150 – TRI |
Analysis
- NAV and AUM: Nippon India Growth Fund has a higher NAV and AUM, indicating more assets under management.
- Expense Ratio: Quant Mid Cap Fund has a lower expense ratio, making it slightly more cost-effective.
- Turnover: Quant’s higher turnover rate suggests more active trading and potentially higher transaction costs.
Key Takeaways
- Higher Assets: Nippon’s higher NAV and AUM suggest more significant investor confidence.
- Cost Efficiency: Quant’s lower expense ratio makes it more cost-effective for investors.
- Active Trading: Quant’s higher turnover rate indicates a more active trading strategy.
Minimum Investment Amount
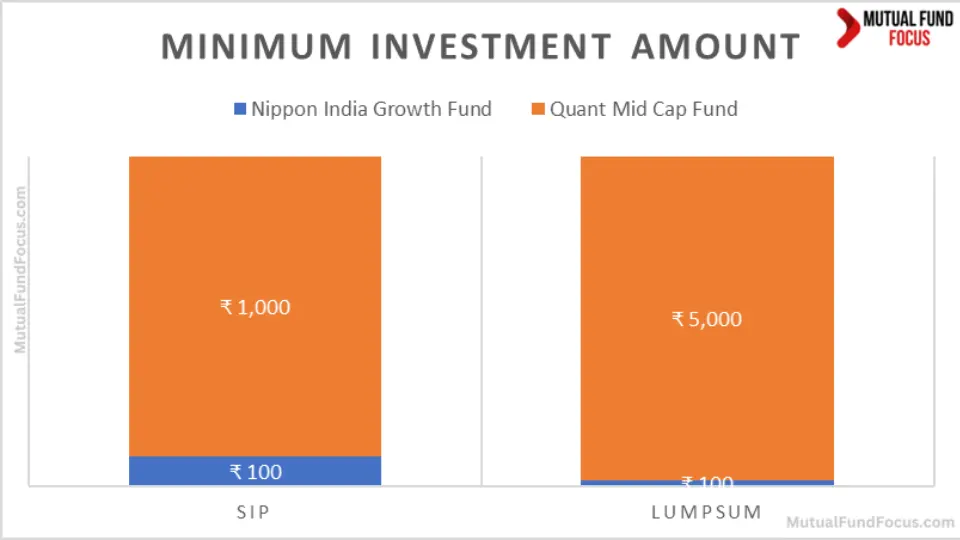
| Investment Type | Nippon India Growth Fund | Quant Mid Cap Fund |
| SIP | ₹ 100 | ₹ 1,000 |
| Lumpsum | ₹ 100 | ₹ 5,000 |
Analysis
- SIP: Nippon India Growth Fund requires a lower minimum SIP amount, making it more accessible to small investors.
- Lumpsum: Nippon also requires a lower minimum lumpsum investment than Quant Mid Cap Fund.
Key Takeaways
- Accessibility: Nippon India Growth Fund is more accessible for small investors due to its lower minimum investment requirements.
- Flexibility: Nippon’s lower minimum investment amounts provide more flexibility for investors with varying budgets.
Conclusion
Suppose you plan to invest in midcap funds and are torn between the Quant Mid Cap Fund and Nippon India Growth Fund. This analysis aims to clear your doubts by comparing these two funds across various critical parameters.
Both funds blend growth and value investing styles, providing balanced exposure to strategies. Quant Mid Cap Fund generally outperforms Nippon India Growth Fund regarding mean returns, SIP returns, and long-term standard deviation, making it the superior choice for mutual fund investors with a higher risk tolerance seeking robust returns. It consistently shows stronger short-term and long-term performance, evidenced by higher returns and favorable ratings.
Conversely, Nippon India Growth Fund excels in managing downside risk (higher Sortino Ratio) and offers more stability in the short term with lower minimum investment requirements, making it ideal for conservative investors prioritizing steady growth and accessibility.
Thus, Quant Mid Cap Fund is better suited for aggressive investors aiming for higher rewards. At the same time, the Nippon India Growth Fund is more appropriate for those seeking controlled growth with lower risk and more accessible entry points.

We hope you found this guide on mutual funds helpful.
If you have any mutual fund-related queries, feel free to comment below—we’re here to help! S.K. Singh, a registered professional with the Association of Mutual Funds in India (AMFI), will answer your queries and holds the ARN-251149.
Invest wisely!
FAQs-Nippon India Growth Fund vs Quant Mid Cap Fund
What are the investment styles of Nippon India Growth Fund and Quant Mid Cap Fund?
Nippon India Growth Fund and Quant Mid Cap Fund adopt a blend investment style, combining growth and value investing features. This approach provides a balanced exposure to different investment strategies. It is ideal for investors seeking stability and growth potential in mid-cap investments.
Which fund has better short-term returns?
Quant Mid Cap Fund significantly outperforms Nippon India Growth Fund in short-term returns. For instance, over 1 year, Quant delivered an impressive 81.81% return compared to Nippon’s 60.51%.
How do these funds perform over the medium and long term?
Quant Mid Cap Fund consistently outperforms Nippon India Growth Fund in medium-term and long-term returns. Over 5 years, Quant delivered 36.34% compared to Nippon’s 27.07%. Similarly, over 10 years, Quant maintained an edge with 22.05% compared to Nippon’s 20.11%.
What are the SIP returns for these funds?
Quant Mid Cap Fund leads in SIP returns across various timeframes. For example, over a 1-year SIP, Quant achieved 84.88% compared to Nippon’s 64.55%. Over a 10-year SIP, Quant’s returns were 27.03% versus Nippon’s 23.54%.
Which fund offers better risk-adjusted returns?
Quant Mid Cap Fund provides better risk-adjusted returns. It has a higher Sharpe Ratio of 1.02 compared to Nippon’s 0.87, indicating better returns per unit of risk.
How do the funds compare in terms of expense ratios?
Nippon India Growth Fund has a slightly lower expense ratio for its direct and regular plans than Quant Mid Cap Fund, making it a more cost-effective option for long-term investors.
What is the minimum investment amount for these funds?
Nippon India Growth Fund requires a lower minimum investment amount for both SIP (₹ 100) and lumpsum (₹ 100) compared to Quant Mid Cap Fund, which requires ₹ 1,000 for SIP and ₹ 5,000 for lumpsum investments.
Which fund has a more significant Asset Under Management (AUM)?
Nippon India Growth Fund has a larger AUM of ₹ 27,931 crores compared to Quant Mid Cap Fund’s ₹ 7,952 crores, indicating higher investor confidence and more significant resources under management.
How do the funds perform in terms of annualized returns?
Nippon India Growth Fund showed superior performance in specific years, such as 2023, with a return of 55.98% compared to Quant’s 27.11%. However, Quant consistently demonstrated strong performance, especially in 2017 and 2016.
Which fund has better ratings from rating agencies?
Quant Mid Cap Fund generally receives higher ratings from various rating agencies. For instance, it holds a higher CRISIL rating and a better Morning Star rating than the Nippon India Growth Fund.
How do these funds differ in their sector allocations?
Nippon India Growth Fund has higher allocations in the Financial and Consumer Discretionary sectors. At the same time, Quant Mid Cap Fund focuses more on the Materials and Energy & Utilities sectors.
Which fund has more experienced fund managers?
Quant Mid Cap Fund benefits from more experienced fund managers like Sanjeev Sharma, who has the longest tenure of 89 months, compared to the fund managers of Nippon India Growth Fund.
How do the funds compare in terms of portfolio overlap?
Quant Mid Cap Fund has a higher portfolio overlap of 27.36% compared to Nippon India Growth Fund’s 5.30%, indicating more common holdings with other funds.
What are the risk metrics for these funds?
Quant Mid Cap Fund demonstrates better risk metrics, including a higher Sharpe Ratio and Alpha values, indicating superior performance relative to risk compared to Nippon India Growth Fund.
Which fund is better for different risk appetites?
For Mutual fund investors with a higher risk tolerance seeking robust growth, Quant Mid Cap Fund is recommended due to its superior returns and risk-adjusted performance. Nippon India Growth Fund is better for conservative investors or those with smaller budgets due to its lower expenses and higher accessibility.
Disclaimer:
The information provided in this article is solely the author/advertisers’ opinion and not investment advice – it is provided for educational purposes only. Using this, you agree that the information does not constitute any investment or financial instructions by Ace Equity Research/Mutual Fund Focus/IPO First and the team. Anyone wishing to invest should seek their own independent financial or professional advice. Conduct your research with registered financial advisors before making any investment decisions. Ace Equity Research/ Mutual Fund Focus / IPO First and the team are not accountable for the investment views provided in the article.
Mutual Fund investments are subject to market risks. Read all scheme-related documents carefully.
Investments in the securities market are subject to market risks. Read all the related documents carefully before investing
