
If you’re planning to invest in large-cap funds and need clarification on Nippon India Large Cap Fund vs SBI Bluechip Fund, you’ve landed in the right place! This blog will dive deep into a comprehensive comparative analysis of these two large-cap mutual funds, helping you resolve all doubts. We’ll explore key parameters to help you choose the most consistent and best large-cap mutual funds for your long-term investment portfolio. You can make a knowledgeable decision by investing in a fund that has performed well consistently in terms of better risk-adjusted returns and Alpha generation.
Investment Style
Let’s start by understanding the investment style of both funds.
Nippon India Large Cap Fund: Growth SBI Bluechip Fund: Growth
Both funds follow a growth investment style, focusing on stocks with strong potential for future growth. This approach aims to provide high returns over the long term, making them apt for investors looking for capital appreciation.

Returns Analysis
Returns are a critical factor when it comes to investing. Let’s compare the trailing returns (NAV as of 29th April 2024) for different investment periods.
Trailing Returns

| Period Invested For | Nippon India Large Cap Fund | SBI Bluechip Fund |
| 1 Year | 44.71% | 26.88% |
| 2 Year | 27.57% | 16.67% |
| 3 Year | 27.21% | 17.23% |
| 5 Year | 18.55% | 16.17% |
| 10 Year | 18.11% | 16.26% |
Analysis of Returns
- 1-Year Returns: Nippon India Large Cap Fund significantly outperformed SBI Bluechip Fund with returns of 44.71% compared to 26.88%.
- 2-Year Returns: The trend continues with Nippon India Large Cap Fund delivering 27.57%, almost 11% higher than SBI Bluechip Fund’s 16.67%.
- 3-Year Returns: Nippon India Large Cap Fund achieved 27.21% compared to 17.23% by SBI Bluechip Fund.
- 5-Year Returns: Nippon India Large Cap Fund maintained its lead over a more extended period with 18.55% versus 16.17%.
- 10-Year Returns: Even in the long term, Nippon India Large Cap Fund slightly outperformed SBI Bluechip Fund with 18.11% against 16.26%.
Key Takeaways
- Short-term Outperformance: Nippon India Large Cap Fund has shown significant outperformance over SBI Bluechip Fund in the short term (1-3 years).
- Consistent Performance: Over longer investment horizons (5-10 years), Nippon India Large Cap Fund continues to deliver better returns, making it a more consistent performer.
- Higher Growth Potential: The higher returns suggest that Nippon India Large Cap Fund might have invested in stocks with better growth potential.
SIP Returns
Let’s dive into the SIP returns for both funds over different periods.
| Period Invested For | Nippon India Large Cap Fund | SBI Bluechip Fund |
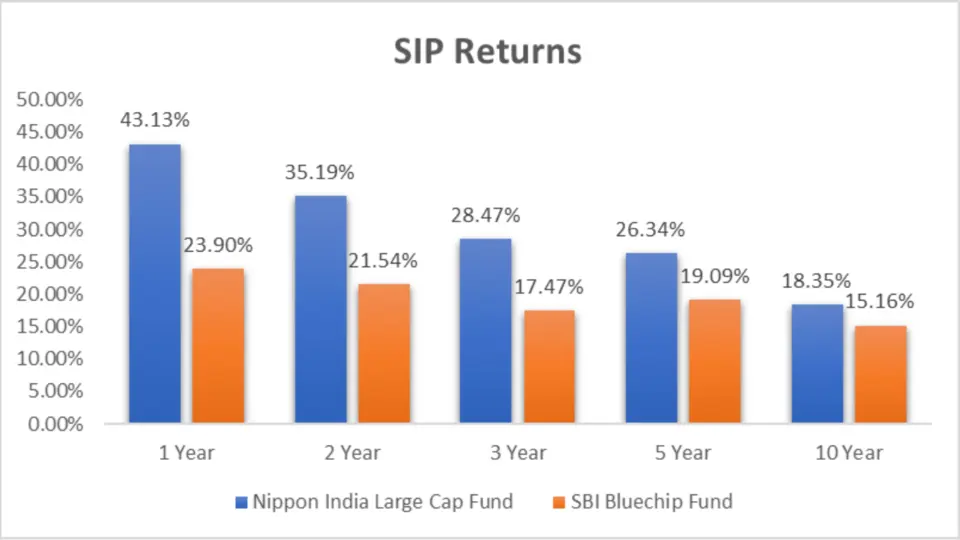
| 1 Year | 43.13% | 23.90% |
| 2 Year | 35.19% | 21.54% |
| 3 Year | 28.47% | 17.47% |
| 5 Year | 26.34% | 19.09% |
| 10 Year | 18.35% | 15.16% |
Analysis
- 1-Year Returns: Nippon India Large Cap Fund provided a return of 43.13% compared to 23.90% by SBI Bluechip Fund.
- 2-Year Returns: The returns for Nippon India Large Cap Fund were 35.19% against 21.54% for the SBI Bluechip Fund.
- 3-Year Returns: Nippon India Large Cap Fund achieved 28.47% compared to 17.47% by SBI Bluechip Fund.
- 5-Year Returns: Over five years, Nippon India Large Cap Fund outperformed with 26.34% versus 19.09%.
- 10-Year Returns: Even in the long term, Nippon India Large Cap Fund provided higher returns of 18.35% compared to 15.16% by SBI Bluechip Fund.
Key Takeaways
- Higher SIP Returns: Nippon India Large Cap Fund consistently provided higher SIP returns across all periods than SBI Bluechip Fund.
- Better Performance in SIPs: The superior performance in SIP returns indicates better management and selection of growth-oriented stocks in Nippon India Large Cap Fund.
SIP Investment Value
Look at the SIP investment values for both funds over different periods.
| Period Invested For | Investments | Nippon India Large Cap Fund | SBI Bluechip Fund |
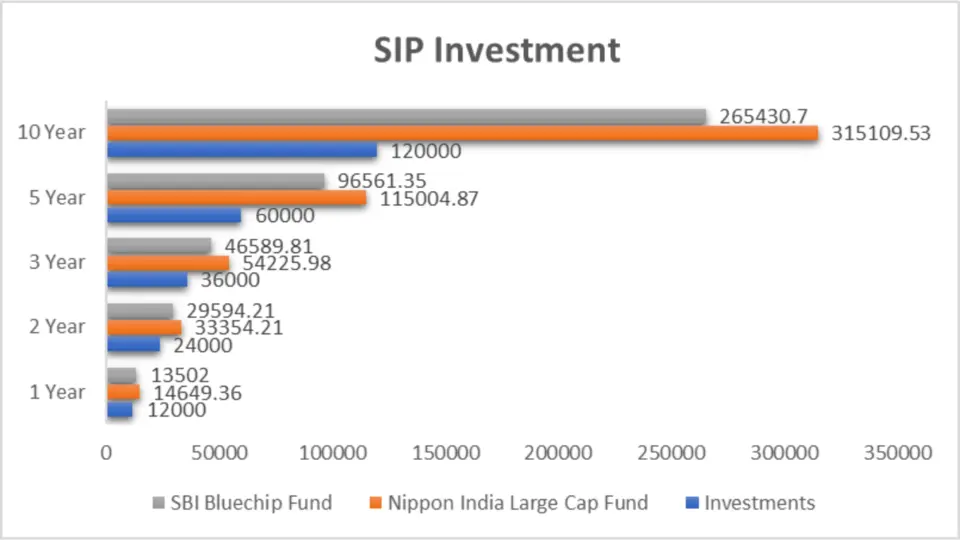
| 1 Year | ₹12,000 | ₹14,649.36 | ₹13,502 |
| 2 Year | ₹24,000 | ₹33,354.21 | ₹29,594.21 |
| 3 Year | ₹36,000 | ₹54,225.98 | ₹46,589.81 |
| 5 Year | ₹60,000 | ₹1,15,004.87 | ₹96,561.35 |
| 10 Year | ₹1,20,000 | ₹3,15,109.53 | ₹2,65,430.7 |
Analysis
- 1-Year SIP Investment: Nippon India Large Cap Fund returned ₹14,649.36 for an investment of ₹12,000 compared to ₹13,502 by SBI Bluechip Fund.
- 2-Year SIP Investment: Nippon India Large Cap Fund returned ₹33,354.21 for ₹24,000 invested, compared to ₹29,594.21 by SBI Bluechip Fund.
- 3-Year SIP Investment: Nippon India Large Cap Fund achieved ₹54,225.98 for ₹36,000 invested, compared to ₹46,589.81 by SBI Bluechip Fund.
- 5-Year SIP Investment: For ₹60,000 invested, Nippon India Large Cap Fund returned ₹1,15,004.87 compared to ₹96,561.35 by SBI Bluechip Fund.
- 10-Year SIP Investment: Over a decade, Nippon India Large Cap Fund returned ₹3,15,109.53 for ₹1,20,000 invested, compared to ₹2,65,430.7 by SBI Bluechip Fund.
Key Takeaways
- Higher Investment Values: Nippon India Large Cap Fund consistently delivered higher SIP investment values across all periods than SBI Bluechip Fund.
- Better Long-term Growth: The superior long-term SIP investment values indicate better Nippon India Large Cap Fund growth potential.
CAGR Analysis
Let’s compare the compound annual Growth Rate (CAGR) for both funds over different periods.
| Category | 1 Y | 3 Y | 5 Y | 9 Y |
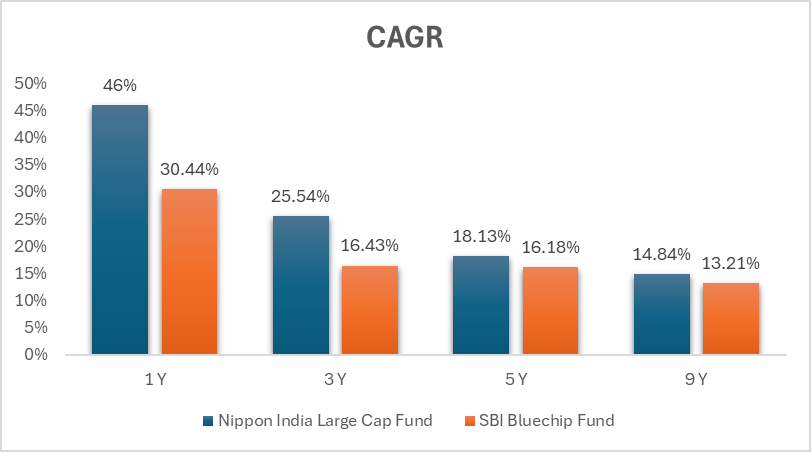
| Nippon India Large Cap Fund | 46% | 25.54% | 18.13% | 14.84% |
| SBI Bluechip Fund | 30.44% | 16.43% | 16.18% | 13.21% |
Analysis
- 1-Year CAGR: Nippon India Large Cap Fund provided a staggering 46% CAGR compared to 30.44% by SBI Bluechip Fund.
- 3-Year CAGR: Nippon India Large Cap Fund achieved 25.54% CAGR compared to 16.43% by SBI Bluechip Fund.
- 5-Year CAGR: Nippon India Large Cap Fund outperformed with an 18.13% CAGR against 16.18% by SBI Bluechip Fund.
- 9-Year CAGR: Even over nine years, Nippon India Large Cap Fund led with a 14.84% CAGR compared to 13.21% by SBI Bluechip Fund.
Key Takeaways
- Superior Short-term Growth: Nippon India Large Cap Fund delivered significantly higher short-term growth rates.
- Consistent Long-term Growth: Nippon India Large Cap Fund maintained its edge in growth rates over more extended periods, indicating better long-term growth potential.
Rolling Returns
Let’s analyze the rolling returns over different periods for both funds.
| Category | 1 Y | 3 Y | 5 Y |
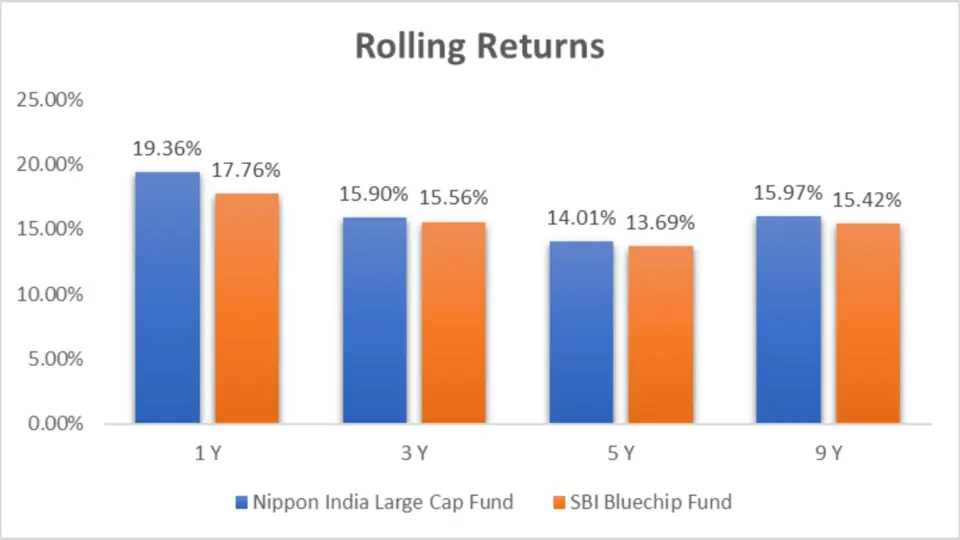
| Nippon India Large Cap Fund | 19.36% | 15.90% | 14.01% |
| SBI Bluechip Fund | 17.76% | 15.56% | 13.69% |
Analysis
- 1-Year Rolling Returns: Nippon India Large Cap Fund provided 19.36% returns compared to 17.76% by SBI Bluechip Fund.
- 3-Year Rolling Returns: Nippon India Large Cap Fund achieved 15.90% returns compared to 15.56% by SBI Bluechip Fund.
- 5-Year Rolling Returns: Nippon India Large Cap Fund outperformed with 14.01% returns against 13.69% by SBI Bluechip Fund.
Key Takeaways
- Higher Rolling Returns: Nippon India Large Cap Fund consistently provided higher rolling returns across all periods than SBI Bluechip Fund.
- Better Performance Consistency: The superior performance in rolling returns indicates better consistency and management in the Nippon India Large Cap Fund.
Annualized/Calendar Year Returns
Let’s dive into the annualized/calendar year returns for both funds over recent years.
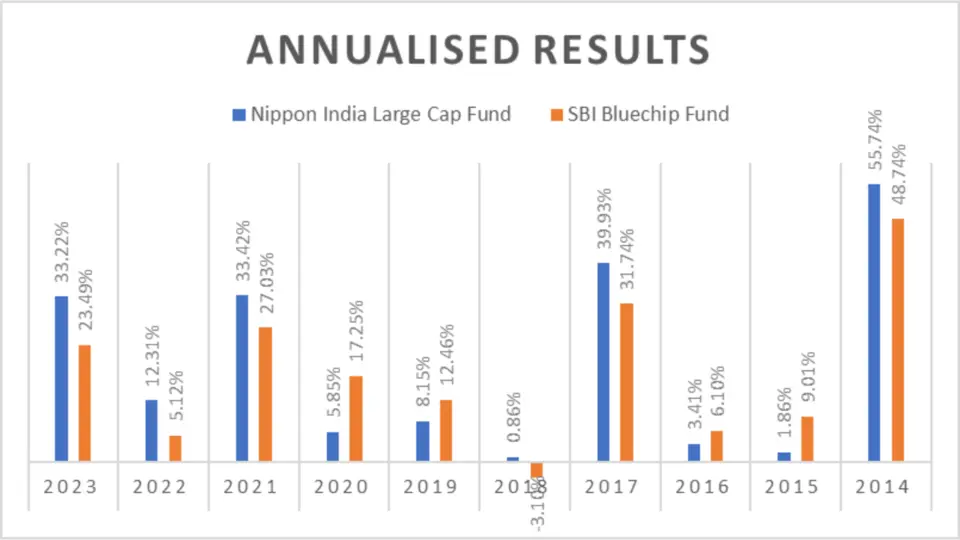
| Period | Nippon India Large Cap Fund | SBI Bluechip Fund |
| 2023 | 33.22% | 23.49% |
| 2022 | 12.31% | 5.12% |
| 2021 | 33.42% | 27.03% |
| 2020 | 5.85% | 17.25% |
| 2019 | 8.15% | 12.46% |
| 2018 | 0.86% | -3.10% |
| 2017 | 39.93% | 31.74% |
| 2016 | 3.41% | 6.10% |
| 2015 | 1.86% | 9.01% |
| 2014 | 55.74% | 48.74% |
Analysis
- 2023: Nippon India Large Cap Fund provided 33.22% returns compared to 23.49% by SBI Bluechip Fund.
- 2022: Nippon India Large Cap Fund achieved 12.31% returns compared to 5.12% by SBI Bluechip Fund.
- 2021: Nippon India Large Cap Fund outperformed with 33.42% returns against 27.03% by SBI Bluechip Fund.
- 2020: SBI Bluechip Fund led with 17.25% returns compared to 5.85% by Nippon India Large Cap Fund.
- 2019: SBI Bluechip Fund provided 12.46% returns compared to 8.15% by Nippon India Large Cap Fund.
- 2018: Nippon India Large Cap Fund achieved 0.86% returns, while SBI Bluechip Fund faced a decline of -3.10%.
- 2017: Nippon India Large Cap Fund delivered 39.93% returns compared to 31.74% by SBI Bluechip Fund.
- 2016: SBI Bluechip Fund provided 6.10% returns compared to 3.41% by Nippon India Large Cap Fund.
- 2015: SBI Bluechip Fund led with 9.01% returns compared to 1.86% by Nippon India Large Cap Fund.
- 2014: Nippon India Large Cap Fund outperformed with 55.74% returns against 48.74% by SBI Bluechip Fund.
Key Takeaways
- Consistent Outperformance: Nippon India Large Cap Fund has outperformed SBI Bluechip Fund in most years, consistently performing.
- Short-term Variations: While the SBI Bluechip Fund performed better in a few specific years, the Nippon India Large Cap Fund generally maintained higher returns over the long term.
Best Quarters
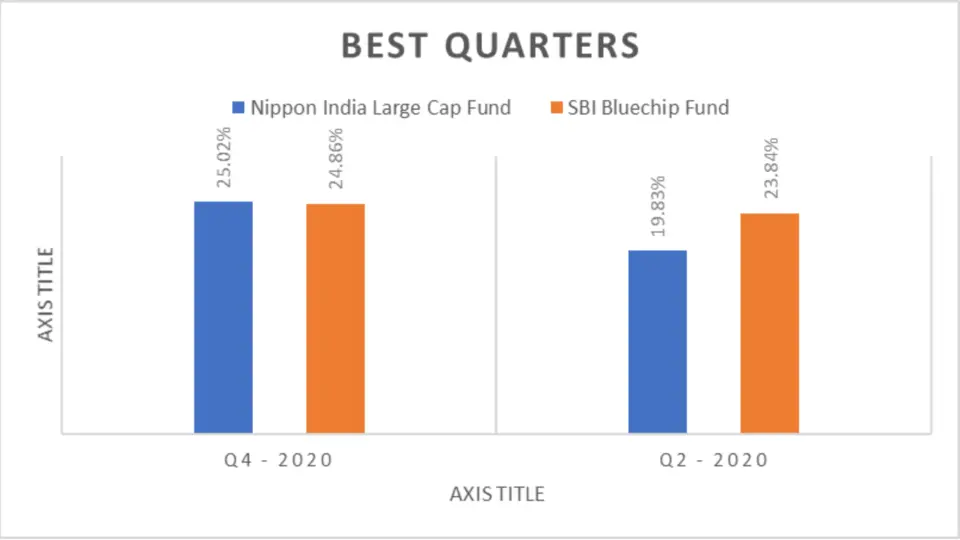
| Period | Nippon India Large Cap Fund | SBI Bluechip Fund |
| Q4 – 2020 | 25.02% | 24.86% |
| Q2 – 2020 | 19.83% | 23.84% |
Worst Quarters
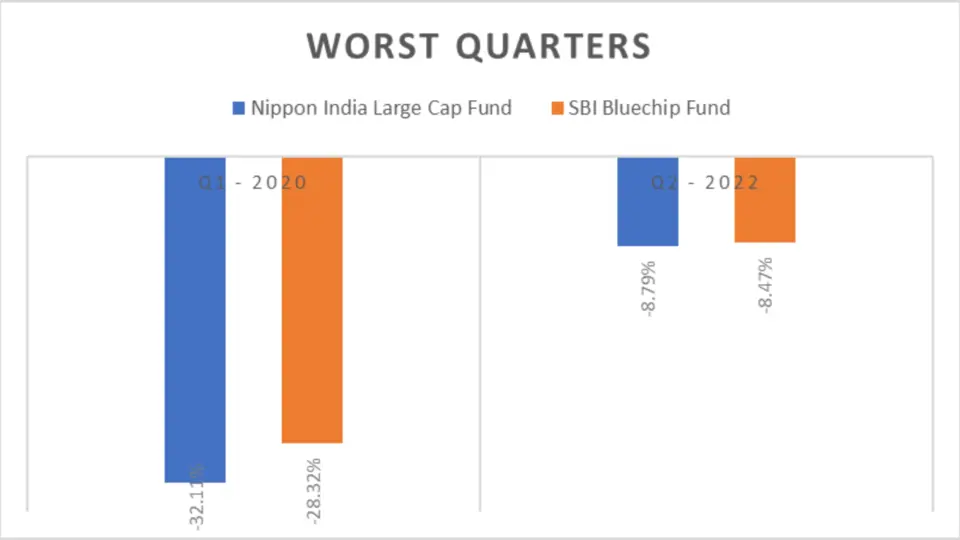
| Period | Nippon India Large Cap Fund | SBI Bluechip Fund |
| Q1 – 2020 | -32.11% | -28.32% |
| Q2 – 2022 | -8.79% | -8.47% |
Analysis
- Best Quarters: Both funds performed similarly during their best quarters, with Nippon India Large Cap Fund slightly leading in Q4 – 2020.
- Worst Quarters: Both funds experienced significant declines during their worst quarters, with Nippon India Large Cap Fund having slightly larger drawdowns.
Key Takeaways
- Strong Recovery: Both funds show strong recovery potential during their best quarters.
- Risk Awareness: Understanding the worst quarters helps assess the risk and potential drawdowns of the funds.
Quarterly Results
Let’s look at the quarterly performance of both funds.
| Period | Nippon India Large Cap Fund | SBI Bluechip Fund |
| Q1 – 2024 | 7.27% | 2.82% |
| Q4 – 2023 | 10.99% | 9.08% |
| Q3 – 2023 | 6.98% | 2.85% |
| Q2 – 2023 | 14.39% | 13.24% |
| Q1 – 2023 | -1.91% | -2.78% |
| Q4 – 2022 | 5.08% | 5.08% |
| Q3 – 2022 | 12.21% | 8.96% |
| Q2 – 2022 | -8.79% | -8.47% |
| Q1 – 2022 | 2.51% | -1.17% |
| Q4 – 2021 | -0.72% | -0.42% |
| Q3 – 2021 | 14.11% | 12.32% |
| Q2 – 2021 | 7.69% | 5.28% |
| Q1 – 2021 | 7.87% | 6.83% |
| Q4 – 2020 | 25.02% | 24.86% |
| Q3 – 2020 | 5.10% | 7.43% |
| Q2 – 2020 | 19.83% | 23.84% |
| Q1 – 2020 | -32.11% | -28.32% |
Analysis
- Recent Performance: Nippon India Large Cap Fund consistently outperformed SBI Bluechip Fund in most quarters.
- Short-term Variations: While both funds had some negative quarters, Nippon India Large Cap Fund generally showed a more robust recovery.
Key Takeaway
- Strong Recent Performance: Nippon India Large Cap Fund has shown robust performance in recent quarters.
- Quarterly Variations: Understanding quarterly variations helps assess the funds’ short-term performance and potential volatility.


Risk Analysis
Maximum Drawdown
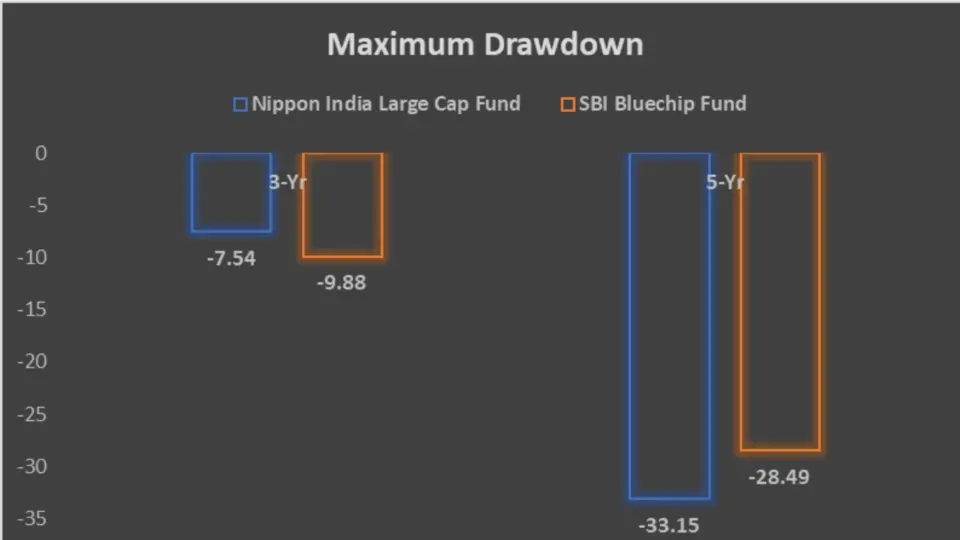
Let’s analyse the maximum drawdowns over different periods for both funds.
| Period | Nippon India Large Cap Fund | SBI Bluechip Fund |
| 3-Yr | -7.54 | -9.88 |
| 5-Yr | -33.15 | -28.49 |
Analysis
- 3-Year Drawdown: Nippon India Large Cap Fund experienced a maximum drawdown of -7.54% compared to -9.88% by SBI Bluechip Fund.
- 5-Year Drawdown: Nippon India Large Cap Fund faced a maximum drawdown of -33.15% compared to -28.49% by SBI Bluechip Fund.
Key Takeaways
- Lower Drawdown in the Short-term: Nippon India Large Cap Fund has lower drawdowns in the short term, indicating better resilience.
- Higher Drawdown in the Long-term: Nippon India Large Cap Fund experienced higher drawdowns over the long term, reflecting higher risk during market downturns.
Mean, Sortino Ratio and Treynor’s Ratio
Let’s delve into the risk metrics of both funds.
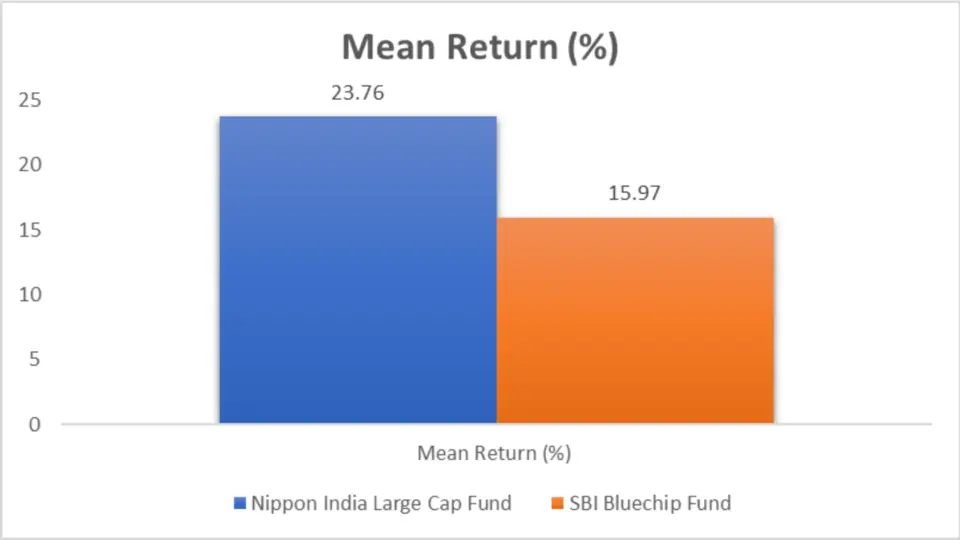
| Metric | Nippon India Large Cap Fund | SBI Bluechip Fund |
| Mean Return (%) | 23.76 | 15.97 |
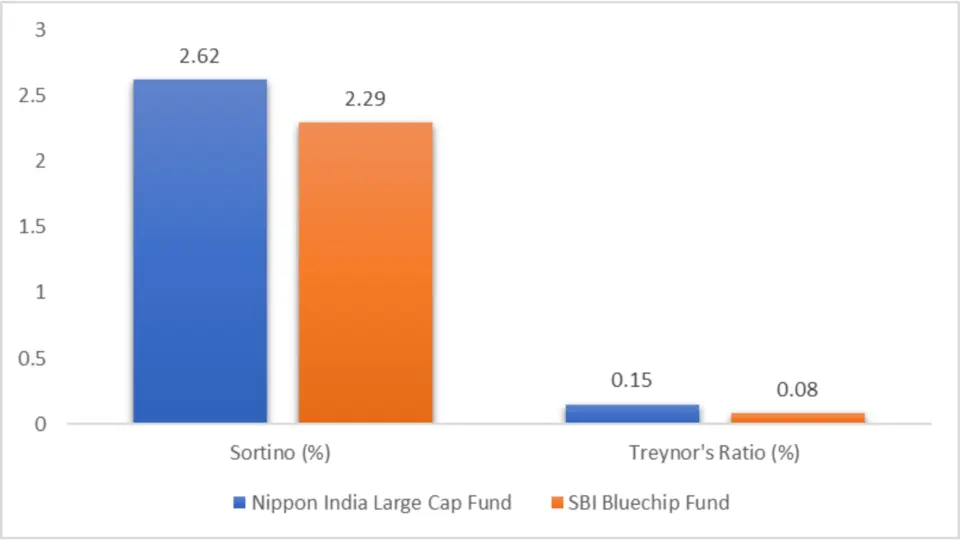
| Sortino (%) | 2.62 | 2.29 |
| Treynor’s Ratio (%) | 0.15 | 0.08 |
Analysis
- Mean Return: Nippon India Large Cap Fund has a higher mean return of 23.76% compared to 15.97% by SBI Bluechip Fund.
- Sortino Ratio: Nippon India Large Cap Fund has a Sortino ratio of 2.62, indicating better risk-adjusted returns than 2.29 by SBI Bluechip Fund.
- Treynor’s Ratio: Nippon India Large Cap Fund has a higher Treynor’s Ratio of 0.15 compared to 0.08 by SBI Bluechip Fund.
Key Takeaways
- Higher Returns: Nippon India Large Cap Fund consistently provides higher returns with better risk-adjusted metrics.
- Better Risk Management: The superior Sortino and Treynor ratios indicate better risk management for Nippon India Large Cap Fund.
Standard Deviation
Let’s examine the standard deviation over different periods for both funds.
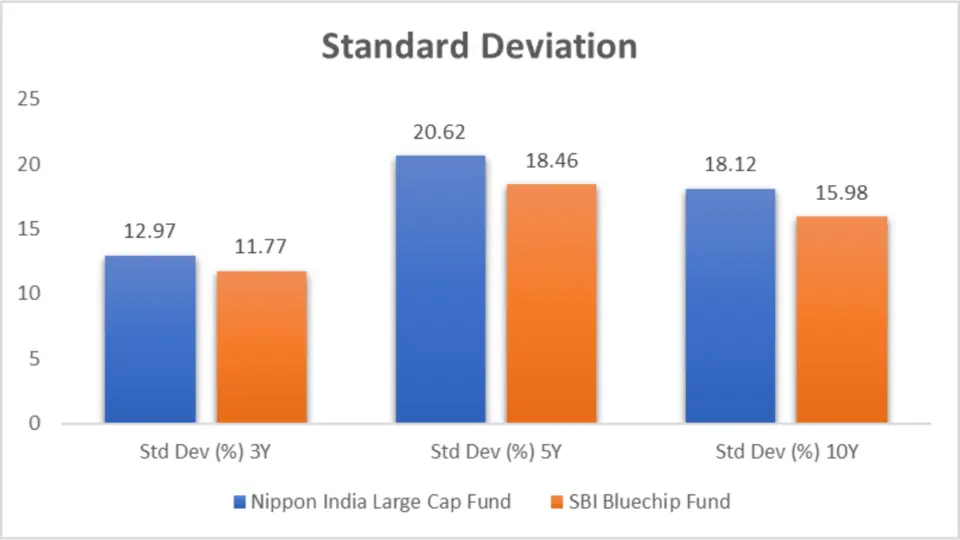
| Period | Nippon India Large Cap Fund | SBI Bluechip Fund |
| 3-Yr | 12.97% | 11.77% |
| 5-Yr | 20.62% | 18.46% |
| 10-Yr | 18.12% | 15.98% |
Analysis
- 3-Year Standard Deviation: Nippon India Large Cap Fund has a higher standard deviation of 12.97% compared to 11.77% by SBI Bluechip Fund.
- 5-Year Standard Deviation: Nippon India Large Cap Fund experienced higher volatility with a standard deviation of 20.62% compared to 18.46% by SBI Bluechip Fund.
- 10-Year Standard Deviation: Over the long term, Nippon India Large Cap Fund has a standard deviation of 18.12% compared to 15.98% by SBI Bluechip Fund.
Key Takeaways
- Higher Volatility: Nippon India Large Cap Fund exhibits higher volatility across all periods than the SBI Bluechip Fund.
- Risk Awareness: Investors should know the higher risk associated with Nippon India Large Cap Fund volatility.
Sharpe Ratio
Let’s explore the Sharpe ratios over different periods for both funds.
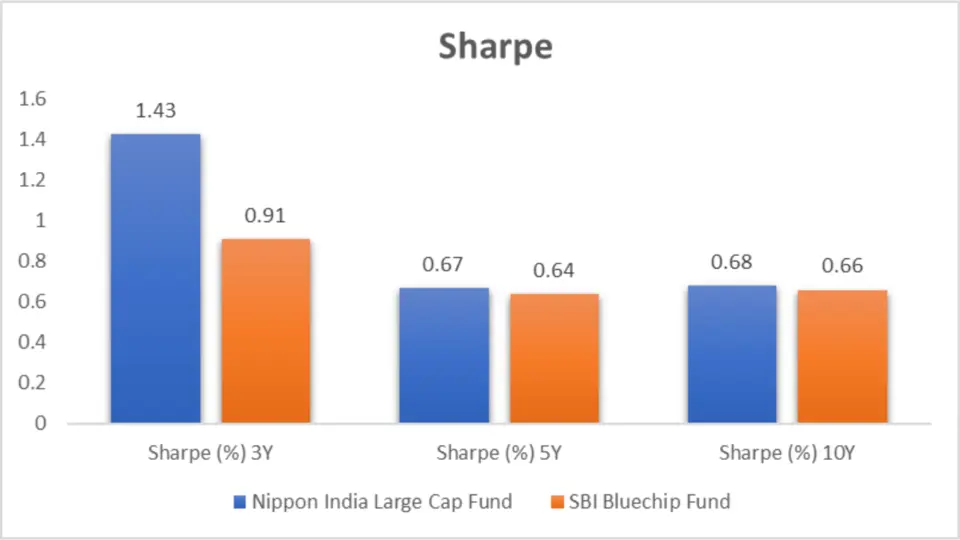
| Period | Nippon India Large Cap Fund | SBI Bluechip Fund |
| 3-Yr | 1.43 | 0.91 |
| 5-Yr | 0.67 | 0.64 |
| 10-Yr | 0.68 | 0.66 |
Analysis
- 3-Year Sharpe Ratio: Nippon India Large Cap Fund has a higher Sharpe ratio of 1.43 compared to 0.91 by SBI Bluechip Fund.
- 5-Year Sharpe Ratio: Nippon India Large Cap Fund achieved a Sharpe ratio of 0.67 compared to 0.64 by SBI Bluechip Fund.
- 10-Year Sharpe Ratio: Over the long term, Nippon India Large Cap Fund has a Sharpe ratio of 0.68 compared to 0.66 by SBI Bluechip Fund.
Key Takeaways
- Better Risk-adjusted Returns: Nippon India Large Cap Fund consistently provides better returns across all periods than SBI Bluechip Fund.
- Higher Performance: The higher Sharpe ratios indicate superior performance relative to the risk taken.
Beta
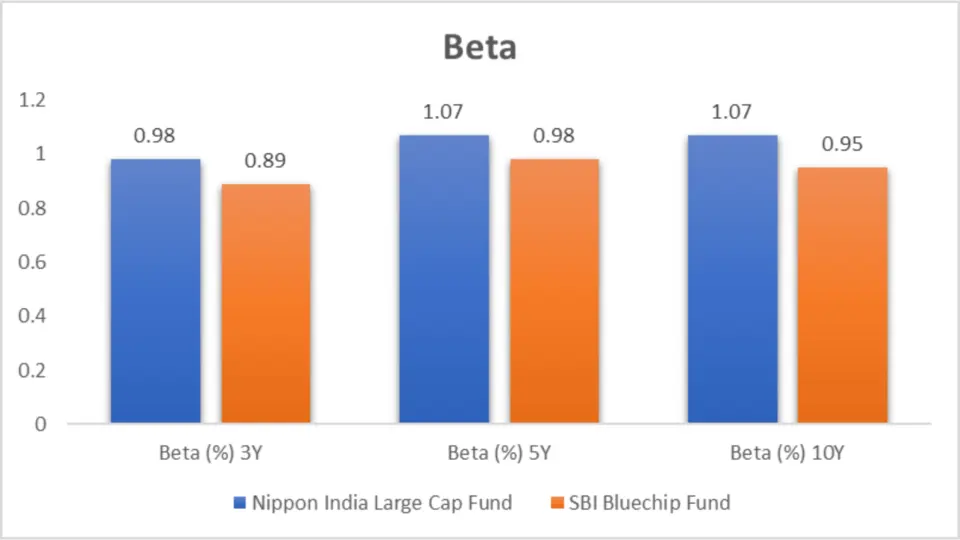
Let’s examine the beta over different periods for both funds.
| Period | Nippon India Large Cap Fund | SBI Bluechip Fund |
| 3-Yr | 0.98 | 0.89 |
| 5-Yr | 1.07 | 0.98 |
| 10-Yr | 1.07 | 0.95 |
Analysis
- 3-Year Beta: Nippon India Large Cap Fund has a beta of 0.98 compared to 0.89 by SBI Bluechip Fund.
- 5-Year Beta: Nippon India Large Cap Fund has a beta of 1.07 compared to 0.98 by SBI Bluechip Fund.
- 10-Year Beta: Over the long term, Nippon India Large Cap Fund has a beta of 1.07 compared to 0.95 by SBI Bluechip Fund.
Key Takeaways
- Higher Market Sensitivity: Nippon India Large Cap Fund exhibits higher sensitivity to market movements across all periods than SBI Bluechip Fund.
- Risk Awareness: Investors should consider the higher beta when evaluating the risk associated with Nippon India Large Cap Fund.
Alpha
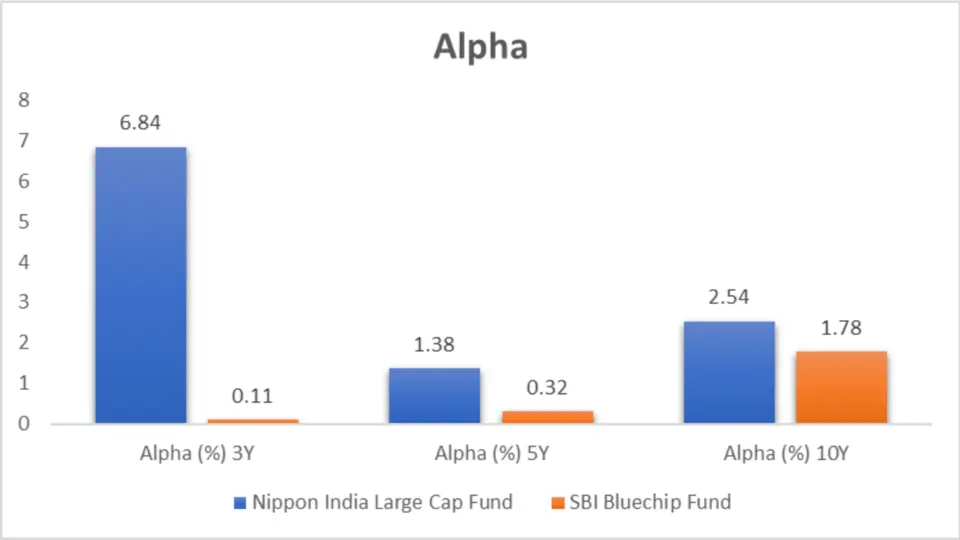
Let’s explore the alpha over different periods for both funds.
| Period | Nippon India Large Cap Fund | SBI Bluechip Fund |
| 3-Yr | 6.84% | 0.11% |
| 5-Yr | 1.38% | 0.32% |
| 10-Yr | 2.54% | 1.78% |
Analysis
- 3-Year Alpha: Nippon India Large Cap Fund has a significantly higher alpha of 6.84% compared to 0.11% by SBI Bluechip Fund.
- 5-Year Alpha: Nippon India Large Cap Fund achieved an alpha of 1.38% compared to 0.32% by SBI Bluechip Fund.
- 10-Year Alpha: Over the long term, Nippon India Large Cap Fund has an alpha of 2.54% compared to 1.78% by SBI Bluechip Fund.
Key Takeaways
- Higher Excess Returns: Nippon India Large Cap Fund consistently provides higher excess returns across all periods than SBI Bluechip Fund.
- Superior Performance: The higher alpha values indicate better performance than the benchmark.
Ratings
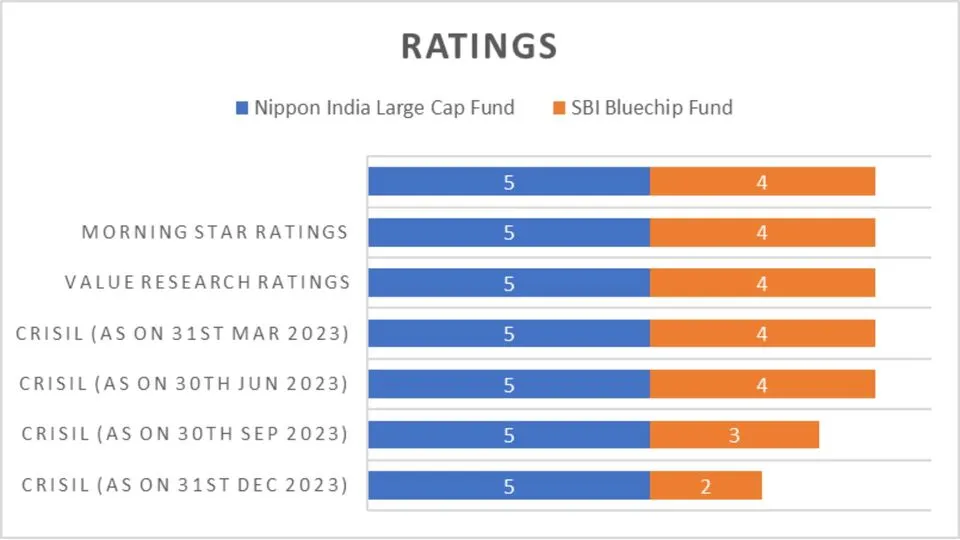
Let’s review the ratings of both funds from various sources.
| Source | Nippon India Large Cap Fund | SBI Bluechip Fund |
| CRISIL (31st Mar 2024) | 5 | 2 |
| CRISIL (31st December 2023) | 5 | 3 |
| CRISIL (30th Sep 2023) | 5 | 4 |
| CRISIL (30th Jun 2023) | 5 | 4 |
| CRISIL (31st Mar 2023) | 5 | 4 |
| Value Research | 5 | 4 |
| Morning Star | 5 | 4 |
Analysis
- CRISIL Ratings: Nippon India Large Cap Fund consistently received higher CRISIL ratings than SBI Bluechip Fund across multiple quarters.
- Value Research: Nippon India Large Cap Fund has a higher rating from Value Research.
- Morning Star: Nippon India Large Cap Fund also has a higher rating from Morning Star.
Key Takeaways
- Higher Ratings: Nippon India Large Cap Fund consistently receives higher ratings from multiple sources than SBI Bluechip Fund.
- Better Performance Recognition: The higher ratings indicate better recognition of performance and management in the Nippon India Large Cap Fund.
- Nippon India Large Cap Fund invests more in technology.
Portfolio Analysis
Portfolio Overlapping Comparison
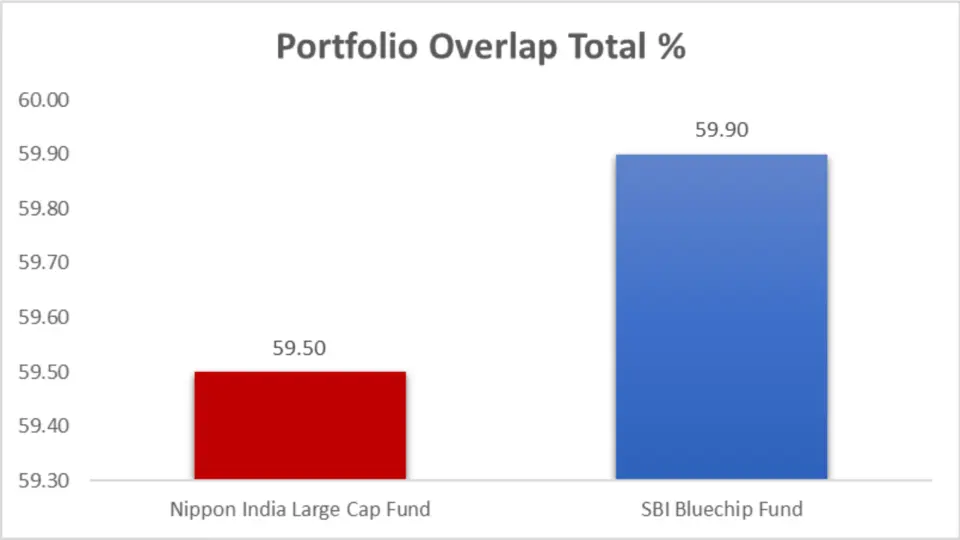
Understanding how much the portfolios overlap can give us insights into the diversity of investments.
| Metric | Nippon India Large Cap Fund | SBI Bluechip Fund |
| Portfolio Overlap Total % | 59.50 | 59.90 |
Analysis
- High Overlap: Both funds significantly overlap in their portfolios, indicating similar investment choices in large-cap stocks.
- Diversification Insight: Despite the overlap, differences in sector allocations and specific stock choices can lead to varying performance.
Portfolio Comparison
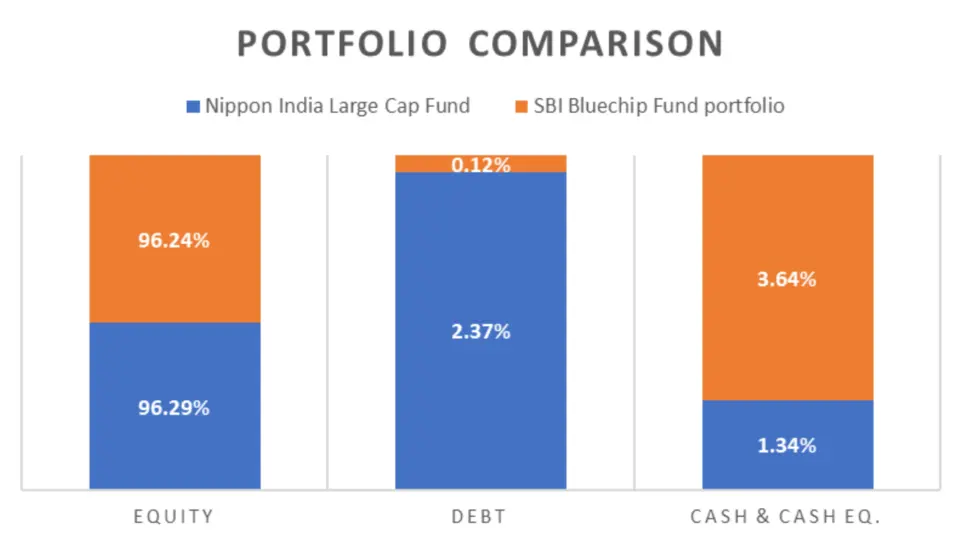
Let’s delve into each fund’s specific equity, debt, and cash holdings allocations.
| Category | Nippon India Large Cap Fund | SBI Bluechip Fund |
| Equity | 96.29% | 96.24% |
| Debt | 2.37% | 0.12% |
| Cash & Cash Eq. | 1.34% | 3.64% |
Analysis
- Equity Allocation: Both funds have a high equity allocation, focusing on stocks to drive growth.
- Debt and Cash: Nippon India Large Cap Fund has a higher allocation to debt, while SBI Bluechip Fund holds more cash equivalents.
Market Cap Allocation
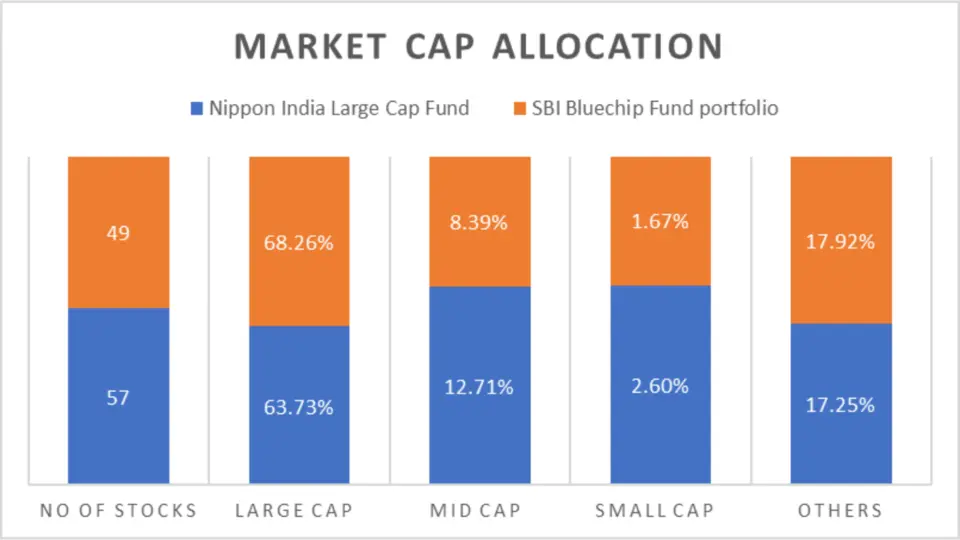
Analyzing the market cap allocation helps us understand the fund’s focus on large, mid, and small-cap stocks.
| Category | Nippon India Large Cap Fund | SBI Bluechip Fund |
| No of Stocks | 57 | 49 |
| Large Cap | 63.73% | 68.26% |
| Mid Cap | 12.71% | 8.39% |
| Small Cap | 2.60% | 1.67% |
| Others | 17.25% | 17.92% |
| Foreign Equity Holdings | 0.00% | 0.00% |
Analysis
- Stock Diversity: Nippon India Large Cap Fund holds more stocks than SBI Bluechip Fund, indicating a broader diversification.
- Significant Cap Focus: SBI Bluechip Fund has a higher allocation to large-cap stocks, potentially offering more stability.
- Mid and Small Cap Exposure: Nippon India Large Cap Fund has a higher exposure to mid and small-cap stocks, providing more growth opportunities.
Sector Allocation
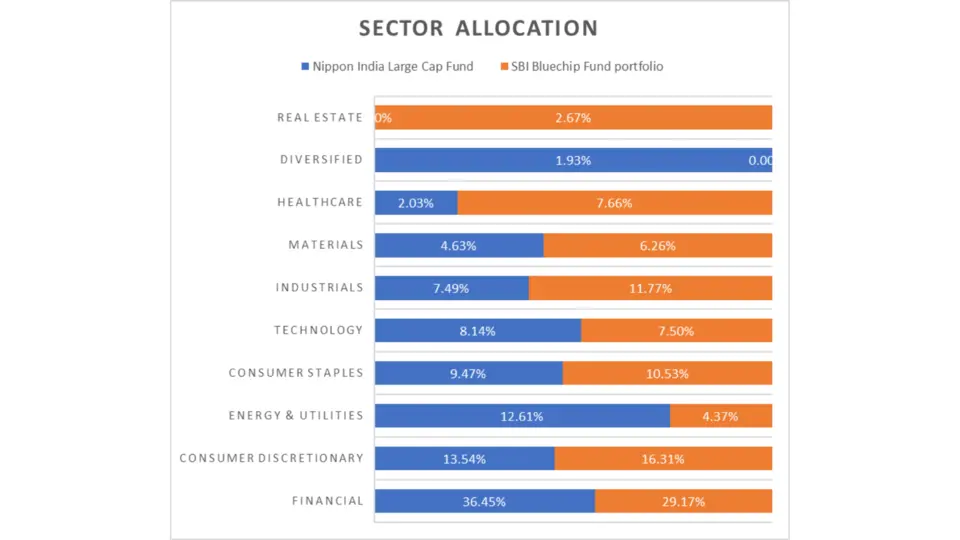
Sector allocation provides insights into the fund’s investment strategy and exposure to different economic sectors.
| Sector | Nippon India Large Cap Fund | SBI Bluechip Fund |
| Financial | 36.45% | 29.17% |
| Consumer Discretionary | 13.54% | 16.31% |
| Energy & Utilities | 12.61% | 4.37% |
| Consumer Staples | 9.47% | 10.53% |
| Technology | 8.14% | 7.50% |
| Industrials | 7.49% | 11.77% |
| Materials | 4.63% | 6.26% |
| Healthcare | 2.03% | 7.66% |
| Diversified | 1.93% | – |
| Real Estate | – | 2.67% |
Analysis
- Financial Sector: Nippon India Large Cap Fund has a higher allocation to financials, potentially offering more stability and dividends.
- Consumer Discretionary: SBI Bluechip Fund has a higher allocation here, which could benefit from consumer spending growth.
- Energy & Utilities: Nippon India Large Cap Fund has a significant allocation, indicating a focus on energy and utility stocks.
- Technology and Industrials: Both funds have a balanced exposure to technology and industrial sectors, providing growth opportunities.
- Healthcare: SBI Bluechip Fund has a higher allocation to healthcare, potentially offering stability and growth from healthcare advancements.
Fund Management Comparison
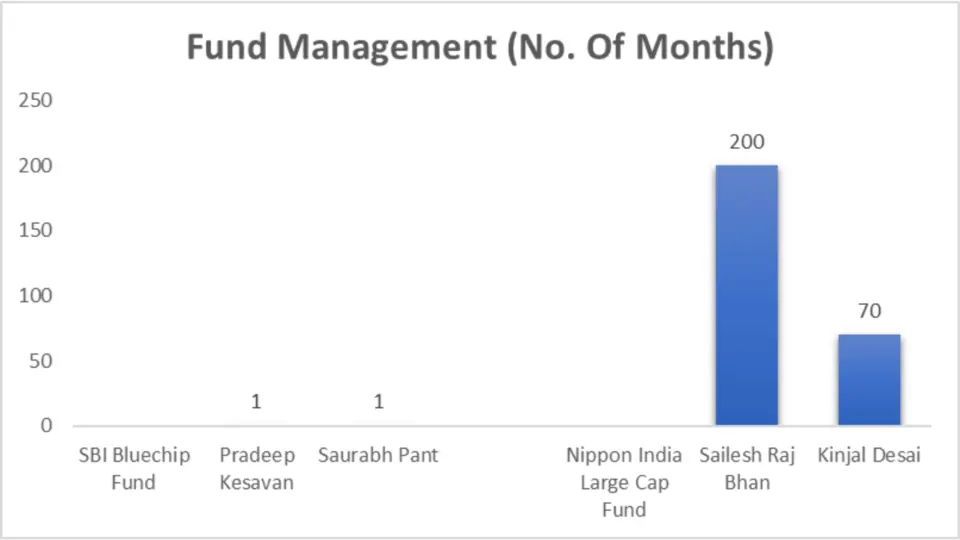
The fund management team plays a crucial part in the performance and stability of mutual funds. Let’s compare the fund managers for both funds.
SBI Bluechip Fund
| Fund Manager | No. Of Months |
| Pradeep Kesavan | 1 |
| Saurabh Pant | 1 |
Nippon India Large Cap Fund
| Fund Manager | No. Of Months |
| Sailesh Raj Bhan | 200 |
| Kinjal Desai | 70 |
| Ashutosh Bhargava | 32 |
Analysis
- Experienced Managers: Nippon India Large Cap Fund has highly experienced fund managers, with Sailesh Raj Bhan leading for 200 months.
- New Leadership: SBI Bluechip Fund recently appointed Pradeep Kesavan and Saurabh Pant, each with just 1 month in the role, indicating a recent management change.
Key Takeaways
- Stability and Experience: Nippon India Large Cap Fund benefits from stable and experienced fund management, which can contribute to consistent performance.
- Recent Changes: The recent changes in SBI Bluechip Fund’s management may bring new strategies but also add an element of uncertainty.
Other Important General Details
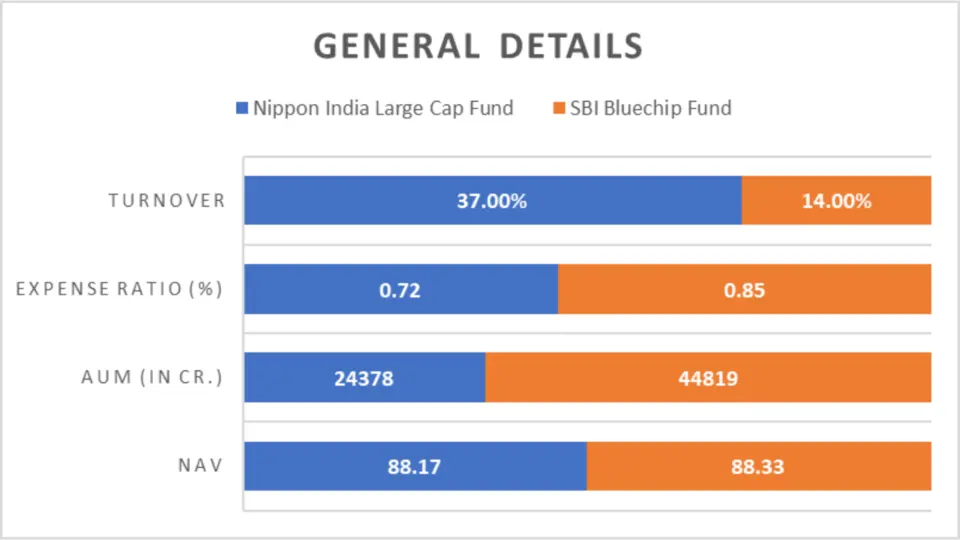
Let’s examine other crucial details that can influence your investment decision.
| Metric | Nippon India Large Cap Fund | SBI Bluechip Fund |
| NAV | 88.17 | 88.33 |
| AUM (in Cr.) | 24,378 | 44,819 |
| Expense Ratio (%) | 0.72 | 0.85 |
| Turnover | 37.00% | 14.00% |
| Benchmark | NIFTY 100 | NIFTY 100 |
Analysis
- NAV: Both funds have similar NAVs, indicating comparable unit prices.
- AUM: SBI Bluechip Fund has a significantly larger Asset Under Management (AUM), indicating higher investor confidence.
- Expense Ratio: Nippon India Large Cap Fund has a lower expense ratio, making it more cost-efficient.
- Turnover: Nippon India Large Cap Fund has a higher turnover rate, indicating more frequent changes in its portfolio.
Key Takeaways
- Cost Efficiency: Nippon India Large Cap Fund is more cost-efficient and has a lower expense ratio.
- Higher Investor Confidence: SBI Bluechip Fund has a larger AUM, reflecting higher investor confidence.
Minimum Investment Amount
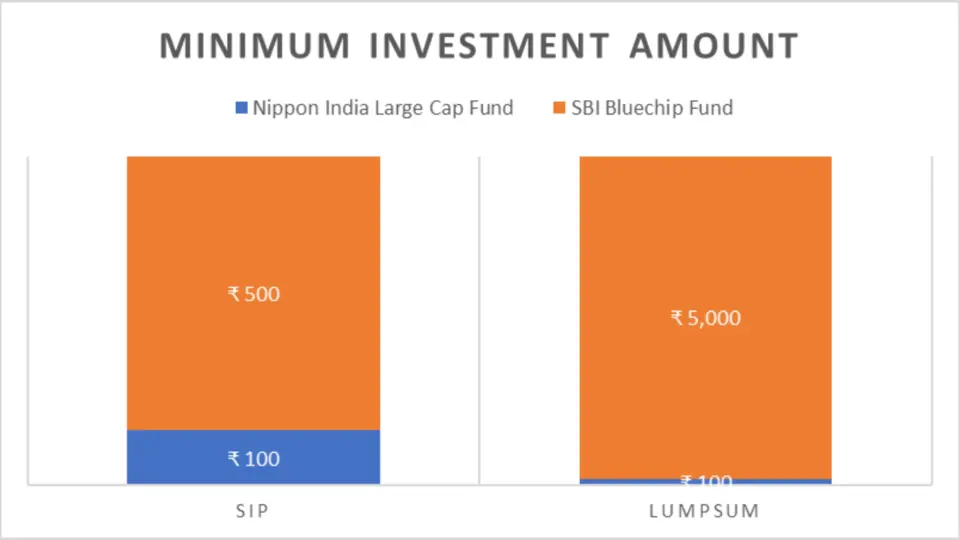
Understanding the minimum investment requirements can help you plan your investments.
| Investment Type | Nippon India Large Cap Fund | SBI Bluechip Fund |
| SIP | ₹100 | ₹500 |
| Lumpsum | ₹100 | ₹5,000 |
Analysis
- SIP Investment: Nippon India Large Cap Fund allows SIP investments starting at ₹100, making it more accessible to small investors.
- Lumpsum Investment: Nippon India Large Cap Fund also has a lower minimum lumpsum investment requirement of ₹100 compared to ₹5,000 for SBI Bluechip Fund.
Key Takeaways
- Accessibility: Nippon India Large Cap Fund is more accessible to small investors with lower minimum investment requirements for both SIP and lumpsum investments.
- Flexibility: The lower minimum investment amounts allow investors to start with smaller quantities and regularly increase in their investments.
Conclusion
Nippon India Large Cap Fund is the superior choice based on a comprehensive analysis of returns, risk-adjusted performance, fund management experience, and cost efficiency. This fund consistently outperformed SBI Bluechip Fund across various periods, delivering higher returns and better risk-adjusted metrics such as Sharpe and Sortino ratios. With a lower expense ratio and a more accessible minimum investment requirement, Nippon India Large Cap Fund provides a more attractive option for small and large investors.
However, investors with a lower risk appetite might prefer the SBI Bluechip Fund due to its slightly lower volatility and larger AUM, indicating higher investor confidence and stability. Choosing between these funds should align with your investment goals and risk tolerance. Nippon India Large Cap Fund is the better option for higher returns and growth potential. SBI Bluechip Fund is suitable for those seeking stability and lower volatility.

FAQs-Nippon India Large Cap Fund vs SBI Bluechip Fund
Which fund has better returns: Nippon India Large Cap Fund or SBI Bluechip Fund?
Nippon India Large Cap Fund consistently outperforms SBI Bluechip Fund across various investment periods. It has shown higher returns in 1-year, 3-year, 5-year, and 10-year intervals, making it a more reliable option for better returns.
What is the investment style of Nippon India Large Cap Fund and SBI Bluechip Fund?
Nippon India Large Cap Fund and SBI Bluechip Fund follow a growth investment style. They focus on stocks with high potential for future growth, aiming to provide substantial long-term returns.
How do SIP returns compare between Nippon India Large Cap Fund and SBI Bluechip Fund?
Nippon India Large Cap Fund offers significantly higher SIP returns across all periods. For example, the 1-year SIP return for Nippon India Large Cap Fund is 43.13%, compared to 23.90% for SBI Bluechip Fund.
Which fund is more volatile: Nippon India Large Cap Fund or SBI Bluechip Fund?
Nippon India Large Cap Fund is generally more volatile than the SBI Bluechip Fund. It exhibits higher standard deviations across 3-year, 5-year, and 10-year periods, indicating more significant price fluctuations.
What are the expense ratios for Nippon India Large Cap Fund and SBI Bluechip Fund?
Nippon India Large Cap Fund has a lower expense ratio of 0.72%, compared to 0.85% for SBI Bluechip Fund. This makes Nippon India’s Large Cap Fund more cost-efficient.
Which fund is better for small investors: Nippon India Large Cap Fund or SBI Bluechip Fund?
Nippon India Large Cap Fund is more accessible for small investors, with a minimum SIP investment of ₹100 and a minimum lumpsum investment of ₹100. In contrast, the SBI Bluechip Fund requires ₹500 for SIP and ₹5,000 for lumpsum investments.
How do the fund managers compare between Nippon India Large Cap Fund and SBI Bluechip Fund?
Nippon India Large Cap Fund boasts highly experienced fund managers, with Sailesh Raj Bhan having over 200 months of experience. SBI Bluechip Fund recently appointed Pradeep Kesavan and Saurabh Pant, each with only 1 month in their roles, indicating a recent management change.
Which fund has a better risk-adjusted return: Nippon India Large Cap Fund or SBI Bluechip Fund?
Nippon India Large Cap Fund offers better risk-adjusted returns, with higher Sharpe and Sortino ratios across multiple periods. This indicates that the fund provides higher returns relative to the risk taken.
What are Nippon India Large Cap Fund ratings compared to SBI Bluechip Fund?
Nippon India Large Cap Fund consistently receives higher ratings from CRISIL, Value Research, and Morning Star. For example, it holds a CRISIL rating 5 as of 31st March 2024, compared to 2 for SBI Bluechip Fund.
Which fund has a higher alpha: Nippon India Large Cap Fund or SBI Bluechip Fund?
Nippon India Large Cap Fund has a significantly higher alpha across 3-year, 5-year, and 10-year periods, indicating better excess returns over its benchmark than SBI Bluechip Fund. For instance, the 3-year alpha for Nippon India Large Cap Fund is 6.84%, while only 0.11% for SBI Bluechip Fund.
Disclaimer:
The information provided in this article is solely the author/advertisers’ opinion and not investment advice – it is provided for educational purposes only. Using this, you agree that the information does not constitute any investment or financial instructions by Ace Equity Research/Mutual Fund Focus/IPO First and the team. Anyone wishing to invest should seek their own independent financial or professional advice. Conduct your research with registered financial advisors before making any investment decisions. Ace Equity Research/ Mutual Fund Focus / IPO First and the team are not accountable for the investment views provided in the article.
Mutual Fund investments are subject to market risks. Read all scheme-related documents carefully.
Investments in the securities market are subject to market risks. Read all the related documents carefully before investing