Hey there, fellow investor! So, you’ve decided to dip your toes into the vast ocean of Multicap mutual funds, huh? Well, brace yourself because you’re in for a wild ride! Picture this: Nippon India Multicap Fund vs. Quant Active Fund are like two heavyweight contenders in the investment arena, each vying for the title of the ultimate money-maker. But fear not! We’re here to guide you through this jungle of financial jargon. Get ready to dive deep into our epic showdown between these funds as we uncover their strengths and weaknesses. By the end of this ride, you’ll be armed with all the knowledge you need to navigate your way to investment success. Let’s get started, shall we?
Investment Style
Nippon India Multicap Fund adopts a Growth investment style, focusing on high-potential stocks for capital appreciation. In contrast, Quant Active Fund follows a Blend strategy, balancing growth and value stocks to achieve stability and growth, catering to diverse market conditions and investor preferences.

Returns Analysis
Regarding investment style, both Nippon India Multicap Fund and Quant Active Fund follow a growth-oriented approach. They aim for capital appreciation by investing across a diversified portfolio of stocks with growth potential. So, if you’re seeking growth opportunities in the market, these funds align well with your investment objectives.
Let’s delve into the performance metrics of both funds to gauge their effectiveness in generating returns.
Trailing Returns
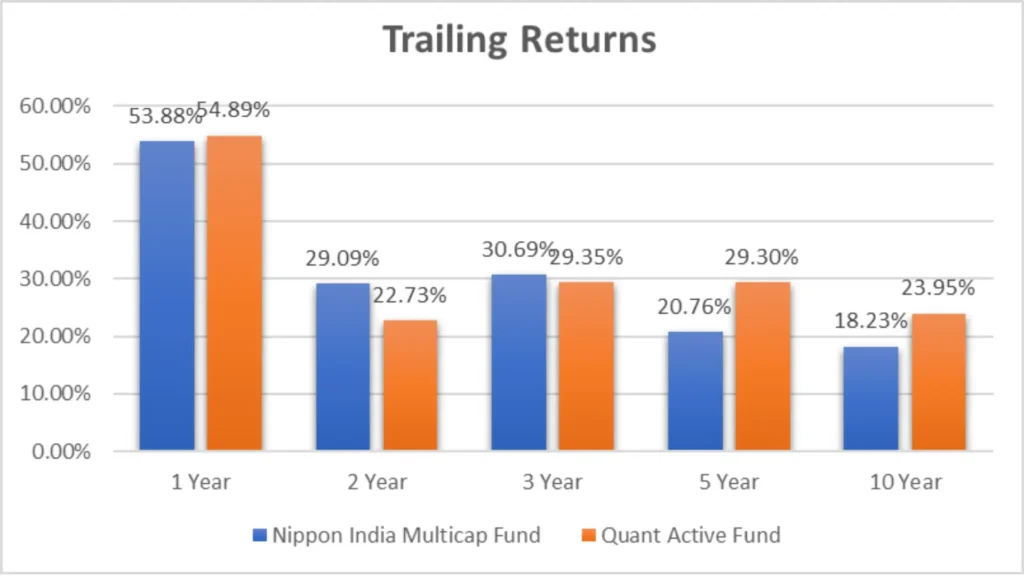
| Period Invested for | Nippon India Multicap Fund | Quant Active Fund |
| 1 Year | 53.88% | 54.89% |
| 2 Year | 29.09% | 22.73% |
| 3 Year | 30.69% | 29.35% |
| 5 Year | 20.76% | 29.30% |
| 10 Year | 18.23% | 23.95% |
Analysis:
- Over the past year, Quant Active Fund slightly outperformed Nippon India Multicap Fund by 1.01%.
- However, Nippon India Multicap Fund showcased better returns over the longer term, especially over the 10-year period, where it outperformed Quant Active Fund by 5.72%.
- The difference in returns between the two funds varies across different time frames, indicating the importance of considering long-term performance and short-term fluctuations.
Lumpsum Investment Value
Let’s examine how a lump sum investment would have fared in both funds over different time horizons.
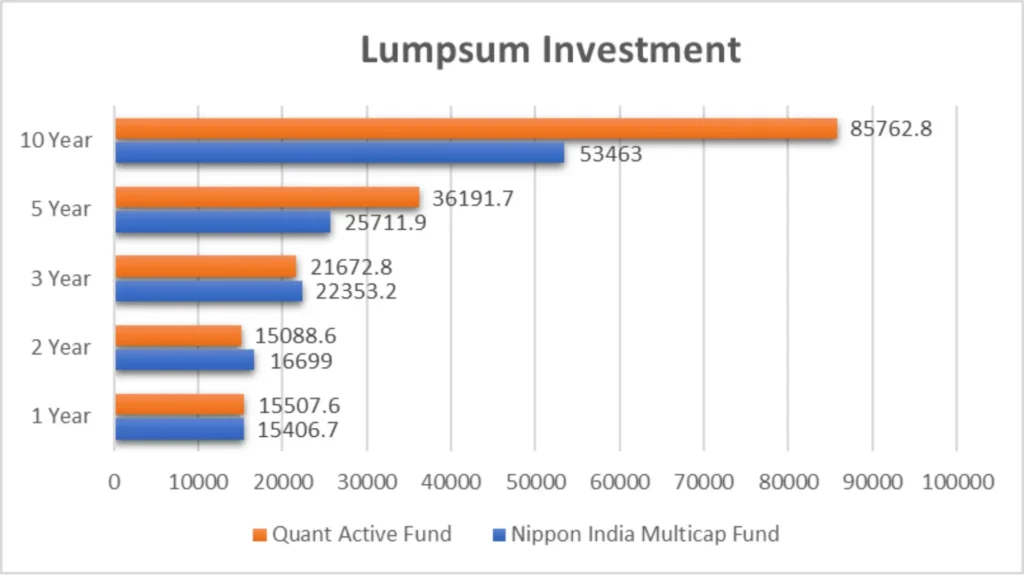
NAV as of 28th March 2024
| Period Invested for | Nippon India Multicap Fund | Quant Active Fund |
| 1 Year | 15406.7 | 15507.6 |
| 2 Year | 16699 | 15088.6 |
| 3 Year | 22353.2 | 21672.8 |
| 5 Year | 25711.9 | 36191.7 |
| 10 Year | 53463 | 85762.8 |
Analysis:
- Quant Active Fund marginally outperformed Nippon India Multicap Fund for investments over a shorter duration in terms of lump sum investment value.
- However, Nippon India Multicap Fund demonstrated superior growth over longer investment horizons, with higher investment values than Quant Active Fund.
Key Takeaways
- Investment Style: Both funds follow a growth-oriented approach, suitable for investors seeking capital appreciation.
- Returns Analysis: While Quant Active Fund showed slightly better returns over the past year, Nippon India Multicap Fund exhibited superior performance over extended time frames, indicating its potential for consistent growth.
- Lumpsum Investment Value: Nippon India Multicap Fund delivered higher investment values over extended periods than Quant Active Fund, emphasizing its long-term growth potential.
SIP Returns
SIP returns are crucial in evaluating the performance of mutual funds over various time horizons. Let’s see how Nippon India Multicap Fund and Quant Active Fund stack up regarding SIP returns.
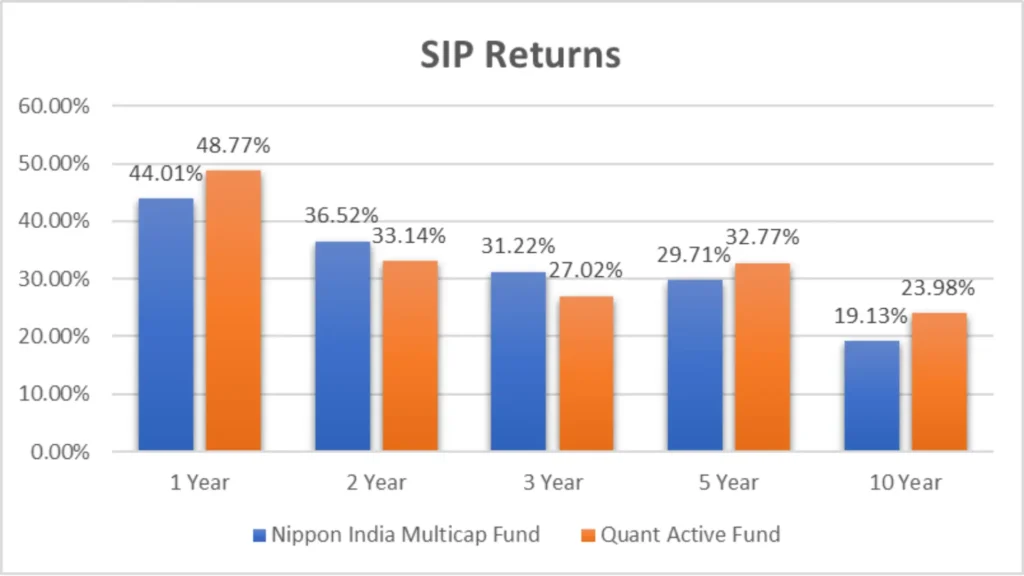
NAV as of 28th March 2024
| Period Invested for | Nippon India Multicap Fund | Quant Active Fund |
| 1 Year | 44.01% | 48.77% |
| 2 Year | 36.52% | 33.14% |
| 3 Year | 31.22% | 27.02% |
| 5 Year | 29.71% | 32.77% |
| 10 Year | 19.13% | 23.98% |
Data Analysis:
- Over the past year, Quant Active Fund has shown a higher SIP return of 48.77%, outperforming Nippon India Multicap Fund by 4.76%.
- However, across more extended time frames, like 10 years, Nippon India Multicap Fund has delivered a respectable SIP return of 19.13%, indicating its consistency over extended periods.
- It’s essential to consider your investment horizon and risk tolerance when interpreting SIP returns.
SIP Investment Value
Now, let’s delve into the investment value generated by SIP investments in both funds over different periods.
NAV as of 28th March 2024
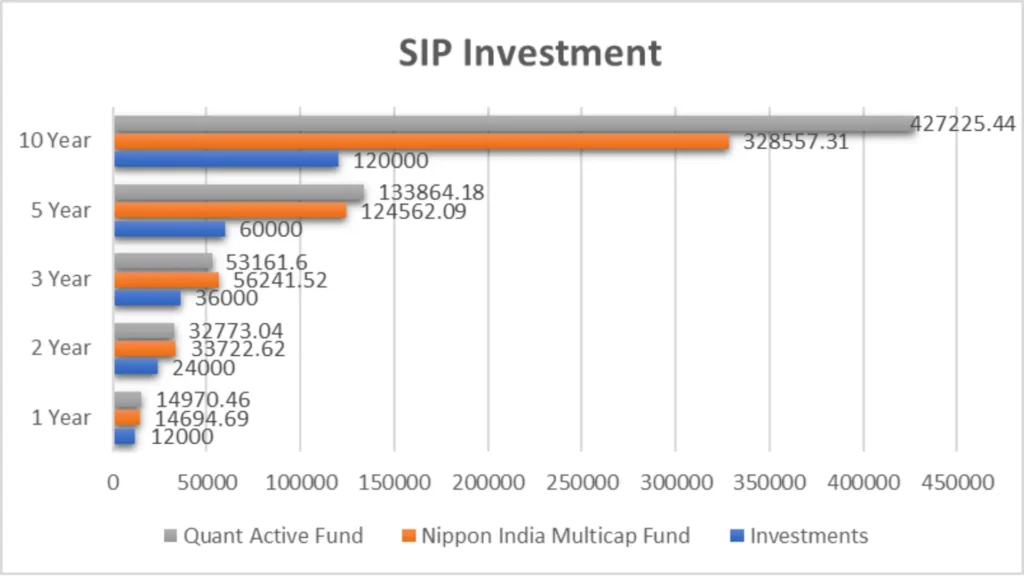
| Period Invested for | Investments | Nippon India Multicap Fund | Quant Active Fund |
| 1 Year | 12000 | 14694.69 | 14970.46 |
| 2 Year | 24000 | 33722.62 | 32773.04 |
| 3 Year | 36000 | 56241.52 | 53161.6 |
| 5 Year | 60000 | 124562.09 | 133864.18 |
| 10 Year | 120000 | 328557.31 | 427225.44 |
Data Analysis:
- For investments over one year, both funds have shown an increase in investment value, with Quant Active Fund slightly edging out Nippon India Multicap Fund.
- However, Nippon India Multicap Fund has demonstrated its ability to generate substantial investment value over longer durations, surpassing Quant Active Fund despite its initial lead.
CAGR
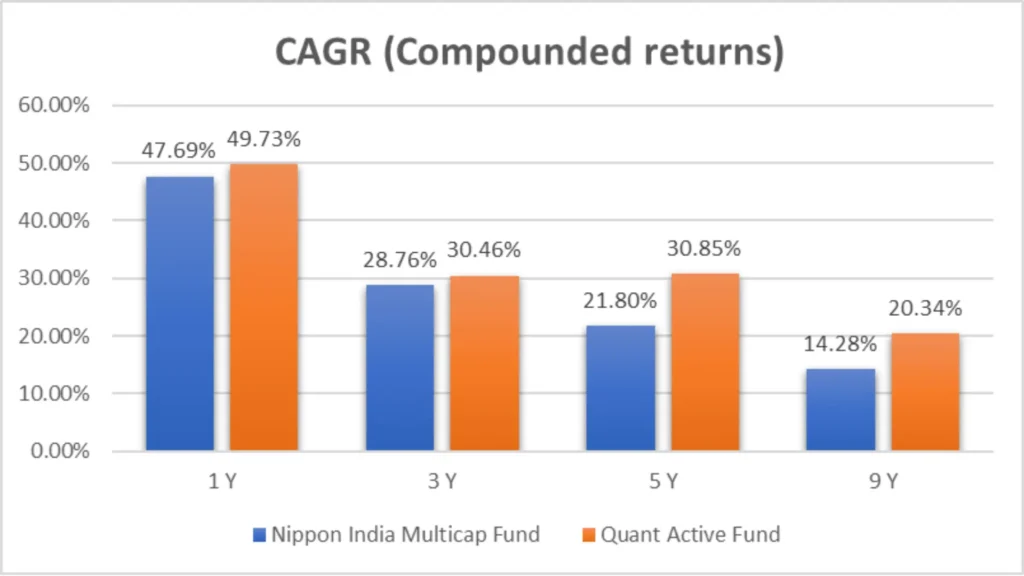
| Category | 1 Y | 3 Y | 5 Y | 9 Y |
| Nippon India Multicap Fund | 47.69% | 28.76% | 21.80% | 14.28% |
| Quant Active Fund | 49.73% | 30.46% | 30.85% | 20.34% |
Data Analysis:
- Both funds have displayed robust CAGR figures across different time frames, indicating their ability to generate consistent returns for investors.
Rolling Returns
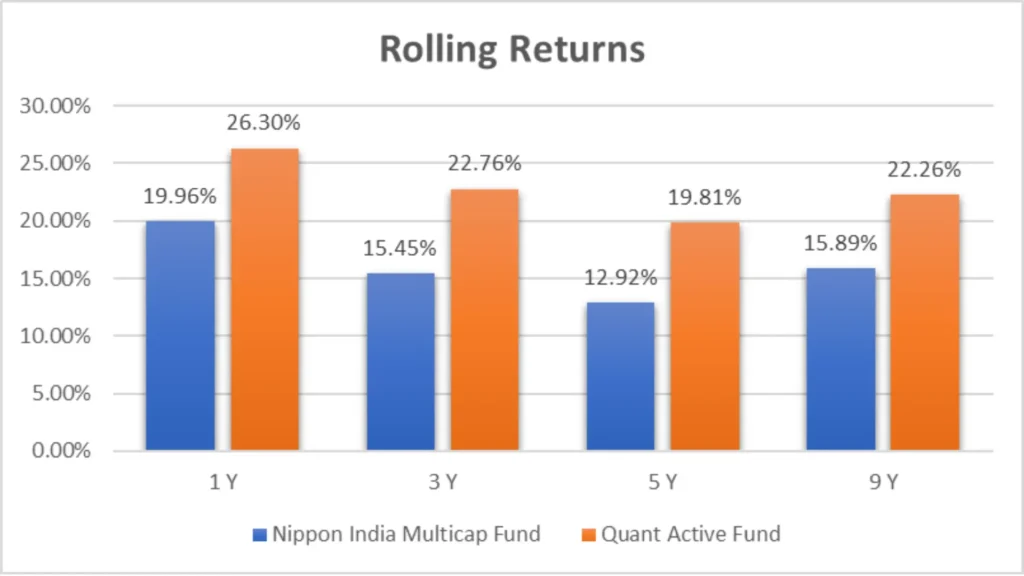
| Category | 1 Y | 3 Y | 5 Y | 9 Y |
| Nippon India Multicap Fund | 19.96% | 15.45% | 12.92% | 15.89% |
| Quant Active Fund | 26.30% | 22.76% | 19.81% | 22.26% |
Data Analysis:
- Quant Active Fund has shown higher rolling returns across all time frames than Nippon India Multicap Fund, reflecting its performance consistency.
Key Takeaways
- SIP Returns: While Quant Active Fund may offer higher SIP returns in the short term, Nippon India Multicap Fund showcases stability and consistency over more extended investment periods.
- SIP Investment Value: Despite initial differences, Nippon India Multicap Fund has the potential to generate significant investment value over extended durations, making it a compelling choice for long-term investors.
- Additional Metrics: Both funds exhibit strong CAGR and rolling returns, indicating their ability to generate consistent returns for investors across various time frames.
Annualized/Calendar Year Returns
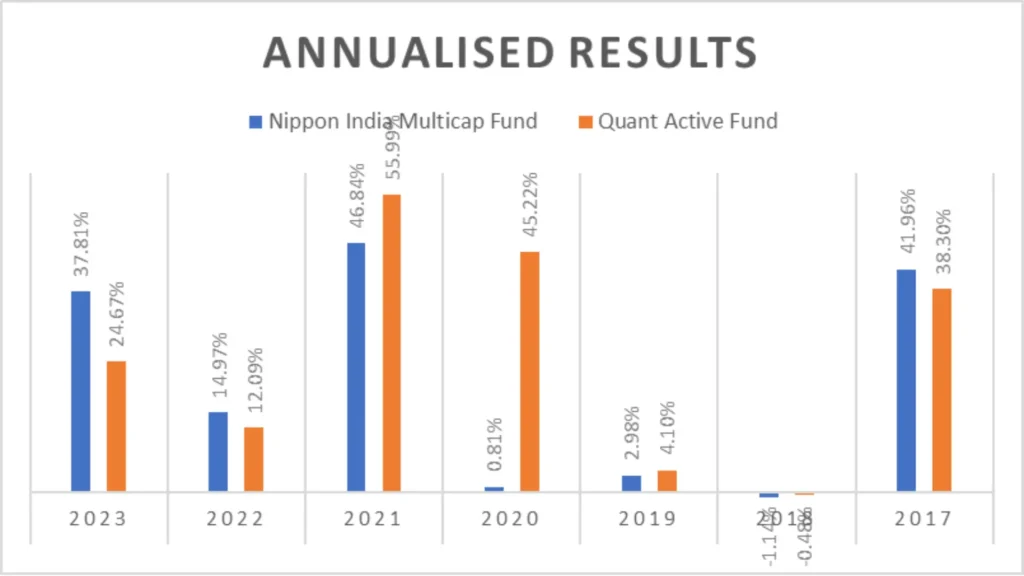
| Period | Nippon India Multicap Fund | Quant Active Fund |
| 2023 | 37.81% | 24.67% |
| 2022 | 14.97% | 12.09% |
| 2021 | 46.84% | 55.99% |
| 2020 | 0.81% | 45.22% |
| 2019 | 2.98% | 4.10% |
| 2018 | -1.14% | -0.48% |
| 2017 | 41.96% | 38.30% |
| No. of times Outperformance | 3 | 4 |
Data Analysis:
- In 2021, Nippon India Multicap Fund outperformed Quant Active Fund with a return of 46.84% compared to 55.99%.
- However, in 2023, Quant Active Fund exhibited a return of 24.67%, while Nippon India Multicap Fund stood at 37.81%.
- Over the analyzed period, Nippon India Multicap Fund outperformed Quant Active Fund three times, while Quant Active Fund outperformed four times.
Best Quarters
Let’s take a closer look at the best quarters for both funds.
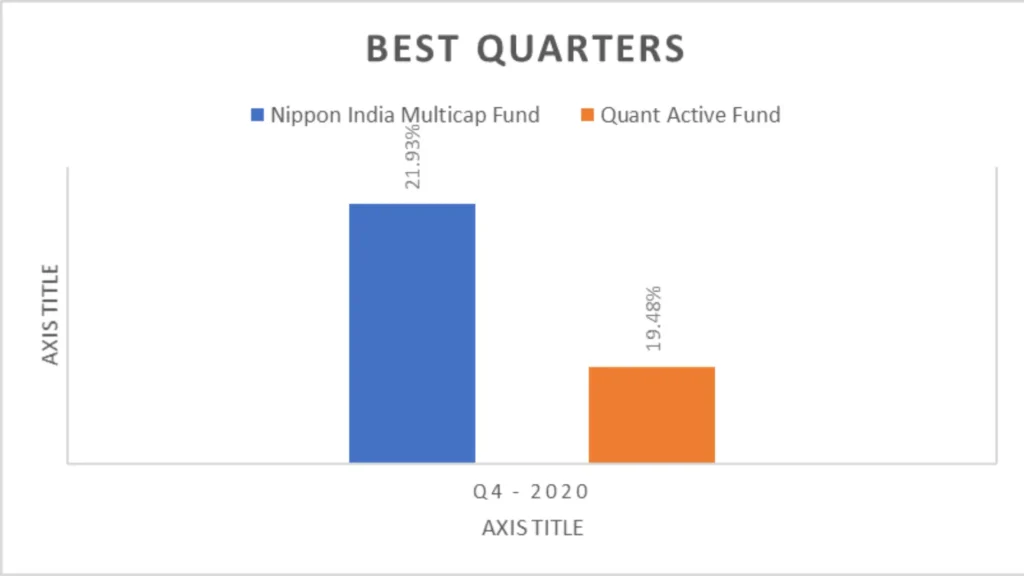
| Period | Nippon India Multicap Fund | Quant Active Fund |
| Q4 – 2020 | 21.93% | 19.48% |
Data Analysis:
- The fourth quarter of 2020 was the best for both funds, with Nippon India Multicap Fund showing a return of 21.93% and Quant Active Fund at 19.48%.
Worst Quarters
Now, let’s explore the worst quarters for both funds.
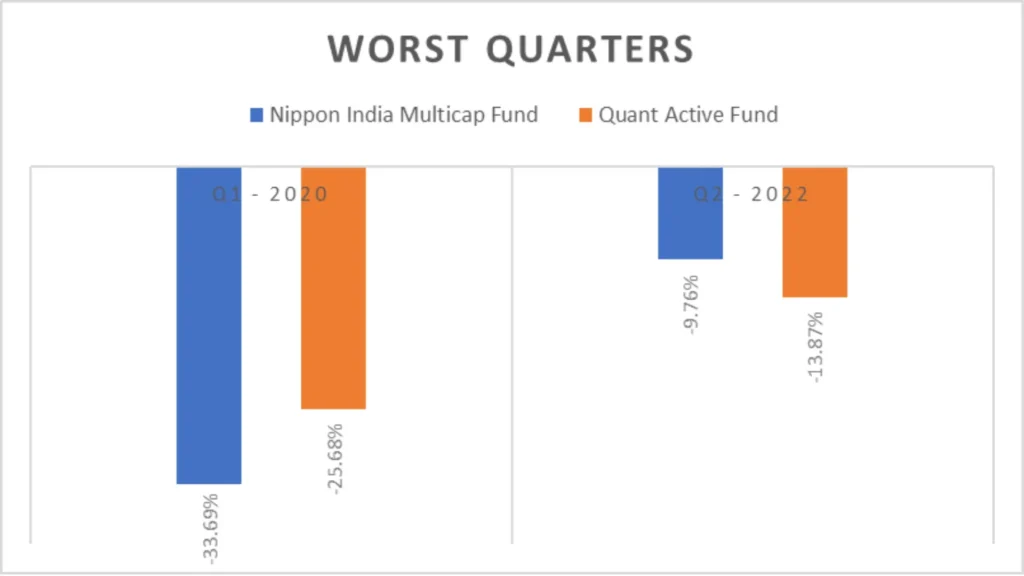
| Period | Nippon India Multicap Fund | Quant Active Fund |
| Q1 – 2020 | -33.69% | -25.68% |
| Q2 – 2022 | -9.76% | -13.87% |
Data Analysis:
- The first quarter of 2020 was the worst for both funds, with Nippon India Multicap Fund showing a return of -33.69% and Quant Active Fund at -25.68%.
- The second quarter of 2022 also saw negative returns for both funds, with Nippon India Multicap Fund at -9.76% and Quant Active Fund at -13.87%.
Key Takeaways
- Annualized Returns: Nippon India Multicap Fund and Quant Active Fund have shown varying performance across different years, with each fund having its share of outperformance.
- Best Quarters: The fourth quarter of 2020 emerged as the best for both funds, showcasing strong returns despite market volatility.
- Worst Quarters: The first quarter of 2020 marked the lowest point for both funds, reflecting the challenges faced during market downturns.
Quarterly Results
Quarterly results offer insights into the performance of mutual funds across different periods. Here’s a comparative analysis of the quarterly returns of Nippon India Multicap Fund and Quant Active Fund.

| Period | Nippon India Multicap Fund | Quant Active Fund |
| Q4 – 2023 | 9.50% | 12.53% |
| Q3 – 2023 | 10.77% | 10.05% |
| Q2 – 2023 | 16.85% | 12.89% |
| Q1 – 2023 | -1.82% | -9.66% |
| Q4 – 2022 | 2.25% | 5.63% |
| Q3 – 2022 | 17.58% | 17.30% |
| Q2 – 2022 | -9.76% | -13.87% |
| Q1 – 2022 | 4.08% | 3.19% |
| Q4 – 2021 | 0.57% | 3.09% |
| Q3 – 2021 | 16.41% | 12.96% |
| Q2 – 2021 | 9.40% | 17.69% |
| Q1 – 2021 | 14.26% | 12.53% |
| Q4 – 2020 | 21.93% | 19.48% |
| Q3 – 2020 | 7.72% | 22.19% |
| Q2 – 2020 | 16.48% | 34.78% |
| Q1 – 2020 | -33.69% | -25.68% |
| Q4 – 2019 | 6.35% | 5.20% |
| Q3 – 2019 | -6.99% | -4.35% |
| Q2 – 2019 | 0.58% | 0.57% |
| Q1 – 2019 | 4.18% | 2.47% |
| Q4 – 2018 | 7.21% | 1.47% |
| Q3 – 2018 | 2.31% | 0.46% |
| Q2 – 2018 | -2.41% | 0.58% |
| Q1 – 2018 | -7.82% | -3.32% |
| Q4 – 2017 | 14.46% | 13.02% |
| Q3 – 2017 | 2.74% | 3.91% |
| Q2 – 2017 | 4.80% | 5.13% |
| Q1 – 2017 | 15.19% | 12.02% |
| Q4 – 2016 | -6.79% | -5.51% |
| Q3 – 2016 | 3.72% | 3.87% |
| Nippon India Multicap Fund | Quant Active Fund | |
| Outperformance | 16 | 14 |
Data Analysis:
- The quarterly returns of both funds fluctuate over time, reflecting the market’s volatility.
- Nippon India Multicap Fund outperformed Quant Active Fund in 16 quarters, while Quant Active Fund outperformed in 14.
Key Takeaways
- Performance Fluctuations: The quarterly returns of both funds exhibit fluctuations influenced by various market factors and economic conditions.
- Outperformance Trends: While Nippon India Multicap Fund has outperformed in more quarters overall, both funds have had periods of relative strength and weakness.
- Consideration for Investors: Investors should consider the quarterly performance of mutual funds alongside other factors such as long-term growth potential, risk tolerance, and investment objectives.


Risk Analysis
Maximum Drawdown
Maximum Drawdown measures the most significant loss from a peak to a trough during a specific period. Here’s a comparison of the maximum Drawdown for both funds over 3 and 5 years.
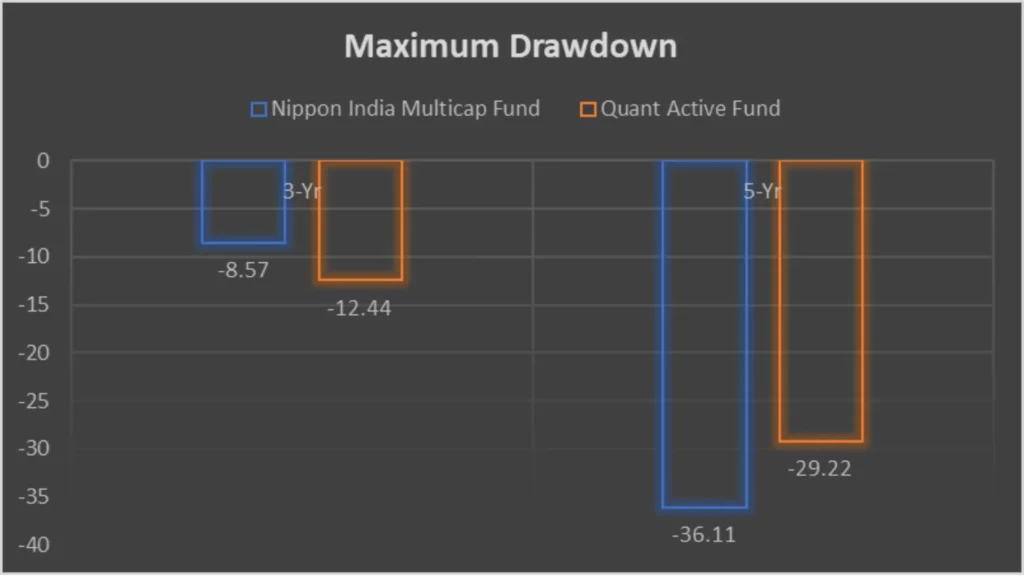
| 3-Yr | 5-Yr | |
| Nippon India Multicap Fund | -8.57 | -36.11 |
| Quant Active Fund | -12.44 | -29.22 |
Data Analysis:
- Nippon India Multicap Fund has experienced a maximum drawdown of -8.57% over 3 years and -36.11% over 5 years.
- Quant Active Fund’s maximum Drawdown is -12.44% over 3 years and -29.22% over 5 years.
mean Return, Sortino Ratio, Treynor’s Ratio, standard deviation, Sharpe ratio, beta, and alpha.
Let’s delve deeper into various risk analysis metrics for both funds, including mean Return, Sortino Ratio, Treynor’s Ratio, standard deviation, Sharpe ratio, beta, and alpha.
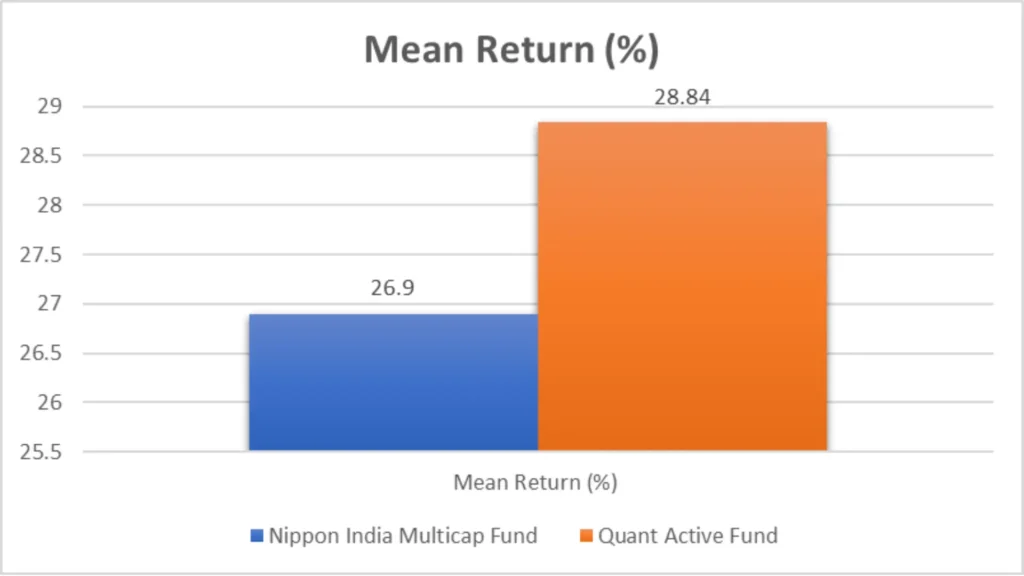
| Metric | Nippon India Multicap Fund | Quant Active Fund |
| Mean Return (%) | 26.9 | 28.84 |
| Sortino Ratio (%) | 2.88 | 2.26 |
| Treynor’s Ratio (%) | 0.2 | 0.18 |
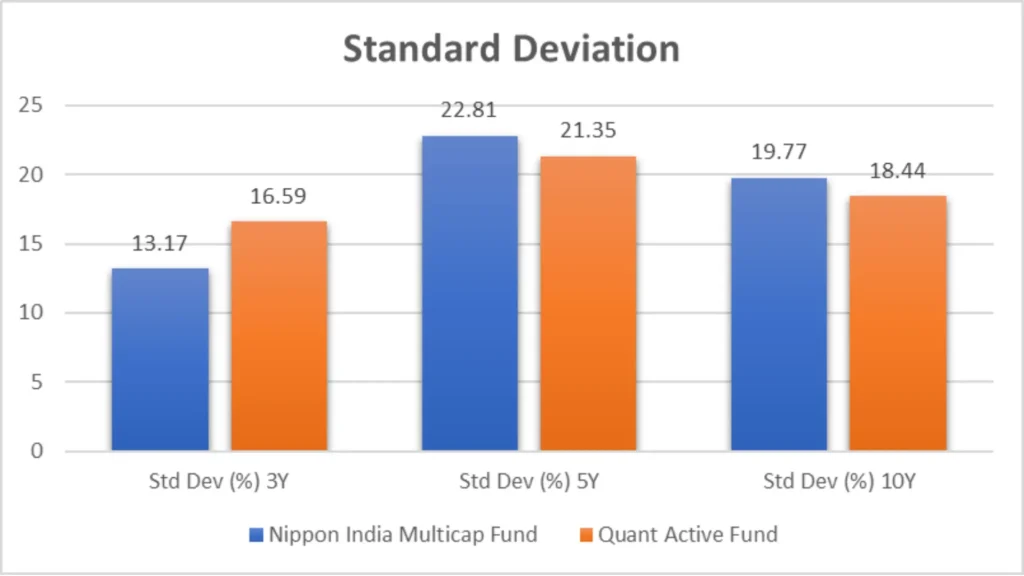
| Std Dev (%) 3Y | 13.17 | 16.59 |
| Std Dev (%) 5Y | 22.81 | 21.35 |
| Std Dev (%) 10Y | 19.77 | 18.44 |
| Sharpe Ratio (%) 3Y | 1.65 | 1.42 |
| Sharpe Ratio (%) 5Y | 0.78 | 1.15 |
| Sharpe Ratio (%) 10Y | 0.68 | 0.99 |
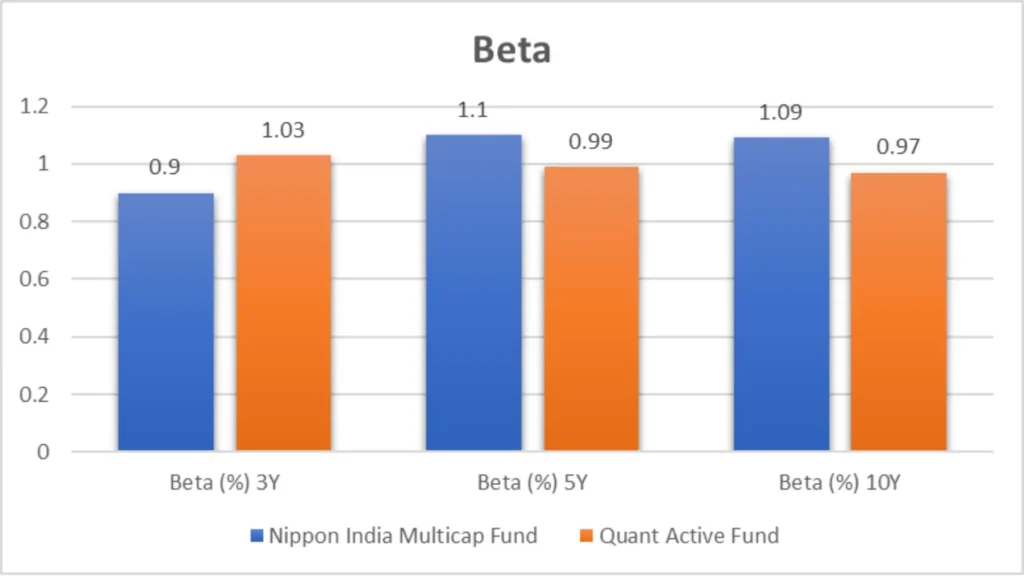
| Beta (%) 3Y | 0.9 | 1.03 |
| Beta (%) 5Y | 1.1 | 0.99 |
| Beta (%) 10Y | 1.09 | 0.97 |
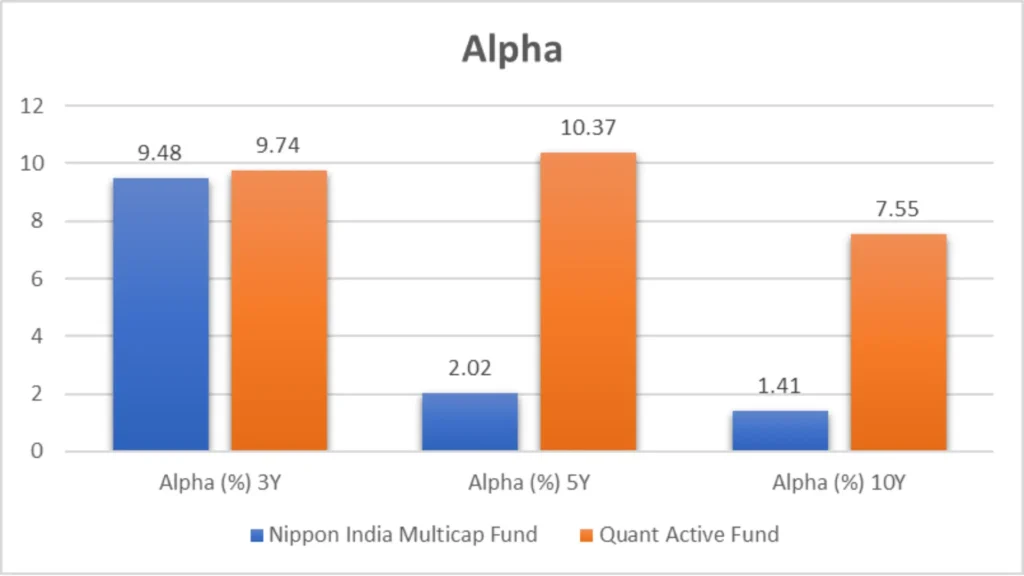
| Alpha (%) 3Y | 9.48 | 9.74 |
| Alpha (%) 5Y | 2.02 | 10.37 |
| Alpha (%) 10Y | 1.41 | 7.55 |
Data Analysis:
- Mean Return: Quant Active Fund exhibits a slightly higher mean return than Nippon India Multicap Fund.
- Sortino Ratio: Nippon India Multicap Fund has a higher Sortino ratio, indicating better risk-adjusted returns.
- Treynor’s Ratio: Both funds have relatively low Treynor’s ratios, indicating moderate risk-adjusted performance.
- Standard Deviation: Quant Active Fund shows a higher standard deviation across all time frames, suggesting higher volatility.
- Sharpe Ratio: Nippon India Multicap Fund demonstrates higher Sharpe ratios over 3 years and 10 years, indicating better risk-adjusted returns per unit of risk.
- Beta: Nippon India Multicap Fund has lower beta values, indicating lower volatility than the market.
- Alpha: Quant Active Fund exhibits higher alpha values, indicating superior risk-adjusted performance compared to the benchmark.
Key Takeaways
- Maximum Drawdown: Nippon India Multicap Fund has experienced lower maximum drawdowns than Quant Active Fund over both 3-year and 5-year periods.
- Risk Analysis Metrics: While Quant Active Fund demonstrates slightly higher mean returns, Nippon India Multicap Fund shows better risk-adjusted performance across several metrics, including Sortino ratio, Sharpe ratio, and alpha.
Portfolio Analysis
Understanding the composition of mutual fund portfolios is essential for investors to grasp where their money is being invested. Let’s dive into a detailed comparative analysis of the portfolio composition and market cap allocation between Nippon India Multicap Fund and Quant Active Fund.
Portfolio Overlapping Comparison
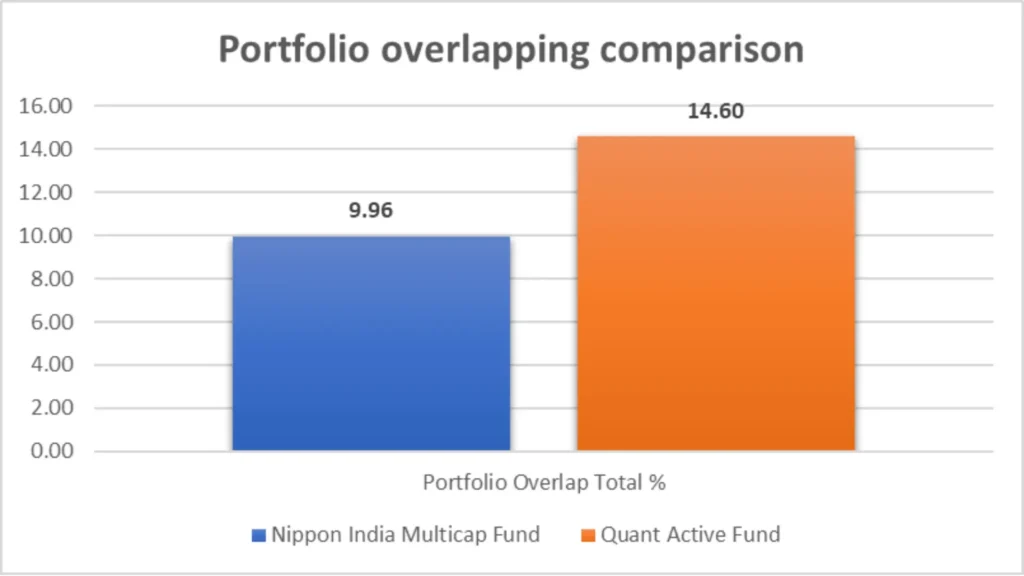
Portfolio overlap measures the degree to which two funds hold similar stocks. Here’s a comparison of the portfolio overlap percentage between Nippon India Multicap Fund and Quant Active Fund.
Portfolio Analysis
Portfolio Overlapping Comparison
| Nippon India Multicap Fund | Quant Active Fund | |
| Portfolio Overlap Total % | 9.96 | 14.60 |
Data Analysis:
- Nippon India Multicap Fund has a portfolio overlap of 9.96%, indicating a lower degree of similarity with other funds.
- Quant Active Fund shows a higher portfolio overlap percentage at 14.60%.
Portfolio Composition
Now, let’s analyze the composition of the portfolios of both funds across various asset classes.
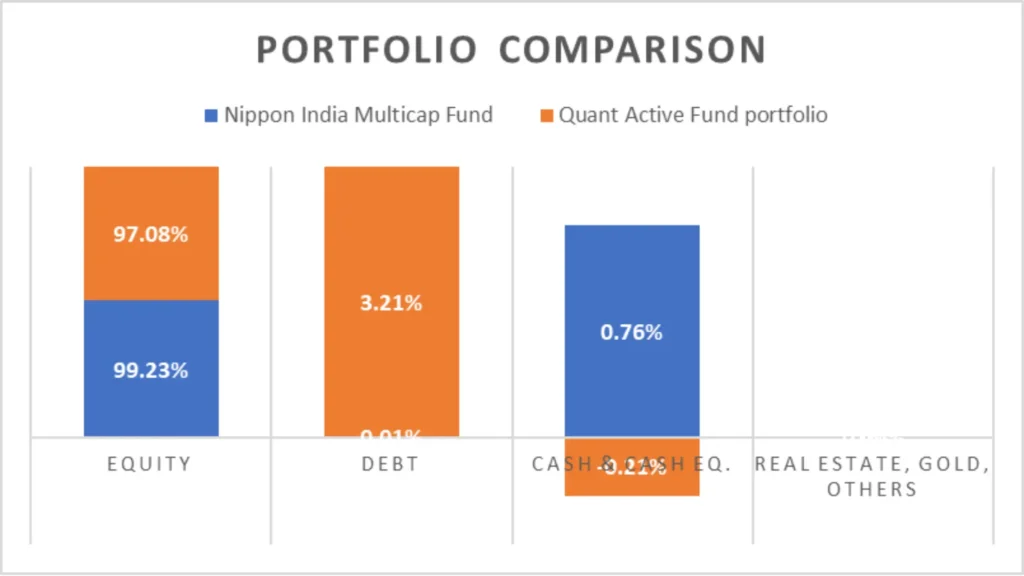
| Nippon India Multicap Fund | Quant Active Fund Portfolio | |
| Equity | 99.23% | 97.08% |
| Debt | 0.01% | 3.21% |
| Cash & Cash Eq. | 0.76% | -0.21% |
| Real Estate, Gold, Others | 0% | 0.00% |
Data Analysis:
- Both funds primarily invest in equities, with Nippon India Multicap Fund allocating 99.23% and Quant Active Fund allocating 97.08% to equity.
- Quant Active Fund has a higher allocation to debt instruments (3.21%) than Nippon India Multicap Fund (0.01%).
Market Cap Allocation
Market capitalization allocation provides insights into the size and type of companies each fund invests in.
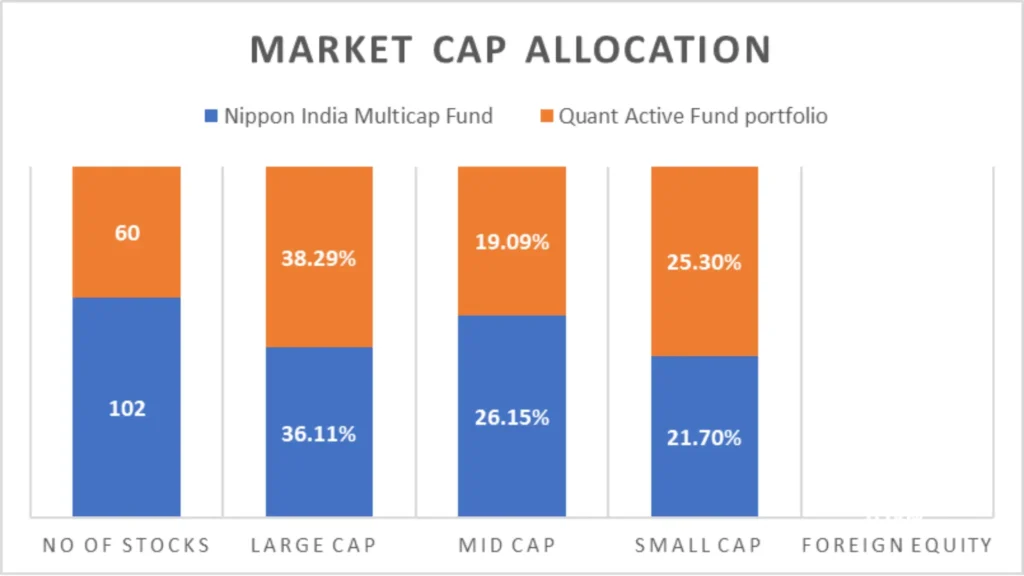
| Nippon India Multicap Fund | Quant Active Fund Portfolio | |
| No of Stocks | 102 | 60 |
| Large Cap | 36.11% | 38.29% |
| Mid Cap | 26.15% | 19.09% |
| Small Cap | 21.70% | 25.30% |
| Foreign Equity | 0.00% | 0.00% |
Data Analysis:
- Nippon India Multicap Fund holds a more diversified portfolio with 102 stocks compared to Quant Active Fund’s 60 stocks.
- Both funds have a significant allocation to large-cap stocks, with Quant Active Fund slightly higher at 38.29% compared to Nippon India Multicap Fund’s 36.11%.
- Nippon India Multicap Fund has a higher allocation to mid-cap stocks (26.15%) than Quant Active Fund (19.09%).
- Quant Active Fund allocates more to small-cap stocks (25.30%) than Nippon India Multicap Fund (21.70%).
Sector Allocation
Sector allocation showcases the distribution of investments across various industry sectors.
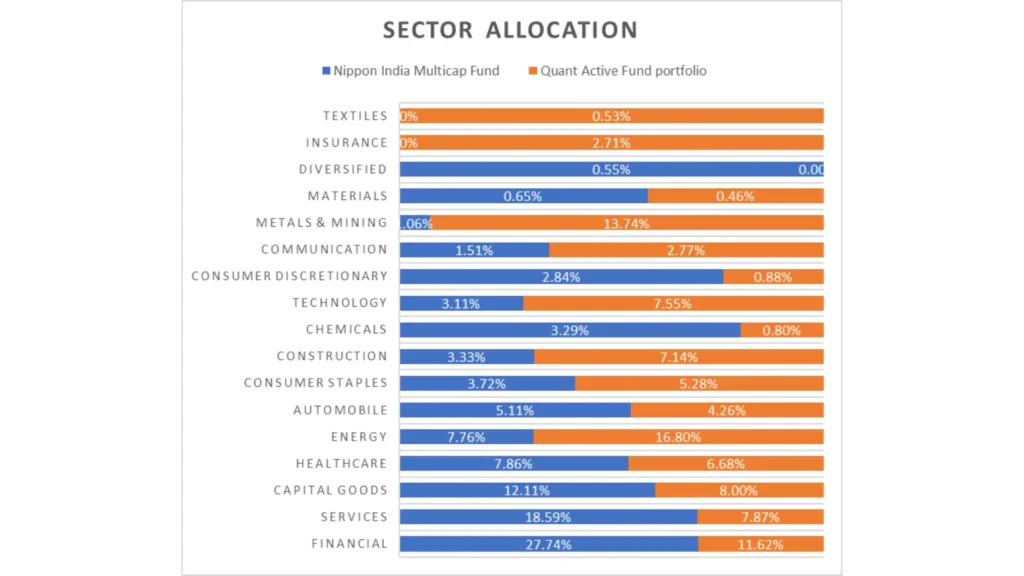
| Sector | Nippon India Multicap Fund | Quant Active Fund Portfolio |
| Financial | 27.74% | 11.62% |
| Services | 18.59% | 7.87% |
| Capital Goods | 12.11% | 8.00% |
| Healthcare | 7.86% | 6.68% |
| Energy | 7.76% | 16.80% |
| Automobile | 5.11% | 4.26% |
| Consumer Staples | 3.72% | 5.28% |
| Construction | 3.33% | 7.14% |
| Chemicals | 3.29% | 0.80% |
| Technology | 3.11% | 7.55% |
| Consumer Discretionary | 2.84% | 0.88% |
| Communication | 1.51% | 2.77% |
| Metals & Mining | 1.06% | 13.74% |
| Materials | 0.65% | 0.46% |
| Diversified | 0.55% | NA |
| Insurance | NA | 2.71% |
| Textiles | NA | 0.53% |
Data Analysis:
- Nippon India Multicap Fund shows a more balanced sector allocation across various industries, with significant financial, services, and capital goods exposure.
- Quant Active Fund has higher exposure to energy, metals & mining, and construction sectors.
Key Takeaways
- Portfolio Overlapping: Quant Active Fund exhibits a higher portfolio overlap percentage than Nippon India Multicap Fund, indicating more remarkable similarity with other funds.
- Portfolio Composition: Both funds primarily invest in equities, with slight variations in debt and cash holdings.
- Market Cap Allocation: Nippon India Multicap Fund holds a more diversified portfolio across large-cap, mid-cap, and small-cap stocks than Quant Active Fund.
- Sector Allocation: Nippon India Multicap Fund displays a more balanced sector allocation. Quant Active Fund is more exposed to specific sectors like energy, metals & mining.
Fund Management Comparison
Fund Management Comparison
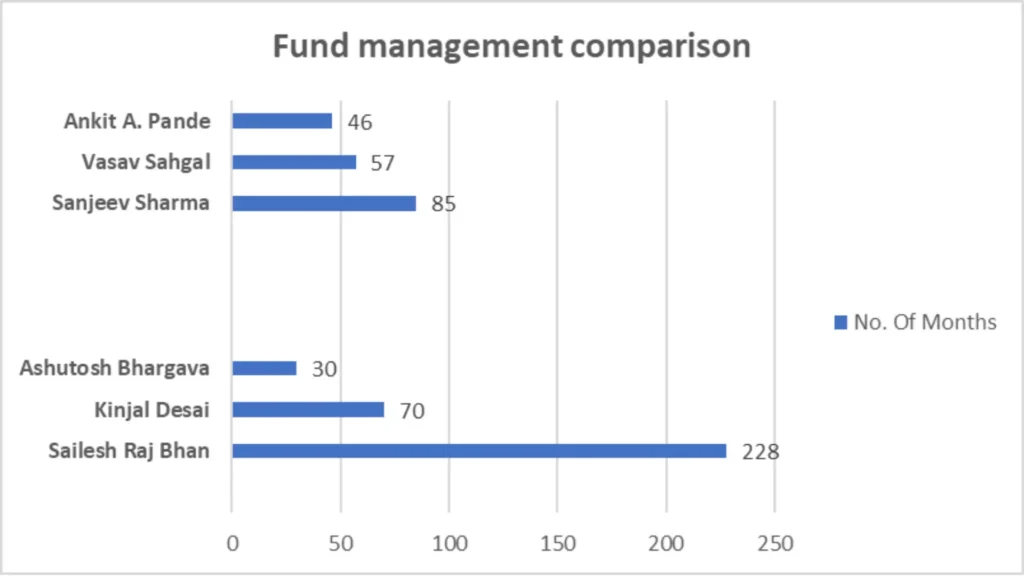
| Fund Manager | No. Of Months | |
| Nippon India Multicap Fund | ||
| Sailesh Raj Bhan | 228 | |
| Kinjal Desai | 70 | |
| Ashutosh Bhargava | 30 | |
| Quant Active Fund | ||
| Sanjeev Sharma | 85 | |
| Vasav Sahgal | 57 | |
| Ankit A. Pande | 46 |
Nippon India Multicap Fund
- Sailesh Raj Bhan: With a tenure of 228 months, Sailesh Raj Bhan has extensive experience managing the Nippon India Multicap Fund.
- Kinjal Desai: Kinjal Desai has managed the fund for 70 months, contributing to its growth and stability.
- Ashutosh Bhargava: with 30 months of experience, Ashutosh Bhargava brings fresh perspectives to fund management.
Quant Active Fund
- Sanjeev Sharma: Leading the Quant Active Fund for 85 months, Sanjeev Sharma has consistently performed.
- Vasav Sahgal: With 57 months of experience, Vasav Sahgal has significantly shaped the fund’s strategies.
- Ankit A. Pande: Ankit A. Pande, managing the fund for 46 months, contributes valuable insights to the fund’s management.
Star Ratings Comparison
| Ratings Source | Nippon India Multicap Fund | Quant Active Fund |
|---|---|---|
| CRISIL Ratings (as on 31st Mar 2024) | ⭐⭐⭐⭐☆ | ⭐⭐☆☆☆ |
| CRISIL Ratings (as on 31st Dec 2023) | ⭐⭐⭐⭐⭐ | ⭐⭐☆☆☆ |
| CRISIL Ratings (as on 30th Sep 2023) | ⭐⭐⭐⭐⭐ | ⭐☆☆☆☆ |
| CRISIL Ratings (as on 30th Jun 2023) | ⭐⭐⭐⭐⭐ | ⭐⭐⭐☆☆ |
| CRISIL Ratings (as on 31st Mar 2023) | ⭐⭐⭐⭐⭐ | ⭐⭐⭐⭐☆ |
| Value Research Ratings | NA | NA |
| Morning Star Ratings | ⭐⭐⭐☆☆ | ⭐⭐⭐⭐⭐ |
| Economic Times Ratings | NA | NA |
| Groww Ratings | NA | NA |
| AngelOne AQR Ratings | ⭐⭐⭐⭐☆ | ⭐⭐⭐⭐☆ |
| 5Paisa Ratings | NA | NA |
| KUVERA ratings | ⭐⭐⭐☆☆ | ⭐⭐⭐⭐⭐ |
| Average Ratings | ⭐⭐⭐⭐☆ | ⭐⭐⭐☆☆ |
Data Analysis:
- Nippon India Multicap Fund consistently maintains higher CRISIL ratings than Quant Active Fund, indicating better performance and stability.
Value Research Ratings & Morning Star Ratings
| Ratings | Nippon India Multicap Fund | Quant Active Fund |
| Value Research Ratings | NA | NA |
| Morning Star Ratings | 3 | 5 |
Data Analysis:
- The morning Star rating rate of Quant Active Fund is higher than that of Nippon India Multicap Fund, suggesting superior performance based on their evaluation metrics.
Other Important General Details
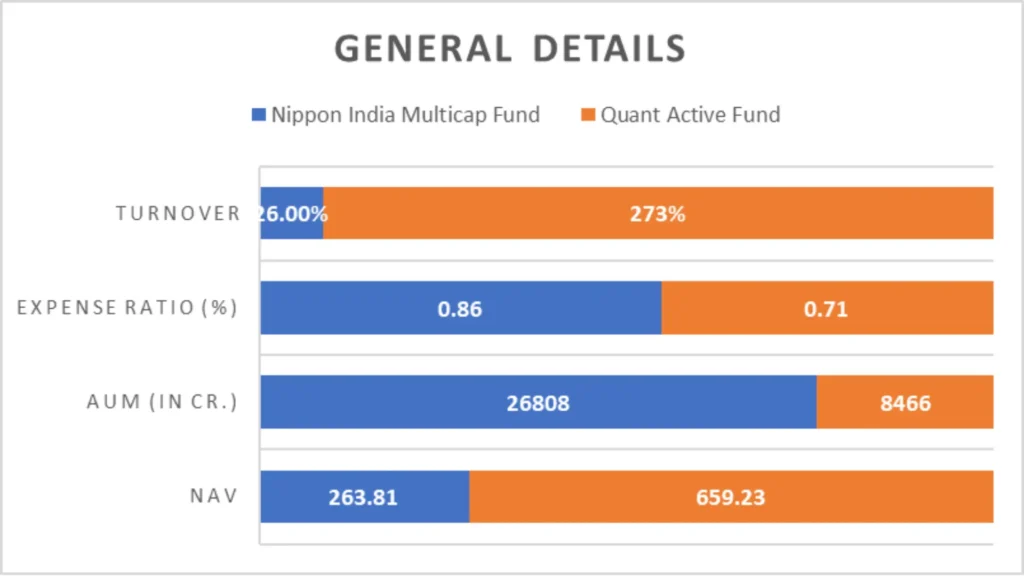
| NAV | AUM (in Cr.) | Expense Ratio (%) | Turnover | Benchmark | |
| Nippon India Multicap Fund | 263.81 | 26808 | 0.86 | 26.00% | NIFTY 500 |
| Quant Active Fund | 659.23 | 8466 | 0.71 | 273% | NIFTY 100 |
Data Analysis:
- Quant Active Fund has a higher NAV than Nippon India Multicap Fund, indicating a higher unit price per share.
- Nippon India Multicap Fund boasts a significantly higher AUM, reflecting investors’ trust and confidence in the fund.
- Quant Active Fund has a lower expense ratio, potentially leading to lower costs for investors than Nippon India Multicap Fund.
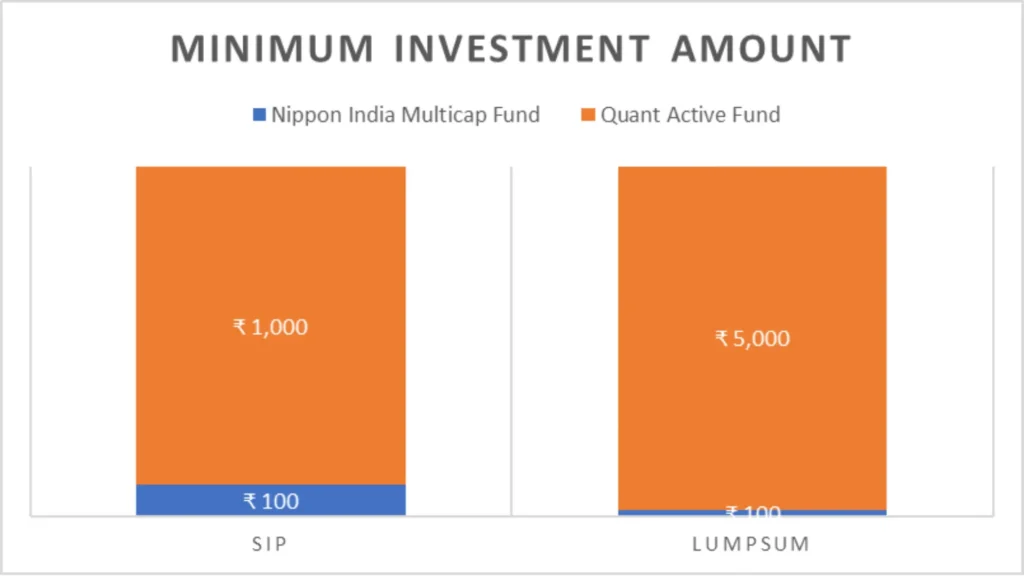
Minimum Investment Amount
Other Important General Details
| NAV | AUM (in Cr.) | Expense Ratio (%) | Turnover | Benchmark | |
| Nippon India Multicap Fund | 263.81 | 26808 | 0.86 | 26.00% | NIFTY 500 |
| Quant Active Fund | 659.23 | 8466 | 0.71 | 273% | NIFTY 100 |
Data Analysis:
- Both funds offer affordable minimum investment amounts, catering to investors with varying budget constraints.
Key Takeaways
- Fund Manager Expertise: Sailesh Raj Bhan’s extensive tenure at Nippon India Multicap Fund provides stability and experience. At the same time, Quant Active Fund boasts a diverse team of managers with varied experiences.
- Rating Comparison: Nippon India Multicap Fund holds higher CRISIL ratings, indicating consistent performance and reliability. Meanwhile, the Morning Star rating favours Quant Active Fund.
- General Details: While Nippon India Multicap Fund has a higher AUM and expense ratio, Quant Active Fund boasts a higher NAV and lower expense ratio, offering competitive advantages.
When choosing between these funds, investors should consider these factors, investment objectives and risk tolerance.
Conclusion:
In conclusion, the comparative analysis between the Nippon India Multicap Fund and the Quant Active Fund provides investors with valuable insights into these mutual funds’ performance, portfolio composition, fund management, and ratings. While both funds offer growth-oriented investment strategies, Nippon India Multicap Fund is preferable for investors seeking consistency and stability over longer investment horizons.
With superior performance across various parameters, including trailing returns, risk-adjusted metrics, and portfolio diversification, Nippon India Multicap Fund is the better option for conservative investors with a long-term outlook. On the other hand, Quant Active Fund may charm investors with a higher risk appetite, offering potentially higher returns and lower expenses but with greater volatility and shorter investment horizons in mind. When selecting these funds, investors should consider their investment goals, risk tolerance, and time horizons.

We hope you found this guide on mutual funds helpful.
If you have any mutual fund-related queries, feel free to comment below—we’re here to help! S.K. Singh, a registered professional with the Association of Mutual Funds in India (AMFI), will answer your queries and holds the ARN-251149.
Invest wisely!
FAQs: Nippon India Multicap Fund vs. Quant Active Fund
1. Which mutual fund is better, Nippon India Multicap Fund or Quant Active Fund?
Both Nippon India Multicap Fund and Quant Active Fund have their strengths. Nippon India Multicap Fund showcases superior performance over longer investment horizons and boasts higher CRISIL ratings, indicating stability and reliability. On the other hand, Quant Active Fund may appeal to investors with higher risk appetites due to potentially higher returns and lower expenses.
2. What investment style do Nippon India Multicap Fund and Quant Active Fund follow?
Both funds follow a growth-oriented investment style, aiming for capital rise by investing in a diversified portfolio of stocks with growth potential.
3. How do the returns of Nippon India Multicap Fund and Quant Active Fund compare?
While Quant Active Fund may show slightly better returns over shorter periods, Nippon India Multicap Fund demonstrates superior performance over longer investment horizons. However, the choice depends on investors’ time horizons and risk tolerances.
4. What is the minimum investment amount for Nippon India Multicap Fund and Quant Active Fund?
Nippon India Multicap Fund requires a minimum investment of ₹100 for SIP and lump sum investments. In contrast, Quant Active Fund has a minimum investment requirement of ₹1,000 for SIP and ₹5,000 for lump sum investments.
5. How do the fund managers’ tenures compare between Nippon India Multicap Fund and Quant Active Fund?
Sailesh Raj Bhan leads the Nippon India Multicap Fund and has extensive experience. At the same time, Quant Active boasts a diverse team of managers with varying experiences. Both funds have competent management teams to oversee their investment strategies.
6. What are the CRISIL ratings for Nippon India Multicap Fund and Quant Active Fund?
Nippon India Multicap Fund consistently maintains higher CRISIL ratings, indicating better performance and stability than Quant Active.
7. Which sectors do Nippon India Multicap Fund and Quant Active Fund invest in?
Nippon India Multicap Fund shows a more balanced sector allocation, with significant exposure to financial, services, and capital goods sectors. On the other hand, Quant Active Fund is more exposed to sectors like energy, metals & mining, and construction.
8. What is the NAV (Net Asset Value) and AUM (Assets Under Management) of Nippon India Multicap Fund and Quant Active Fund?
Quant Active has a higher NAV than Nippon India Multicap Fund, indicating a higher unit price per share. However, Nippon India Multicap Fund boasts a significantly higher AUM, reflecting investors’ trust and confidence in the fund.
9. How do SIP returns compare between Nippon India Multicap Fund and Quant Active Fund?
Quant Active may offer higher SIP returns in the short term. Still, Nippon India Multicap Fund showcases stability and consistency over more extended investment periods.
10. Which fund suits conservative investors, Nippon India Multicap Fund or Quant Active Fund?
Nippon India Multicap Fund is more suitable for conservative investors due to its consistent performance over longer horizons and higher CRISIL ratings, indicating stability and reliability. However, investors with higher risk appetites may find Quant Active appealing for its potentially higher returns and lower expenses.