Hey there, fellow investor! Are you ready to navigate the world of Flexicap funds like a pro? If you’re scratching your head trying to pick between the HDFC Flexi Cap Fund vs Parag Parikh Flexi Cap Fund, fret not! This blog is your compass through the jungle of investment options.
We’re delving into these two heavyweights, breaking down their strengths and quirks in a five-step showdown. Picture it as a face-off between two titans, each vying for a spot in your investment portfolio.
Please think of us as your financial tour guides, leading you through the wilderness of mutual funds. We’ll arm you with the knowledge you need to make an informed decision. After all, it’s not just about picking any old fund – it’s about finding the one that consistently delivers the goods.
Investment Style
Parag Parikh Flexi Cap Fund: Growth
HDFC Flexi Cap Fund: Growth
Both funds share a growth-oriented investment style, which indicates a strategy focused on capital appreciation over the long term. Growth-oriented funds typically invest in companies with the potential for significant expansion, aligning with investors seeking wealth accumulation through capital gains.
Now, let’s delve into the crux of the matter: returns analysis.

Returns Analysis
Trailing Returns

| Period Invested for | Parag Parikh Flexi Cap Fund | HDFC Flexi Cap Fund |
| 1 Year | 41.78% | 44.01% |
| 2 Year | 24.59% | 29.91% |
| 3 Year | 24.36% | 25.30% |
| 5 Year | 24.43% | 20.85% |
| 10 Year | 20.88% | 18.54% |
The returns analysis provides a snapshot of the fund’s performance over various investment horizons. Notably, both funds have exhibited commendable performance, although with slight variations.
Over the one year, HDFC Flexi Cap Fund boasts a marginally higher return of 44.01% compared to Parag Parikh Flexi Cap Fund’s 41.78%. However, when extending the investment horizon to ten years, Parag Parikh Flexi Cap Fund demonstrates resilience, yielding a return of 20.88% versus HDFC Flexi Cap Fund’s 18.54%.
Lumpsum Investment Value
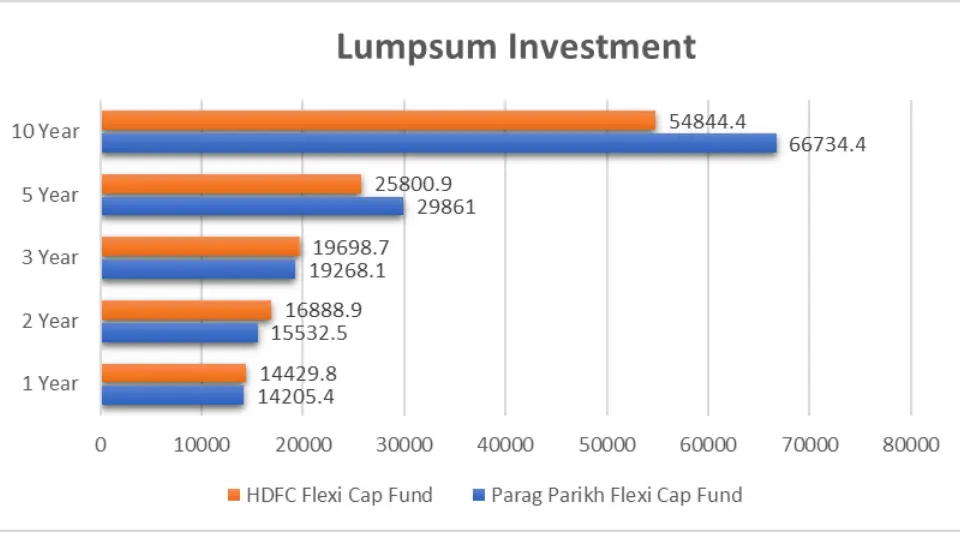
| Period Invested for | Parag Parikh Flexi Cap Fund | HDFC Flexi Cap Fund |
| 1 Year | ₹14,205.4 | ₹14,429.8 |
| 2 Year | ₹15,532.5 | ₹16,888.9 |
| 3 Year | ₹19,268.1 | ₹19,698.7 |
| 5 Year | ₹29,861 | ₹25,800.9 |
| 10 Year | ₹66,734.4 | ₹54,844.4 |
The lumpsum investment value analysis sheds light on the growth trajectory of investments made over varying time frames. Despite fluctuations, both funds have exhibited a commendable increase in investment value over time.
Parag Parikh Flexi Cap Fund demonstrates a higher lumpsum investment value across all periods than the HDFC Flexi Cap Fund. For instance, over ten years, a lumpsum investment of ₹1,00,000 in Parag Parikh Flexi Cap Fund would have grown to ₹66,734.4. In contrast, the same investment in HDFC Flexi Cap Fund would amount to ₹54,844.4.
Key Takeaways
- Investment Style: Parag Parikh Flexi Cap Fund and HDFC Flexi Cap Fund follow a growth-oriented investment style, focusing on capital appreciation over the long term.
- Returns Analysis: While HDFC Flexi Cap Fund exhibits marginally higher returns over shorter periods, Parag Parikh Flexi Cap Fund demonstrates resilience and consistency, particularly over longer investment horizons.
- Lumpsum Investment Value: Parag Parikh Flexi Cap Fund outperforms HDFC Flexi Cap Fund regarding lumpsum investment value across all periods, indicating robust growth potential and value creation.
SIP Returns Analysis
Period Invested for: Parag Parikh Flexi Cap Fund vs HDFC Flexi Cap Fund

| Period Invested for | Parag Parikh Flexi Cap Fund | HDFC Flexi Cap Fund |
| 1 Year | 43.96% | 48.01% |
| 2 Year | 32.28% | 35.37% |
| 3 Year | 24.68% | 29.35% |
| 5 Year | 26.62% | 27.83% |
| 10 Year | 20.95% | 19.01% |
The SIP returns analysis unveils the performance of both funds over various investment durations. Each percentage represents SIP investments’ compounded annual growth rate (CAGR) over the specified period.
Detailed Analysis: SIP Returns
- 1 Year: HDFC Flexi Cap Fund exhibits a slightly higher SIP return of 48.01% compared to Parag Parikh Flexi Cap Fund’s 43.96% over the year. This indicates that HDFC Flexi Cap Fund has generated marginally better returns for SIP investors in the short term.
- 2 Year: Similarly, over two years, HDFC Flexi Cap Fund maintains its lead with a SIP return of 35.37%, outperforming Parag Parikh Flexi Cap Fund’s 32.28%. Despite the shorter duration, HDFC Flexi Cap Fund demonstrates consistent growth, albeit with a marginal difference.
- 3 Year: As the investment horizon extends to three years, the disparity in SIP returns becomes more pronounced. HDFC Flexi Cap Fund yields a SIP return of 29.35%, surpassing Parag Parikh Flexi Cap Fund’s 24.68%. This emphasizes HDFC Flexi Cap Fund’s ability to deliver sustained growth over intermediate durations.
- 5 Year: Over five years, both funds exhibit resilient performance, with Parag Parikh Flexi Cap Fund recording a SIP return of 26.62% and HDFC Flexi Cap Fund not far behind at 27.83%. Despite fluctuations in the market, both funds have demonstrated commendable growth potential for SIP investors.
- 10 Year: In the long run, Parag Parikh Flexi Cap Fund showcases its stability, yielding a SIP return of 20.95% over a decade. HDFC Flexi Cap Fund follows closely with a SIP return of 19.01%. While the difference may seem modest, it underscores Parag Parikh Flexi Cap Fund’s consistency and resilience over extended investment periods.
SIP Investment Value
Period Invested for: Investments in Parag Parikh Flexi Cap Fund vs HDFC Flexi Cap Fund
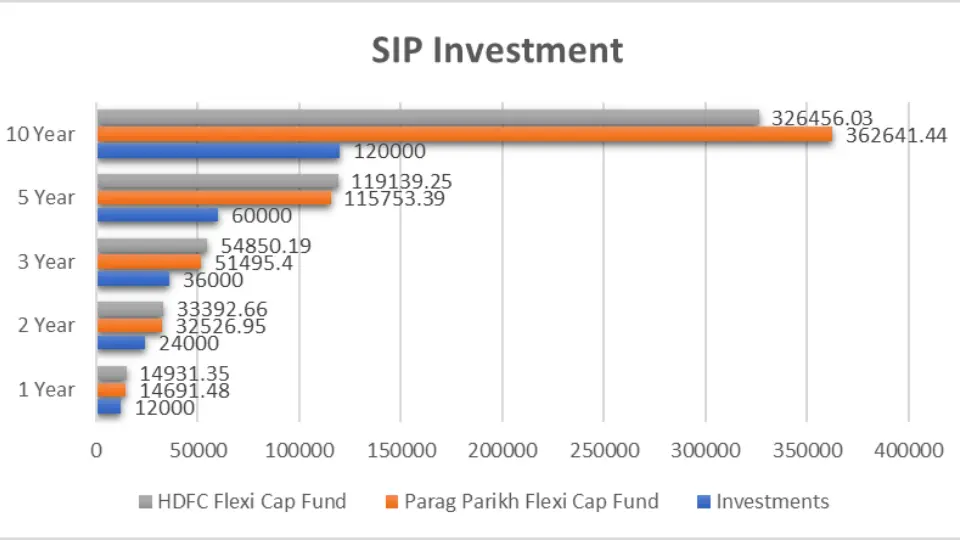
| Period Invested for | Investments | Parag Parikh Flexi Cap Fund | HDFC Flexi Cap Fund |
| 1 Year | ₹12,000 | ₹14,691.48 | ₹14,931.35 |
| 2 Year | ₹24,000 | ₹32,526.95 | ₹33,392.66 |
| 3 Year | ₹36,000 | ₹51,495.4 | ₹54,850.19 |
| 5 Year | ₹60,000 | ₹1,15,753.39 | ₹1,19,139.25 |
| 10 Year | ₹1,20,000 | ₹3,62,641.44 | ₹3,26,456.03 |
The SIP investment value analysis provides a glimpse into the growth trajectory of SIP investments made in both funds over various time frames.
Key Takeaways
- Short-term Performance: HDFC Flexi Cap Fund exhibits marginally higher SIP returns over one and two-year periods, indicating its potential for generating quick gains in the short term.
- Medium-term Consistency: Over three and five-year periods, both funds demonstrate resilience and consistency in delivering SIP returns, with Parag Parikh Flexi Cap Fund showcasing a slight edge in some instances.
- Long-term Stability: Parag Parikh Flexi Cap Fund emerges as a stable performer over a decade-long investment horizon, reaffirming its suitability for long-term wealth accumulation through SIPs.
CAGR Analysis
CAGR, or Compound Annual Growth Rate, offers a bird’s eye view of a fund’s growth trajectory over multiple periods. Let’s analyze the CAGR of both funds across various investment durations.

| Category | 1 Y | 3 Y | 5 Y | 9 Y |
| Parag Parikh Flexi Cap Fund | 42.95% | 24.02% | 24.52% | 18.38% |
| HDFC Flexi Cap Fund | 41.93% | 25.32% | 21.28% | 15.04% |
Detailed Analysis: CAGR
- 1 Year: Parag Parikh Flexi Cap Fund and HDFC Flexi Cap Fund both boast impressive CAGR figures over the one year, with Parag Parikh Flexi Cap Fund marginally edging ahead at 42.95% compared to HDFC Flexi Cap Fund’s 41.93%.
- 3 Year: Over three years, Parag Parikh Flexi Cap Fund maintains its lead, delivering a CAGR of 24.02%, slightly outperforming HDFC Flexi Cap Fund’s 25.32%.
- 5 Year: The trend persists over five years, with Parag Parikh Flexi Cap Fund showcasing a CAGR of 24.52% compared to HDFC Flexi Cap Fund’s 21.28%. This underscores Parag Parikh Flexi Cap Fund’s consistent growth potential over intermediate durations.
- 9 Year: Even over a longer investment horizon of nine years, Parag Parikh Flexi Cap Fund exhibits resilience, yielding a CAGR of 18.38%, outpacing HDFC Flexi Cap Fund’s 15.04%. This highlights the sustained performance of the Parag Parikh Flexi Cap Fund over extended periods.
Rolling Returns Analysis
Rolling Returns provide insights into a fund’s performance by calculating the annualized returns for multiple periods rolling over different lengths of time.

| Category | 1 Y | 3 Y | 5 Y | 9 Y |
| Parag Parikh Flexi Cap Fund | 21.60% | 19.46% | 17.79% | 18.67% |
| HDFC Flexi Cap Fund | 19.06% | 15.87% | 13.79% | 15.93% |
Detailed Analysis: Rolling Returns
- 1 Year: Parag Parikh Flexi Cap Fund maintains an edge over HDFC Flexi Cap Fund with rolling returns of 21.60% compared to 19.06% over the one year.
- 3 Year: Parag Parikh Flexi Cap Fund continues to exhibit superior rolling returns over three years, with 19.46% compared to HDFC Flexi Cap Fund’s 15.87%.
- 5 Year: The trend persists over five years, with Parag Parikh Flexi Cap Fund delivering rolling returns of 17.79% compared to HDFC Flexi Cap Fund’s 13.79%.
- 9 Year: Even over nine years, Parag Parikh Flexi Cap Fund outshines HDFC Flexi Cap Fund with rolling returns of 18.67% versus 15.93%, reaffirming its consistency and stability.
Annualized/Calendar Year Returns Analysis
Now, let’s delve into both funds’ annualized or calendar year returns, providing insights into their performance across specific years.
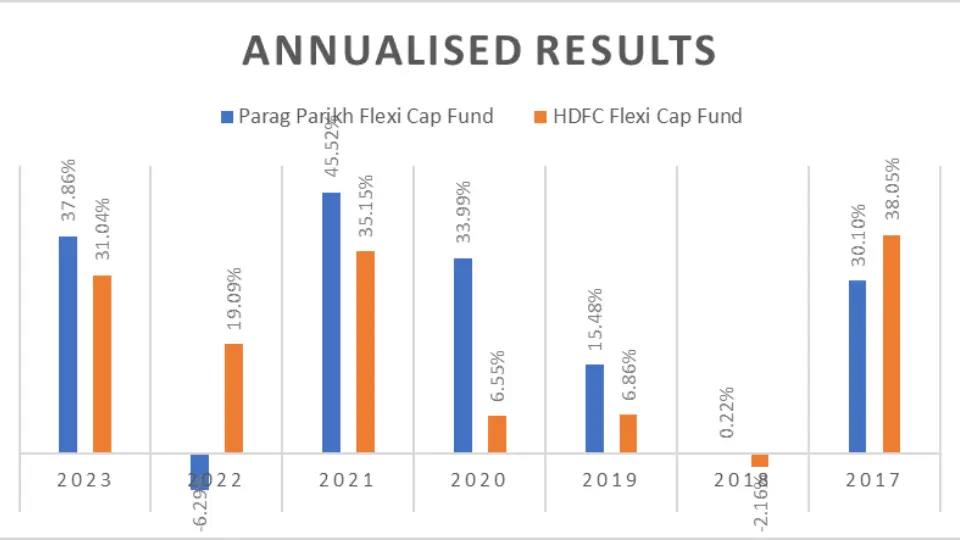
| Period | Parag Parikh Flexi Cap Fund | HDFC Flexi Cap Fund |
| 2023 | 37.86% | 31.04% |
| 2022 | -6.29% | 19.09% |
| 2021 | 45.52% | 35.15% |
| 2020 | 33.99% | 6.55% |
| 2019 | 15.48% | 6.86% |
| 2018 | 0.22% | -2.16% |
| 2017 | 30.10% | 38.05% |
Detailed Analysis: Annualized/Calendar Year Returns
- 2023: Parag Parikh Flexi Cap Fund delivers robust returns of 37.86% in 2023, surpassing HDFC Flexi Cap Fund’s returns of 31.04%.
- 2022: However, in 2022, Parag Parikh Flexi Cap Fund faced a slight setback with negative returns of -6.29%, while HDFC Flexi Cap Fund remained positive at 19.09%.
- 2021: Parag Parikh Flexi Cap Fund bounces back vigorously in 2021 with returns of 45.52%, outpacing HDFC Flexi Cap Fund’s returns of 35.15%.
- 2018: Both funds faced challenges in 2018, with Parag Parikh Flexi Cap Fund delivering marginal returns of 0.22% compared to HDFC Flexi Cap Fund’s -2.16%.
Key Takeaways
- Consistency and Resilience: Parag Parikh Flexi Cap Fund demonstrates consistency and resilience across various time frames, outperforming HDFC Flexi Cap Fund regarding CAGR and rolling returns.
- Short-term Volatility: While both funds exhibit volatility in specific years, Parag Parikh Flexi Cap Fund’s performance tends to rebound strongly, showcasing its ability to navigate market fluctuations.
- Long-term Outperformance: Parag Parikh Flexi Cap Fund emerges as a strong contender for long-term investors, consistently outperforming HDFC Flexi Cap Fund over extended investment horizons.
Quarterly Results Analysis
Quarterly results provide a granular view of a mutual fund’s performance, reflecting its ability to navigate market conditions and deliver returns to investors. Let’s analyze the quarterly NAV movements of both funds over multiple quarters.

| Period | Parag Parikh Flexi Cap Fund | HDFC Flexi Cap Fund |
| Q4 – 2023 | 11.78% | 12.98% |
| Q3 – 2023 | 5.38% | 6.61% |
| Q2 – 2023 | 12.41% | 12.03% |
| Q1 – 2023 | 3.95% | -2.58% |
| Q4 – 2022 | 2.29% | 8.34% |
| Q3 – 2022 | 6.59% | 11.41% |
| Q2 – 2022 | -11.41% | -6.82% |
| Q1 – 2022 | -3.57% | 3.91% |
| Q4 – 2021 | 4.75% | -0.31% |
| Q3 – 2021 | 15.31% | 11.12% |
| Q2 – 2021 | 12.23% | 9.65% |
| Q1 – 2021 | 7.60% | 10.88% |
| Q4 – 2020 | 12.35% | 26.67% |
| Q3 – 2020 | 16.88% | 3.40% |
| Q2 – 2020 | 29.08% | 21.12% |
| Q1 – 2020 | -21.38% | -32.13% |
| Q4 – 2019 | 5.77% | 6.30% |
| Q3 – 2019 | 0.35% | -7.54% |
| Q2 – 2019 | 1.44% | 2.51% |
| Q1 – 2019 | 6.58% | 7.61% |
| Q4 – 2018 | -3.82% | 1.63% |
| Q3 – 2018 | 2.46% | 3.94% |
| Q2 – 2018 | 6.83% | 0.24% |
| Q1 – 2018 | -4.49% | -8.73% |
| Q4 – 2017 | 6.76% | 13.22% |
| Q3 – 2017 | 6.86% | 1.47% |
| Q2 – 2017 | 5.58% | 5.17% |
| Q1 – 2017 | 8.01% | 14.25% |
| Q4 – 2016 | -0.78% | -4.12% |
| Q3 – 2016 | 5.78% | 7.98% |
Detailed Analysis: Quarterly Results
- Q4 – 2023: Both funds exhibit positive returns in the fourth quarter of 2023, with Parag Parikh Flexi Cap Fund at 11.78% and HDFC Flexi Cap Fund at 12.98%.
- Q2 – 2022: However, in the second quarter of 2022, both funds faced negative returns, with Parag Parikh Flexi Cap Fund at -11.41% and HDFC Flexi Cap Fund at -6.82%.
- Q1 – 2020: The first quarter of 2020 witnessed significant market turmoil, with both funds experiencing steep declines. Parag Parikh Flexi Cap Fund decreased by -21.38%, while HDFC Flexi Cap Fund fell by -32.13%.
- Q4 – 2017: In contrast, the fourth quarter of 2017 saw robust performance from both funds, with Parag Parikh Flexi Cap Fund at 6.76% and HDFC Flexi Cap Fund at 13.22%.
Key Takeaways
- Performance Volatility: Both funds exhibit volatility in their quarterly returns, influenced by various market factors and economic conditions.
- Consistency and Resilience: Despite periodic fluctuations, both Parag Parikh Flexi Cap Fund and HDFC Flexi Cap Fund demonstrate resilience and the ability to recover from downturns.
- Outperformance Analysis: Parag Parikh Flexi Cap Fund outperforms HDFC Flexi Cap Fund in 14 quarters out of 30 analyzed, showcasing its competitive edge in certain market conditions.
Best Quarters
Discover the quarters where both funds performed exceptionally well, showcasing their ability to capitalize on market opportunities and deliver impressive returns to investors.

| Period | Parag Parikh Flexi Cap Fund | HDFC Flexi Cap Fund |
| Q2 – 2020 | 29.08% | 21.12% |
Detailed Analysis: Best Quarters
Q2 – 2020: Parag Parikh Flexi Cap Fund and HDFC Flexi Cap Fund exhibited stellar performance. Parag Parikh Flexi Cap Fund surged by an impressive 29.08%, outpacing HDFC Flexi Cap Fund’s 21.12%. This period marked a notable uptrend in the market, and both funds capitalized on favourable market conditions to deliver exceptional returns to investors.
Worst Quarters
Explore the quarters where both funds faced significant challenges, navigating market downturns and experiencing declines in their NAVs.

| Period | Parag Parikh Flexi Cap Fund | HDFC Flexi Cap Fund |
| Q1 – 2018 | -4.49% | -8.73% |
| Q1 – 2020 | -21.38% | -32.13% |
Detailed Analysis: Worst Quarters
- Q1 – 2018: The first quarter of 2018 proved challenging for Parag Parikh Flexi Cap Fund and HDFC Flexi Cap Fund. Parag Parikh Flexi Cap Fund experienced a decline of -4.49%, while HDFC Flexi Cap Fund faced a sharper decline of -8.73%. Market volatility and uncertainties during this period contributed to the negative returns of both funds.
- Q1 – 2020: The first quarter of 2020 witnessed unprecedented market turmoil, exacerbated by the global COVID-19 pandemic. Both funds suffered significant losses, with Parag Parikh Flexi Cap Fund recording a decline of -21.38% and HDFC Flexi Cap Fund experiencing an even steeper decline of -32.13%. Economic uncertainties and investor panic led to a sharp downturn in the market, impacting the NAVs of mutual funds across the board.
Risk Analysis Metrics
Maximum Drawdown
Understand the maximum drawdowns of both funds over different time frames, providing insights into their performance during market downturns.
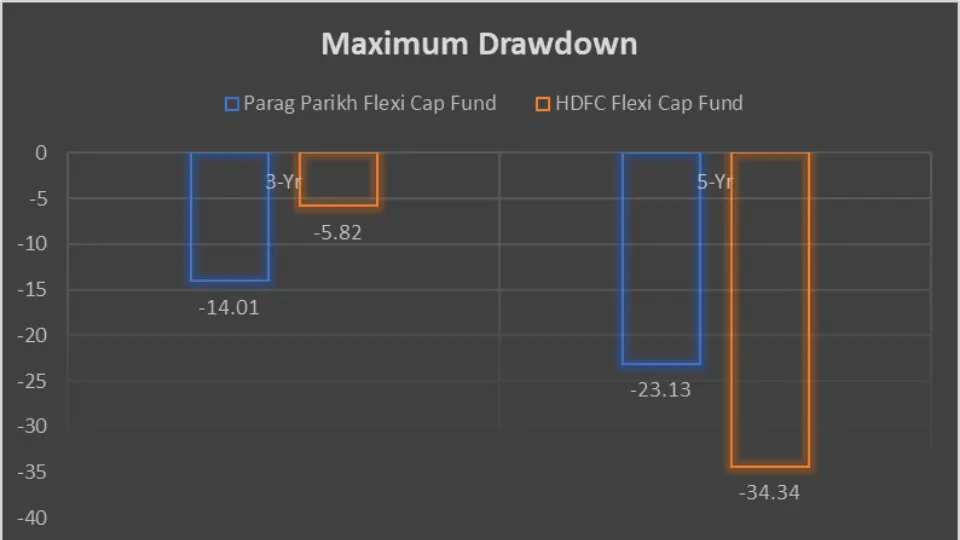
Detailed Analysis: Maximum Drawdown
- 3-Year Drawdown: Parag Parikh Flexi Cap Fund experienced a maximum drawdown of -14.01% over three years. HDFC Flexi Cap Fund’s drawdown was comparatively lower at -5.82%. This indicates that Parag Parikh Flexi Cap Fund faced relatively higher volatility and downside risk over the three years.
- 5-Year Drawdown: Parag Parikh Flexi Cap Fund’s maximum drawdown over five years stood at -23.13%, whereas HDFC Flexi Cap Fund exhibited a higher drawdown of -34.34%. Despite periodic downturns, both funds showcased resilience and the ability to recover from market setbacks.
Key Takeaways
- Performance Variability: Both funds demonstrate variability in their quarterly performance, with periods of exceptional growth and challenges.
- Market Sensitivity: The performance of mutual funds is closely linked to market conditions, with periods of economic uncertainty impacting NAV movements.
- Risk Management: Understanding maximum drawdowns provides valuable insights into a fund’s risk management strategies and its ability to mitigate downside risks during market downturns.
Mean Return, Sortino Ratio, Treynor’s Ratio, Standard Deviation, Sharpe Ratio, Beta, and Alpha
Explore key risk metrics, including Mean Return, Sortino Ratio, Treynor’s Ratio, Standard Deviation, Sharpe Ratio, Beta, and Alpha, to gauge funds’ risk and performance dynamics.
| Metric | Parag Parikh Flexi Cap Fund | HDFC Flexi Cap Fund |
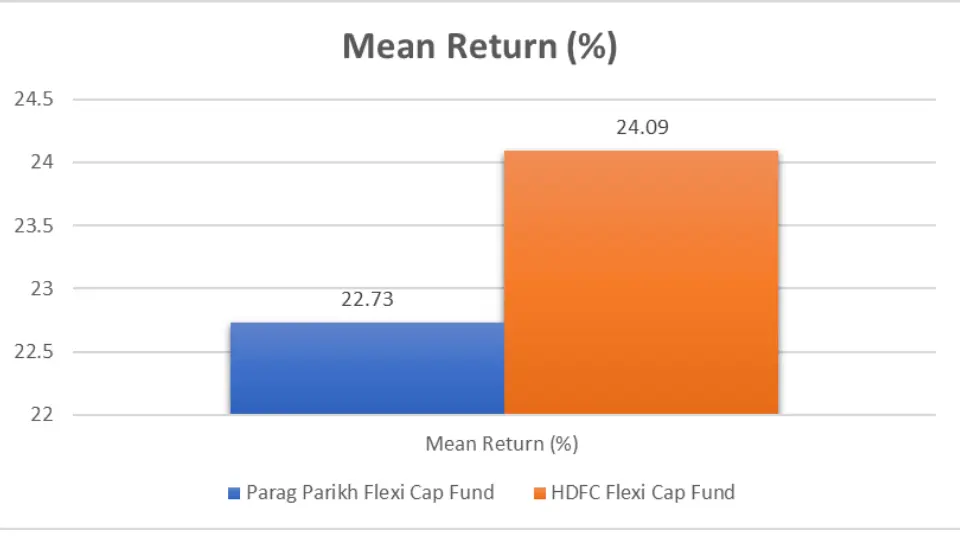
| Mean Return (%) | 22.73 | 24.09 |
| Sortino Ratio (%) | 2.2 | 2.6 |
| Treynor’s Ratio (%) | 0.21 | 0.18 |
| Standard Deviation (%) 3Y | 11.34 | 13.2 |
| Standard Deviation (%) 5Y | 15.88 | 20.91 |
| Standard Deviation (%) 10Y | 13.74 | 19.24 |
| Sharpe Ratio (%) 3Y | 1.55 | 1.44 |
| Sharpe Ratio (%) 5Y | 1.16 | 0.81 |
| Sharpe Ratio (%) 10Y | 1.02 | 0.69 |
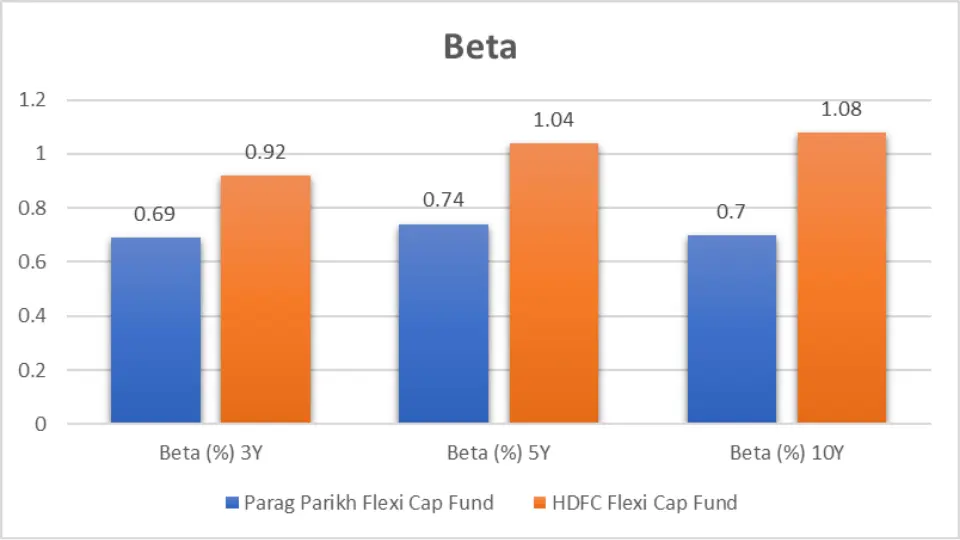
| Beta (%) 3Y | 0.69 | 0.92 |
| Beta (%) 5Y | 0.74 | 1.04 |
| Beta (%) 10Y | 0.7 | 1.08 |
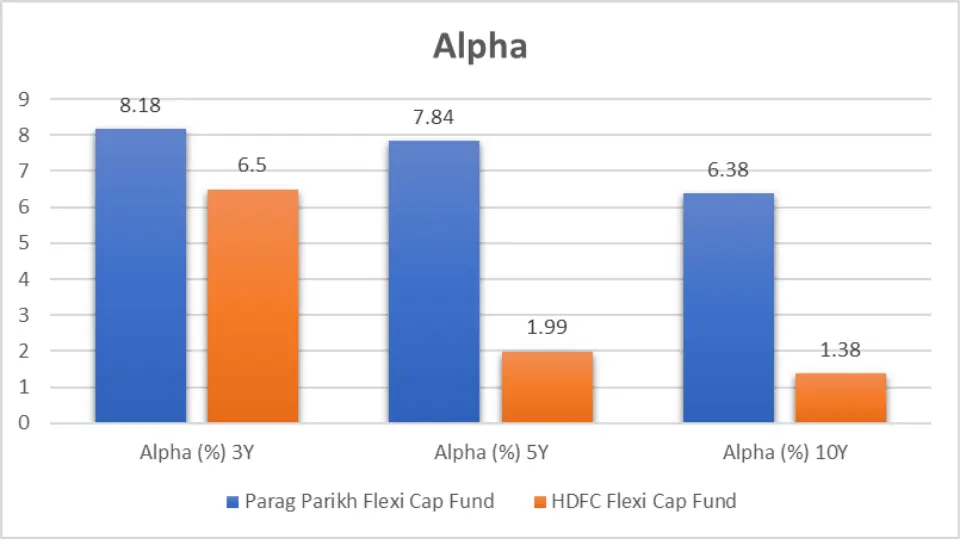
| Alpha (%) 3Y | 8.18 | 6.5 |
| Alpha (%) 5Y | 7.84 | 1.99 |
| Alpha (%) 10Y | 6.38 | 1.38 |
Detailed Analysis: Risk Metrics
- Mean Return: HDFC Flexi Cap Fund exhibits a slightly higher mean return of 24.09% compared to Parag Parikh Flexi Cap Fund’s 22.73%, indicating a marginally better performance in terms of average returns.
- Sortino Ratio: Both funds showcase strong Sortino Ratios, indicating their ability to generate positive returns while minimizing downside risk. HDFC Flexi Cap Fund boasts a higher Sortino Ratio of 2.6, suggesting superior risk-adjusted returns compared to Parag Parikh Flexi Cap Fund’s 2.2.
- Treynor’s Ratio: Parag Parikh Flexi Cap Fund outperforms HDFC Flexi Cap Fund in terms of Treynor’s Ratio, indicating better risk-adjusted returns per unit of systematic risk over time.

- Standard Deviation: HDFC Flexi Cap Fund exhibits higher standard deviations across all time frames (3 years, 5 years, and 10 years), indicating greater volatility than Parag Parikh Flexi Cap Fund.

- Sharpe Ratio: Parag Parikh Flexi Cap Fund demonstrates superior risk-adjusted returns with higher Sharpe Ratios across all time frames, signifying better returns per unit of risk than HDFC Flexi Cap Fund.

- Beta: Parag Parikh Flexi Cap Fund maintains lower beta values across all time frames, suggesting lower systematic risk and volatility than HDFC Flexi Cap Fund.
- Alpha: Parag Parikh Flexi Cap Fund outperforms HDFC Flexi Cap Fund in alpha, indicating its ability to create excess returns over the market benchmark, adjusted for risk.
Key Takeaways
- Risk-Adjusted Returns: While both funds offer competitive returns, investors should consider risk-adjusted metrics such as Sortino Ratio, Sharpe Ratio, and Treynor’s Ratio to assess their performance relative to the level of risk undertaken.
- Volatility Management: Parag Parikh Flexi Cap Fund demonstrates relatively lower volatility and systematic risk than HDFC Flexi Cap Fund, making it suitable for investors seeking stability and downside protection.
- Diversification Benefits: Understanding risk metrics can help investors diversify their portfolios effectively, balancing risk and return objectives to achieve long-term investment goals.
Star Ratings Comparison
| Ratings Source | Parag Parikh Flexi Cap Fund | HDFC Flexi Cap Fund |
|---|---|---|
| CRISIL Ratings (as on 31st Mar 2024) | ⭐⭐⭐☆☆ | ⭐⭐⭐⭐☆ |
| CRISIL Ratings (as on 31st Dec 2023) | NA | ⭐⭐⭐⭐☆ |
| CRISIL Ratings (as on 30th Sep 2023) | NA | ⭐⭐⭐⭐⭐ |
| CRISIL Ratings (as on 30th Jun 2023) | NA | ⭐⭐⭐⭐⭐ |
| CRISIL Ratings (as on 31st Mar 2023) | NA | ⭐⭐⭐⭐⭐ |
| Value Research Ratings | ⭐⭐⭐⭐⭐ | ⭐⭐⭐⭐☆ |
| Morning Star Ratings | ⭐⭐⭐⭐⭐ | ⭐⭐⭐⭐☆ |
| Economic Times Ratings | ⭐⭐⭐⭐⭐ | ⭐⭐⭐⭐☆ |
| Groww Ratings | ⭐⭐⭐⭐⭐ | ⭐⭐⭐⭐☆ |
| AngelOne AQR Ratings | ⭐⭐⭐½ | ⭐⭐⭐⭐☆ |
| 5Paisa Ratings | ⭐⭐⭐⭐⭐ | ⭐⭐⭐⭐☆ |
| KUVERA ratings | ⭐⭐⭐⭐⭐ | ⭐⭐⭐⭐☆ |
| Average Ratings | ⭐⭐⭐⭐☆ | ⭐⭐⭐⭐☆ |
Detailed Analysis: Ratings
- Crisil Rank Ratings: While Parag Parikh Flexi Cap Fund’s CRISIL rank ratings are unavailable, HDFC Flexi Cap Fund consistently holds a CRISIL rank 4, indicating above-average performance compared to its peers.
- Value Research Ratings: Parag Parikh Flexi Cap Fund receives a higher rating of 5 from Value Research, denoting excellent performance, whereas HDFC Flexi Cap Fund secures a rating of 4, reflecting slightly lower performance.
- Morning Star Ratings: Both funds boast respectable Morning Star ratings, with Parag Parikh Flexi Cap Fund and HDFC Flexi Cap Fund receiving ratings of 5 and 4, respectively.
Key Takeaways from Ratings Analysis:
- Consistency: HDFC Flexi Cap Fund demonstrates consistent performance, maintaining a CRISIL rank of 4 across various periods. However, specific ratings for the Parag Parikh Flexi Cap Fund from CRISIL are unavailable, making it challenging to assess its consistency.
- Performance Evaluation: While both funds receive favourable ratings from Value Research and Morning Star, Parag Parikh Flexi Cap Fund’s higher ratings suggest potentially superior performance compared to HDFC Flexi Cap Fund.
Portfolio Analysis
Portfolio Overlap
Dive into the portfolio composition of both funds to understand their investment strategies and sectoral allocations.
Portfolio Overlap Comparison
Explore the degree of overlap between the portfolios of Parag Parikh Flexi Cap Fund and HDFC Flexi Cap Fund.
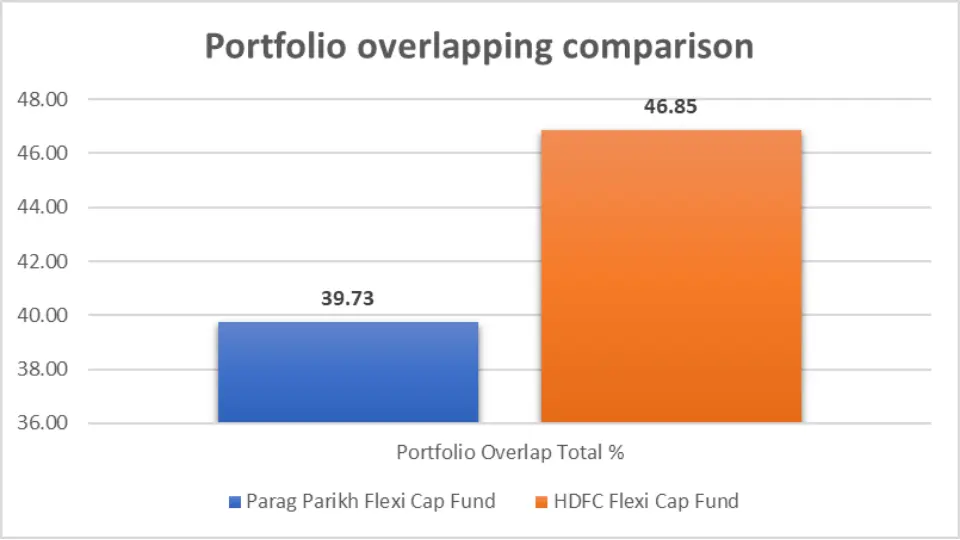
| Portfolio Overlap Total % | Parag Parikh Flexi Cap Fund | HDFC Flexi Cap Fund |
| Total % | 39.73 | 46.85 |
- Parag Parikh Flexi Cap Fund exhibits a portfolio overlap of 39.73% with HDFC Flexi Cap Fund, indicating a moderate level of similarity in their investment holdings.
Asset Allocation
Compare the allocation of assets across different categories within the portfolios of both funds.

| Portfolio Component | Parag Parikh Flexi Cap Fund | HDFC Flexi Cap Fund |
| Equity | 87.03% | 87.40% |
| Debt | 12.18% | 0.41% |
| Cash & Cash Eq. | 0.79% | 8.49% |
| Real Estate, Gold, Others | 0 | 3.70% |
Market Cap Allocation
Explore the distribution of investments across large-cap, mid-cap, and small-cap stocks within the portfolios.
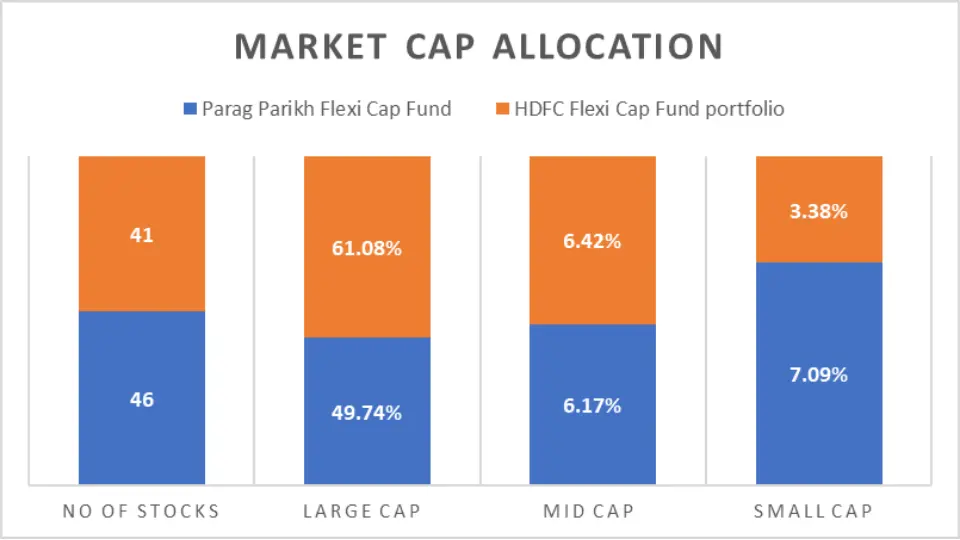
| Market Cap Allocation | Parag Parikh Flexi Cap Fund | HDFC Flexi Cap Fund |
| No of Stocks | 46 | 41 |
| Large Cap | 49.74% | 61.08% |
| Mid Cap | 6.17% | 6.42% |
| Small Cap | 7.09% | 3.38% |
Sector Allocation
Dive into the sectoral distribution of investments to understand the sectoral preferences of both funds.

| Sector Allocation | Parag Parikh Flexi Cap Fund | HDFC Flexi Cap Fund |
| Financial | 31% | 33.05% |
| Services | 14.20% | 1.29% |
| Technology | 11.59% | 9.02% |
| Automobile | 6.98% | 5.26% |
| Energy | 6.93% | 5.55% |
| Consumer Staples | 5.23% | 0.68% |
| Healthcare | 4% | 12.42% |
| Metals & Mining | 1.96% | 0.18% |
| Capital Goods | 0.01% | 7.37% |
| Materials | 5.14% | NA |
| Communication | NA | 4.60% |
| Insurance | NA | 4.38% |
| Construction | NA | 2.90% |
| Consumer Discretionary | NA | 0.70% |
Key Takeaways from Portfolio Analysis:
- Diversification: Both funds exhibit well-diversified portfolios with investments across equity, debt, cash equivalents, and other asset classes, providing investors with a balanced investment approach.
- Sectoral Allocation: Parag Parikh Flexi Cap Fund and HDFC Flexi Cap Fund display varying sectoral preferences, highlighting differences in their investment strategies and risk exposures.
Fund Management Comparison
Understanding the expertise and experience of fund managers is crucial for assessing the potential performance and consistency of mutual funds.

Detailed Analysis: Fund Managers
- Parag Parikh Flexi Cap Fund: The fund boasts a team of experienced fund managers, including Rajeev Thakkar, Raunak Onkar, and Raj Mehta, each with considerable tenure ranging from 98 to 130 months. This extensive experience signifies a deep understanding of market dynamics and investment strategies.
- HDFC Flexi Cap Fund: On the other hand, the HDFC Flexi Cap Fund is managed by Roshi Jain and Dhruv Muchhal, and it has relatively shorter tenures of 20 and 9 months, respectively. While these managers may bring fresh perspectives, the fund’s overall experience in terms of fund management tenure appears comparatively lower.
Key Takeaways from Fund Management Analysis:
- Experience Matters: Parag Parikh Flexi Cap Fund benefits from seasoned fund managers with significant tenure, instilling confidence in their ability to navigate various market conditions effectively.
- Fresh Perspectives vs. Experience: While HDFC Flexi Cap Fund managers may offer fresh insights, the relatively shorter tenure raises questions about their depth of experience in managing diverse market scenarios.
General Details Comparison
Let’s explore essential details such as Net Asset Value (NAV), Assets Under Management (AUM), Expense Ratio, Turnover, and Benchmark for both funds.

| General Details | Parag Parikh Flexi Cap Fund | HDFC Flexi Cap Fund |
| NAV (₹) | 74.64 | 1751.15 |
| AUM (in Cr.) | 58900 | 49656 |
| Expense Ratio (%) | 0.58 | 0.83 |
| Turnover | 33.90% | 34% |
| Benchmark | NIFTY 500 – TRI | NIFTY 500 – TRI |
General Details Analysis
- NAV (Net Asset Value): Parag Parikh Flexi Cap Fund has a relatively lower NAV of ₹74.64 compared to HDFC Flexi Cap Fund’s ₹1751.15. However, NAV alone does not determine a fund’s performance; it’s essential to consider other factors.
- AUM (Assets Under Management): Despite a lower NAV, Parag Parikh Flexi Cap Fund boasts a higher AUM of ₹58900 Cr., indicating substantial investor trust and confidence in the fund’s performance and management.
- Expense Ratio (%): Parag Parikh Flexi Cap Fund maintains a lower expense ratio of 0.58%, offering cost-effective investment opportunities to investors compared to HDFC Flexi Cap Fund’s 0.83%.
- Turnover: Both funds exhibit similar turnover rates, with Parag Parikh Flexi Cap Fund at 33.90% and HDFC Flexi Cap Fund at 34%, suggesting active management of investment portfolios.
- Benchmark: Both funds benchmark their performance against NIFTY 500 – TRI, a diversified index comprising 500 listed Indian companies across various sectors.
Key Takeaways from General Details Analysis:
- AUM and Investor Confidence: Despite the lower NAV, Parag Parikh Flexi Cap Fund’s higher AUM reflects strong investor trust, possibly driven by its consistent performance and lower expense ratio.
- Expense Ratio Consideration: Investors seeking cost-effective investment options may find Parag Parikh Flexi Cap Fund more appealing due to its lower expense ratio.
Minimum Investment Amount

| Minimum Investment Amount | Parag Parikh Flexi Cap Fund | HDFC Flexi Cap Fund |
| SIP | ₹ 1,000 | ₹ 100 |
| Lumpsum | ₹ 1,000 | ₹ 100 |
Detailed Analysis: Minimum Investment Amount
- SIP (Systematic Investment Plan): Both funds offer a convenient SIP investment option, with a minimum investment amount of ₹1,000 for Parag Parikh Flexi Cap Fund and ₹100 for HDFC Flexi Cap Fund, making them accessible to a wide range of investors.
- Lumpsum: The minimum lump sum investment amount for both funds is ₹1,000, providing flexibility and ease of investment.
Key Takeaways from Minimum Investment Analysis:
- Accessibility: Both funds cater to investors with varying investment capacities by offering low minimum investment amounts for SIP and lump sum modes.
- SIP Investment Flexibility: Parag Parikh Flexi Cap Fund and HDFC Flexi Cap Fund allow investors to start their investment journey with as little as ₹1,000 through SIPs, promoting disciplined and regular investing habits.
Conclusion
In conclusion, investors should wisely consider their time horizon, investment objectives, and risk tolerance when choosing between Parag Parikh Flexi Cap Fund and HDFC Flexi Cap Fund. By leveraging the insights in this comparative analysis, investors can make informed decisions to optimize their mutual fund portfolios and achieve their financial goals.
While both funds offer compelling opportunities, factors such as performance trends, risk metrics, ratings, and portfolio composition should be carefully evaluated. Ultimately, investors must align their investment choices with their financial objectives and risk preferences to build a robust and diversified investment portfolio.

We hope you found this guide on mutual funds helpful.
If you have any mutual fund-related queries, feel free to comment below—we’re here to help! S.K. Singh, a registered professional with the Association of Mutual Funds in India (AMFI), will answer your queries and holds the ARN-251149.
Invest wisely!
FAQs About Parag Parikh Flexi Cap Fund vs HDFC Flexi Cap Fund
1. What is the investment style of Parag Parikh Flexi Cap Fund and HDFC Flexi Cap Fund?
Parag Parikh Flexi Cap Fund and HDFC Flexi Cap Fund follow a growth-oriented investment style, focusing on capital appreciation over the long term. This approach aims to invest in companies with the potential for significant expansion, aligning with investors seeking wealth accumulation through capital gains.
2. How do the returns of Parag Parikh Flexi Cap Fund and HDFC Flexi Cap Fund compare?
The returns of both funds vary over different investment horizons. While HDFC Flexi Cap Fund may exhibit marginally higher returns over shorter periods, Parag Parikh Flexi Cap Fund demonstrates resilience and consistency, particularly over longer investment horizons.
3. Which fund performs better in SIP returns, the Parag Parikh Flexi Cap Fund or the HDFC Flexi Cap Fund?
The performance of both funds in SIP returns varies across different time frames. HDFC Flexi Cap Fund may show slightly higher SIP returns over shorter periods. In contrast, Parag Parikh Flexi Cap Fund tends to demonstrate stability and consistency over extended investment periods.
4. How do the risk metrics compare between Parag Parikh Flexi Cap Fund and HDFC Flexi Cap Fund?
Risk metrics such as Sortino Ratio, Treynor’s Ratio, Standard Deviation, Sharpe Ratio, Beta, and Alpha offer insights into funds’ risk and performance dynamics. While HDFC Flexi Cap Fund may have higher mean returns, Parag Parikh Flexi Cap Fund demonstrates better risk-adjusted returns and lower volatility.
5. What are the critical differences in the portfolio composition between Parag Parikh Flexi Cap Fund and HDFC Flexi Cap Fund?
The portfolio composition of both funds includes equity, debt, cash equivalents, and other asset classes. However, there are variations in sectoral allocations and market cap allocations. Parag Parikh Flexi Cap Fund and HDFC Flexi Cap Fund display differences in their investment strategies and sectoral preferences, providing investors with diversified options.
6. Who are the fund managers of Parag Parikh Flexi Cap Fund and HDFC Flexi Cap Fund, and how does their experience compare?
Parag Parikh Flexi Cap Fund is managed by experienced fund managers like Rajeev Thakkar, Raunak Onkar, and Raj Mehta, each with considerable tenure in fund management. On the other hand, the HDFC Flexi Cap Fund is managed by Roshi Jain and Dhruv Muchhal, and it has relatively shorter tenures.
7. What are the general details such as NAV, AUM, expense ratio, turnover, and benchmark of Parag Parikh Flexi Cap Fund and HDFC Flexi Cap Fund?
General details like NAV, AUM, expense ratio, turnover, and benchmark provide insights into both funds’ operational aspects and performance benchmarks. Parag Parikh Flexi Cap Fund may have a lower expense ratio and higher AUM than HDFC Flexi Cap Fund, among other differences
8. What minimum investment amount is required for SIP and lump sum investments in Parag Parikh Flexi Cap Fund and HDFC Flexi Cap Fund?
Both funds offer SIP and lump sum investment options with varying minimum investment amounts. Investors can begin with a minimum investment amount of ₹1,000 for SIP and a lump sum in Parag Parikh Flexi Cap Fund. In contrast, the HDFC Flexi Cap Fund allows a minimum SIP investment of ₹100.
Disclaimer:
The information provided in this article is solely the author/advertisers’ opinion and not investment advice – it is provided for educational purposes only. Using this, you agree that the information does not constitute any investment or financial instructions by Ace Equity Research/Mutual Fund Focus/IPO First and the team. Anyone wishing to invest should seek their own independent financial or professional advice. Conduct your research with registered financial advisors before making any investment decisions. Ace Equity Research/ Mutual Fund Focus / IPO First and the team are not accountable for the investment views provided in the article.
Mutual Fund investments are subject to market risks. Read all scheme-related documents carefully.
Investments in the securities market are subject to market risks. Read all the related documents carefully before investing.


