
If you plan to invest in Flexicap funds and seek clarity on Parag Parikh Flexi Cap Fund vs SBI Contra Fund, you’ve come to the right place. This blog post will delve into a detailed, data-driven comparison of these two mutual funds, focusing on critical parameters to help you make an informed decision for your long-term investment portfolio.
Investment Style
When it comes to investment styles, understanding each fund’s approach is crucial. Let’s look at the investment styles of SBI Contra Fund and Parag Parikh Flexi Cap Fund.
| Fund Name | Investment Style |
| SBI Contra Fund | Blend |
| Parag Parikh Flexi Cap Fund | Growth |

Returns Analysis
Returns are a critical factor in evaluating any mutual fund. Here, we’ll compare the trailing returns of these two funds over different periods to give you a clear picture of their Performance.
Trailing Returns
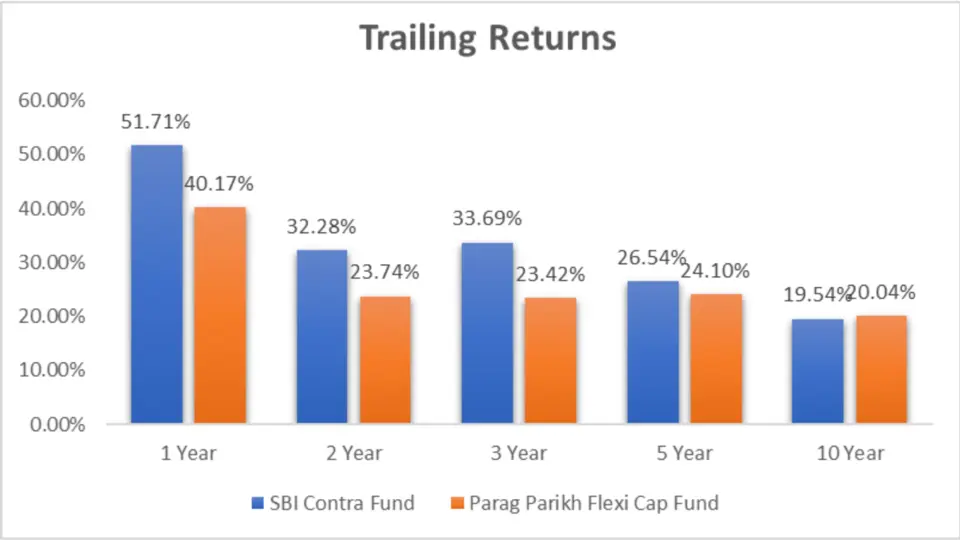
| Period Invested for | SBI Contra Fund | Parag Parikh Flexi Cap Fund |
| 1 Year | 51.71% | 40.17% |
| 2 Year | 32.28% | 23.74% |
| 3 Year | 33.69% | 23.42% |
| 5 Year | 26.54% | 24.10% |
| 10 Year | 19.54% | 20.04% |
Analysis
Let’s break down the returns to understand how each fund has performed over different time horizons.
1 Year Performance
In the short term, SBI Contra Fund has significantly outperformed Parag Parikh Flexi Cap Fund, with returns of 51.71% compared to 40.17%.
2 Year Performance
Over two years, SBI Contra Fund continues to lead with returns of 32.28%, while Parag Parikh Flexi Cap Fund lags behind at 23.74%.
3 Year Performance
The three-year returns show a similar pattern, with SBI Contra Fund achieving 33.69% compared to Parag Parikh Flexi Cap Fund’s 23.42%.
5 Year Performance
When we look at the five-year Performance, the gap narrows slightly, but SBI Contra Fund still holds an edge with 26.54% returns against Parag Parikh Flexi Cap Fund’s 24.10%.
10 Year Performance
Interestingly, over ten years, Parag Parikh Flexi Cap Fund marginally outperforms SBI Contra Fund with returns of 20.04% compared to 19.54%.
Key Takeaways
- Short-term Outperformance: SBI Contra Fund has shown strong short-term Performance, outperforming Parag Parikh Flexi Cap Fund in the 1, 2, and 3-year periods.
- Consistent Long-term Growth: Parag Parikh Flexi Cap Fund slightly outperforms SBI Contra Fund over a ten-year horizon, indicating more stable long-term growth.
- Investment Style Impact: The blend style of SBI Contra Fund may contribute to its more robust short-term Performance, while the growth style of Parag Parikh Flexi Cap Fund supports its consistent long-term returns.
Lumpsum Investment Value
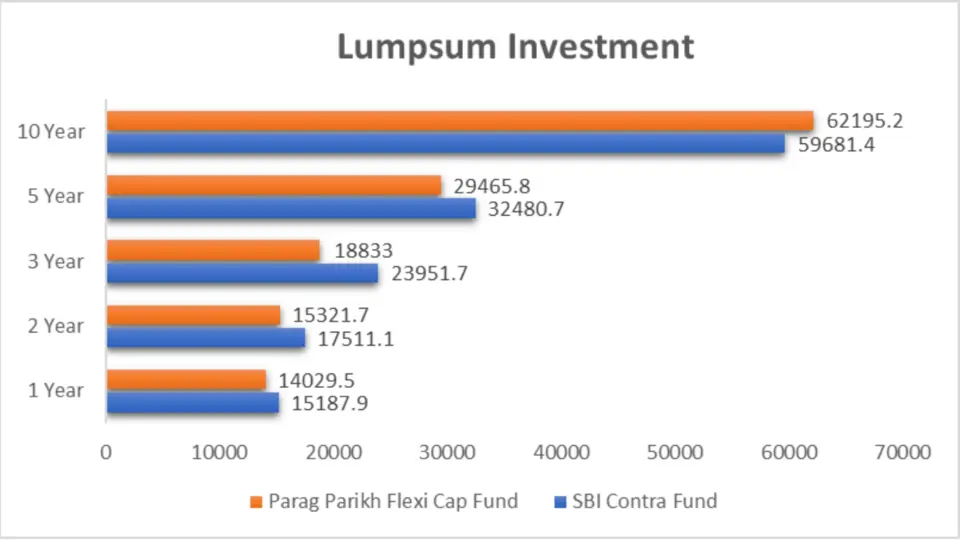
Understanding the lumpsum investment value helps investors gauge the fund’s Performance over different periods with a one-time investment.
| Period Invested for | SBI Contra Fund | Parag Parikh Flexi Cap Fund |
| 1 Year | ₹15,187.9 | ₹14,029.5 |
| 2 Year | ₹17,511.1 | ₹15,321.7 |
| 3 Year | ₹23,951.7 | ₹18,833.0 |
| 5 Year | ₹32,480.7 | ₹29,465.8 |
| 10 Year | ₹59,681.4 | ₹62,195.2 |
Analysis
1 Year Investment
A lump sum investment in SBI Contra Fund would have grown to ₹15,187.9, compared to ₹14,029.5 in Parag Parikh Flexi Cap Fund over one year.
2 Year Investment
Over two years, the Investment in the SBI Contra Fund would be ₹17,511.1, while in the Parag Parikh Flexi Cap Fund, it would be ₹15,321.7.
3 Year Investment
For three years, SBI Contra Fund’s investment value of ₹23,951.7 surpasses Parag Parikh Flexi Cap Fund’s ₹18,833.
5 Year Investment
The five-year investment value for the SBI Contra Fund stands at ₹32,480.7, compared to ₹29,465.8 for the Parag Parikh Flexi Cap Fund.
10 Year Investment
Interestingly, over a ten-year horizon, Parag Parikh Flexi Cap Fund outperforms with a value of ₹62,195.2 compared to SBI Contra Fund’s ₹59,681.4.
Key Takeaways
- Superior Short-term Performance: SBI Contra Fund consistently delivers higher returns in the 1, 2, and 3-year periods.
- Narrowing Gap in Long-term: The performance gap narrows over five years, indicating that both funds are long-term solid performers.
- Long-term Outperformance by Parag Parikh: Over ten years, Parag Parikh Flexi Cap Fund has taken the lead, making it a viable option for very long-term investments.
SIP Returns
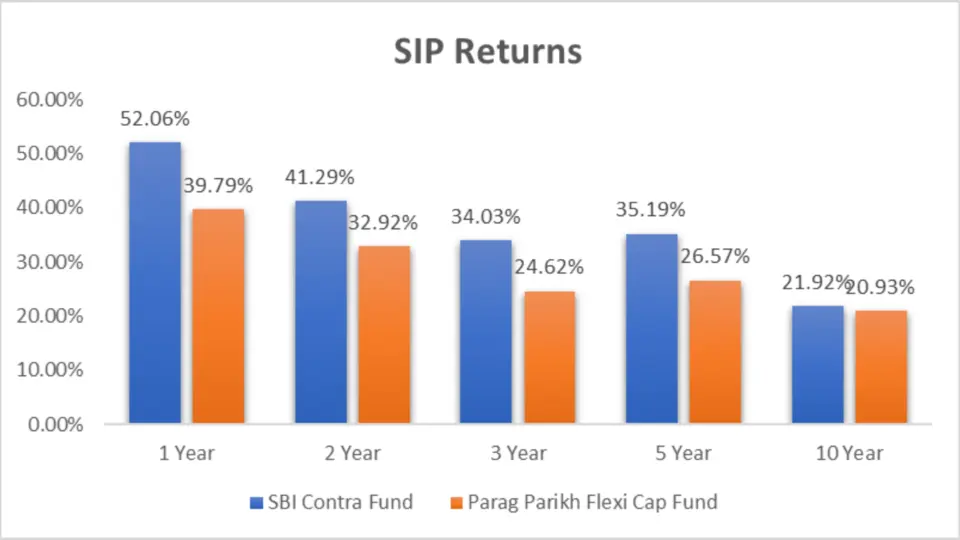
Systematic Investment Plans (SIPs) are a popular way to invest in mutual funds, offering regular contributions over time. Let’s compare the SIP returns for these funds.
| Period Invested for | SBI Contra Fund | Parag Parikh Flexi Cap Fund |
| 1 Year | 52.06% | 39.79% |
| 2 Year | 41.29% | 32.92% |
| 3 Year | 34.03% | 24.62% |
| 5 Year | 35.19% | 26.57% |
| 10 Year | 21.92% | 20.93% |
Analysis
1 Year SIP
For a one-year SIP, the SBI Contra Fund provides a return of 52.06%, significantly higher than the Parag Parikh Flexi Cap Fund’s 39.79%.
2 Year SIP
Over two years, SBI Contra Fund has delivered a 41.29% return compared to Parag Parikh Flexi Cap Fund’s 32.92%, showcasing its resilience and strategic investment choices.
3 Year SIP
The three-year SIP returns for the SBI Contra Fund are 34.03%, while the Parag Parikh Flexi Cap Fund offers 24.62%.
5 Year SIP
SBI Contra Fund yields 35.19% returns for a five-year SIP, surpassing Parag Parikh Flexi Cap Fund’s 26.57%.
10 Year SIP
Over a ten-year SIP period, SBI Contra Fund returns 21.92%, slightly higher than Parag Parikh Flexi Cap Fund’s 20.93%.
Key Takeaways
- Strong Recent Performance: SBI Contra Fund shows superior returns in the 1, 2, and 3-year SIP periods.
- Consistent Outperformance: SBI Contra Fund consistently outperforms Parag Parikh Flexi Cap Fund over various SIP periods.
- Long-term Viability: Both funds offer long-term solid returns, with SBI Contra Fund having a slight advantage.
SIP Investment Value
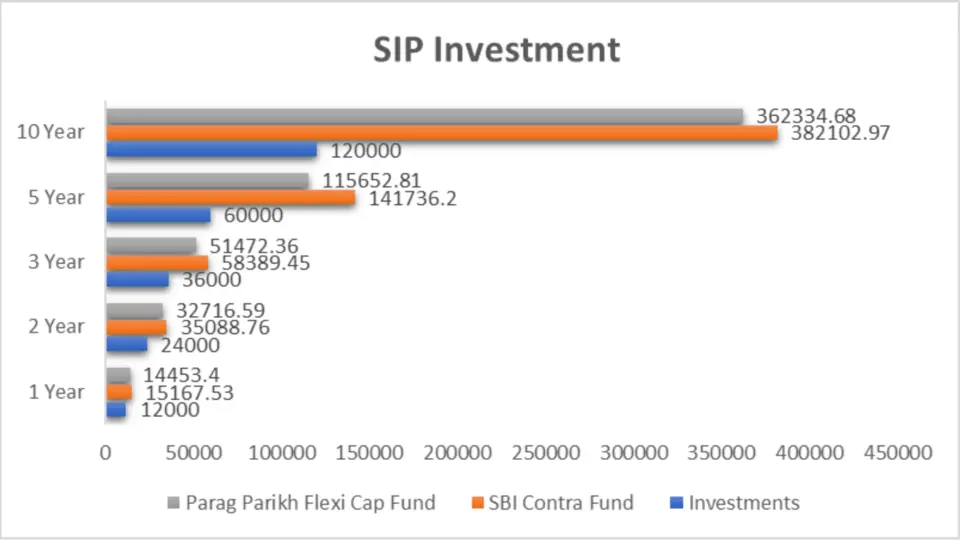
Understanding the SIP investment value helps investors gauge the fund’s Performance over different periods with regular investments.
| Period Invested for | Investments (₹) | SBI Contra Fund (₹) | Parag Parikh Flexi Cap Fund (₹) |
| 1 Year | 12,000 | 15,167.53 | 14,453.4 |
| 2 Year | 24,000 | 35,088.76 | 32,716.59 |
| 3 Year | 36,000 | 58,389.45 | 51,472.36 |
| 5 Year | 60,000 | 141,736.2 | 115,652.81 |
| 10 Year | 120,000 | 382,102.97 | 362,334.68 |
Analysis
1-Year SIP Investment
A one-year SIP in SBI Contra Fund would have grown to ₹15,167.53, compared to ₹14,453.4 in Parag Parikh Flexi Cap Fund.
2 Year SIP Investment
Over two years, the SIP investment in the SBI Contra Fund would be ₹35,088.76, while in the Parag Parikh Flexi Cap Fund, it would be ₹32,716.59.
3 Year SIP Investment
For three years, SBI Contra Fund’s SIP investment value of ₹58,389.45 surpasses Parag Parikh Flexi Cap Fund’s ₹51,472.36.
5 Year SIP Investment
The five-year SIP investment value for SBI Contra Fund stands at ₹141,736.2, compared to ₹115,652.81 for Parag Parikh Flexi Cap Fund.
10-Year SIP Investment
Interestingly, over a ten-year horizon, Parag Parikh Flexi Cap Fund outperforms with a value of ₹362,334.68 compared to SBI Contra Fund’s ₹382,102.97.
Key Takeaways
- Superior Short-term Performance: SBI Contra Fund consistently delivers higher returns in the 1, 2, and 3-year periods.
- Narrowing Gap in Long-term: The performance gap narrows over five years, indicating that both funds are long-term solid performers.
- Long-term Outperformance by Parag Parikh: Parag Parikh Flexi Cap Fund has taken the lead over ten years, making it a viable option for long-term investments.
Rolling Returns
Rolling returns provide a more dynamic view of a fund’s Performance over different periods. Let’s compare the SBI Contra Fund and the Parag Parikh Flexi Cap Fund.
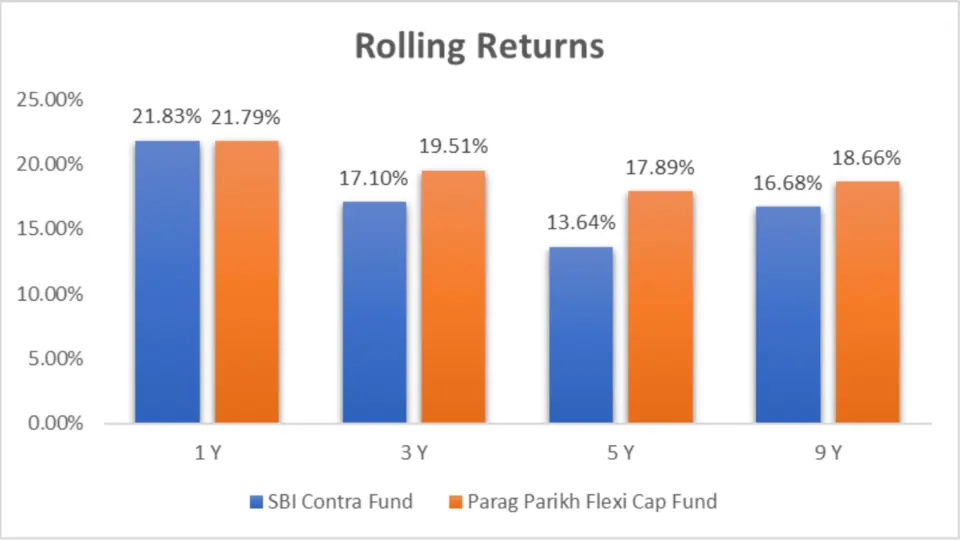
| Category | 1 Y | 3 Y | 5 Y | 9 Y |
| SBI Contra Fund | 21.83% | 17.10% | 13.64% | 16.68% |
| Parag Parikh Flexi Cap Fund | 21.79% | 19.51% | 17.89% | 18.66% |
Analysis
1-Year Rolling Returns
For the 1-year rolling returns, SBI Contra Fund slightly edges out Parag Parikh Flexi Cap Fund with 21.83% versus 21.79%.
3 Year Rolling Returns
In the 3-year rolling returns, Parag Parikh Flexi Cap Fund outperforms SBI Contra Fund with 19.51% compared to 17.10%.
5 Year Rolling Returns
For the 5-year rolling returns, Parag Parikh Flexi Cap Fund again outperforms 17.89%, while SBI Contra Fund trails at 13.64%.
9-Year Rolling Returns
Over 9 years, Parag Parikh Flexi Cap Fund outshines with 18.66% compared to SBI Contra Fund’s 16.68%.
Key Takeaways
- Slight Short-term Outperformance: SBI Contra Fund has a slight edge in 1-year rolling returns.
- Better Medium to Long-term Performance: Parag Parikh Flexi Cap Fund outperforms in the 3, 5, and 9-year rolling returns.
- Consistent Growth by Parag Parikh: Parag Parikh Flexi Cap Fund demonstrates consistent superior Performance over more extended periods.
Annualized/Calendar Year Returns
Examining the annualized or calendar year returns can provide insights into how the funds have performed in specific years.
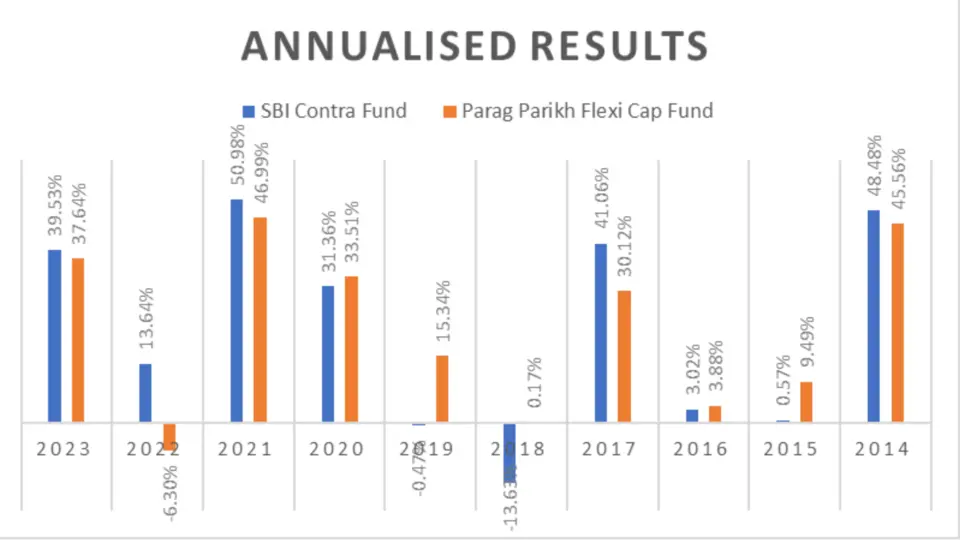
| Period | SBI Contra Fund | Parag Parikh Flexi Cap Fund |
| 2023 | 39.53% | 37.64% |
| 2022 | 13.64% | -6.30% |
| 2021 | 50.98% | 46.99% |
| 2020 | 31.36% | 33.51% |
| 2019 | -0.47% | 15.34% |
| 2018 | -13.63% | 0.17% |
| 2017 | 41.06% | 30.12% |
| 2016 | 3.02% | 3.88% |
| 2015 | 0.57% | 9.49% |
| 2014 | 48.48% | 45.56% |
Key Takeaways
- Recent Outperformance: SBI Contra Fund has shown strong Performance in recent years, particularly in 2022 and 2023.
- Resilience in Challenging Years: Parag Parikh Flexi Cap Fund has demonstrated resilience in years like 2018 and 2019.
- Overall Strong Performance: Both funds have had their share of solid years, with SBI Contra Fund showing more recent outperformance.
Best Quarters
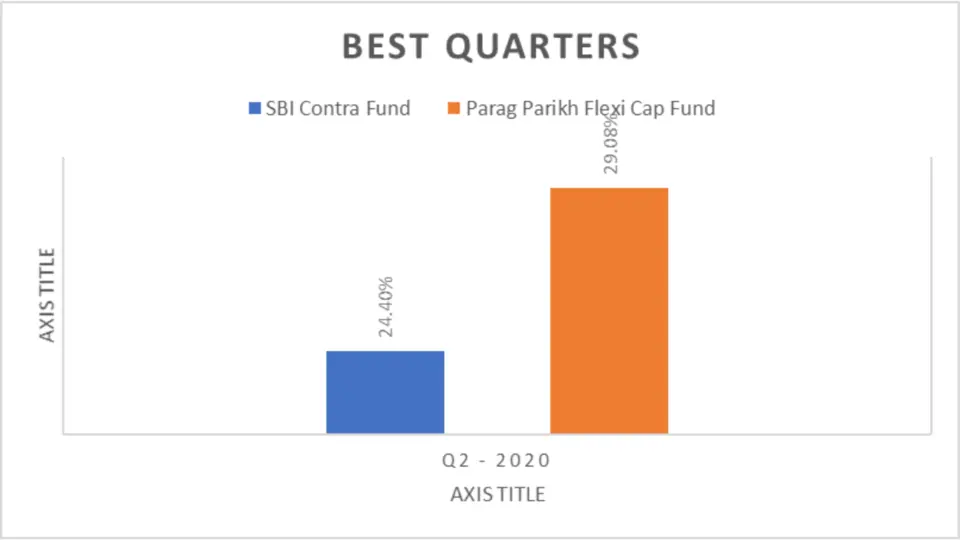
| Period | SBI Contra Fund | Parag Parikh Flexi Cap Fund |
| Q2 – 2020 | 24.40% | 29.08% |
Key Takeaways
- SBI Contra Fund delivered a strong return of 24.40% in Q2 2020, showcasing its resilience and strategic asset allocation during a challenging period. Investors looking for a fund that can perform well during market recoveries may find the SBI Contra Fund attractive.
Parag Parikh Flexi Cap Fund outperformed with a 29.08% return in the same quarter, reflecting its agility and effective stock selection in a rapidly recovering market. This Performance suggests that the fund is well-positioned to capitalize on market opportunities, making it a compelling choice for investors seeking higher returns during bullish phases
Worst Quarters
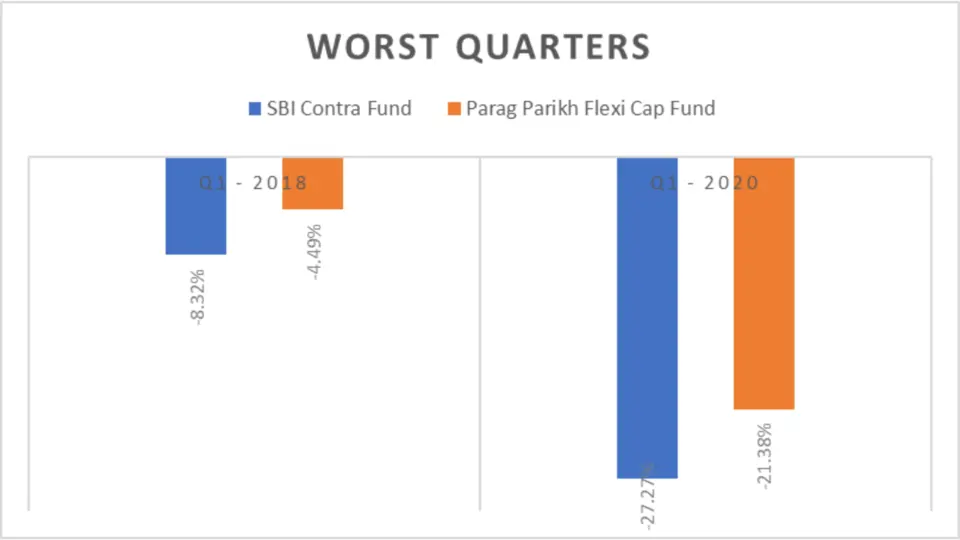
| Period | SBI Contra Fund | Parag Parikh Flexi Cap Fund |
| Q1 – 2018 | -8.32% | -4.49% |
| Q1 – 2020 | -27.27% | -21.38% |
Analysis
In Q1 of 2018, the SBI Contra Fund had a negative return of -8.32%, while the Parag Parikh Flexi Cap Fund had a lesser negative return of -4.49%. In Q1 of 2020, SBI Contra Fund experienced a significant drop of -27.27%, compared to Parag Parikh Flexi Cap Fund’s -21.38%. This shows that Parag Parikh Flexi Cap Fund has cushioned the impact better during market downturns.
Key Takeaways
- Capturing Market Upswings: Parag Parikh Flexi Cap Fund has shown a better ability to capture market upswings, as seen in Q2 of 2020.
- Cushioning Market Downturns: Parag Parikh Flexi Cap Fund has managed to cushion the impact better during market downturns, as seen in Q1 of 2018 and 2020
Quarterly Results
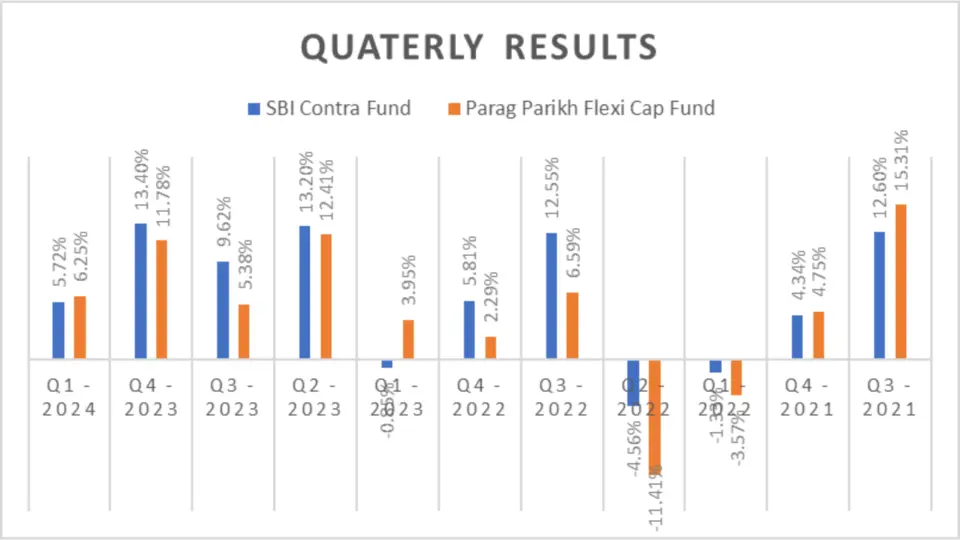
Quarterly results provide insights into the short-term Performance and volatility of the funds.
| Period | SBI Contra Fund | Parag Parikh Flexi Cap Fund |
| Q1 – 2024 | 5.72% | 6.25% |
| Q4 – 2023 | 13.40% | 11.78% |
| Q3 – 2023 | 9.62% | 5.38% |
| Q2 – 2023 | 13.20% | 12.41% |
| Q1 – 2023 | -0.85% | 3.95% |
| Q4 – 2022 | 5.81% | 2.29% |
| Q3 – 2022 | 12.55% | 6.59% |
| Q2 – 2022 | -4.56% | -11.41% |
| Q1 – 2022 | -1.33% | -3.57% |
| Q4 – 2021 | 4.34% | 4.75% |
| Q3 – 2021 | 12.60% | 15.31% |
Key Takeaways
- Recent Performance: Parag Parikh Flexi Cap Fund has shown strong Performance in the most recent quarter (Q1 2024).
- Short-term Volatility: Both funds have experienced periods of solid Performance and declines, indicating short-term volatility.
- Overall Outperformance: SBI Contra Fund outperformed Parag Parikh Flexi Cap Fund in more quarters (7 vs. 4).


Risk Analysis
Maximum Drawdown
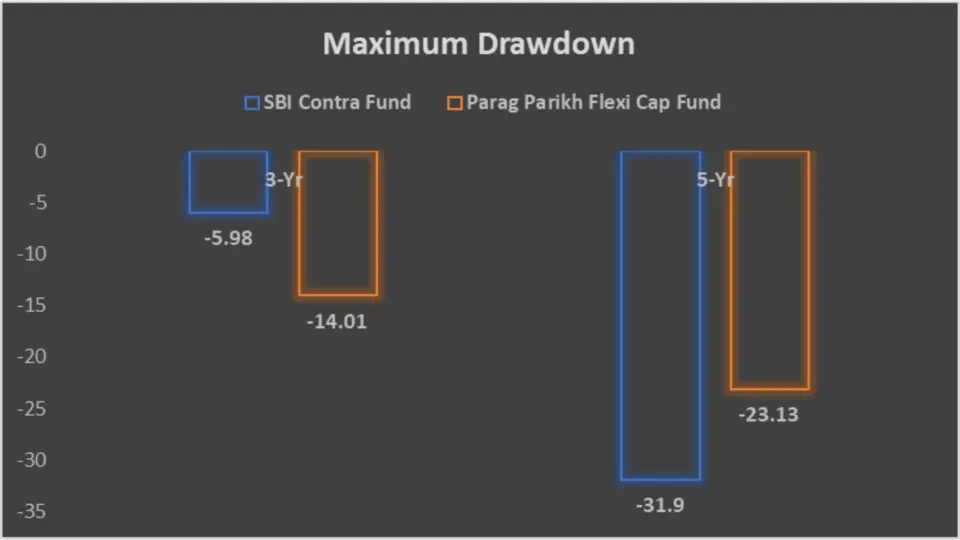
Understanding the maximum drawdown helps investors gauge the risk of significant declines in a fund’s value over time.
| Category | 3-Yr | 5-Yr |
| SBI Contra Fund | -5.98 | -31.9 |
| Parag Parikh Flexi Cap Fund | -14.01 | -23.13 |
Analysis
3-Year Maximum Drawdown
Over the past three years, SBI Contra Fund had a maximum drawdown of -5.98%, compared to Parag Parikh Flexi Cap Fund’s -14.01%.
5-Year Maximum Drawdown
For the five years, SBI Contra Fund had a more significant maximum drawdown of -31.9%, while Parag Parikh Flexi Cap Fund’s drawdown was -23.13%.
Key Takeaways
- Lower Short-term Risk: SBI Contra Fund has experienced less severe declines over the past three years.
- Better Long-term Resilience: Parag Parikh Flexi Cap Fund shows better resilience over the five years.
Sharpe Ratio
The excess returns generated against risk taken by a mutual fund are calculated by the Sharpe Ratio.
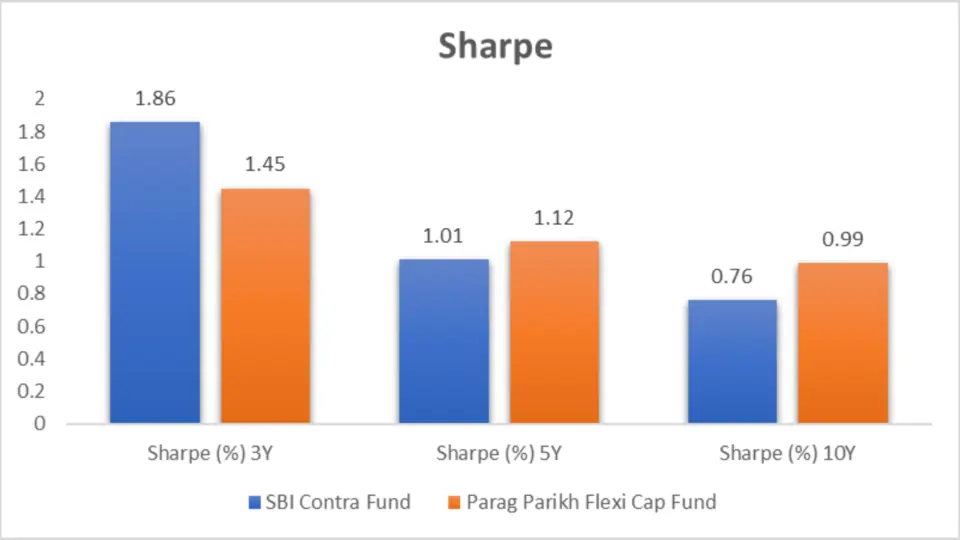
| Category | Sharpe (%) 3Y | Sharpe (%) 5Y | Sharpe (%) 10Y |
| SBI Contra Fund | 1.86 | 1.01 | 0.76 |
| Parag Parikh Flexi Cap Fund | 1.45 | 1.12 | 0.99 |
Analysis
SBI Contra Fund has a higher Sharpe Ratio over the 3 years (1.86) than Parag Parikh Flexi Cap Fund (1.45).
However, over 10 years, Parag Parikh Flexi Cap Fund (0.99) outperforms SBI Contra Fund (0.76), indicating better risk-adjusted returns in the long term for Parag Parikh Flexi Cap Fund.
Beta
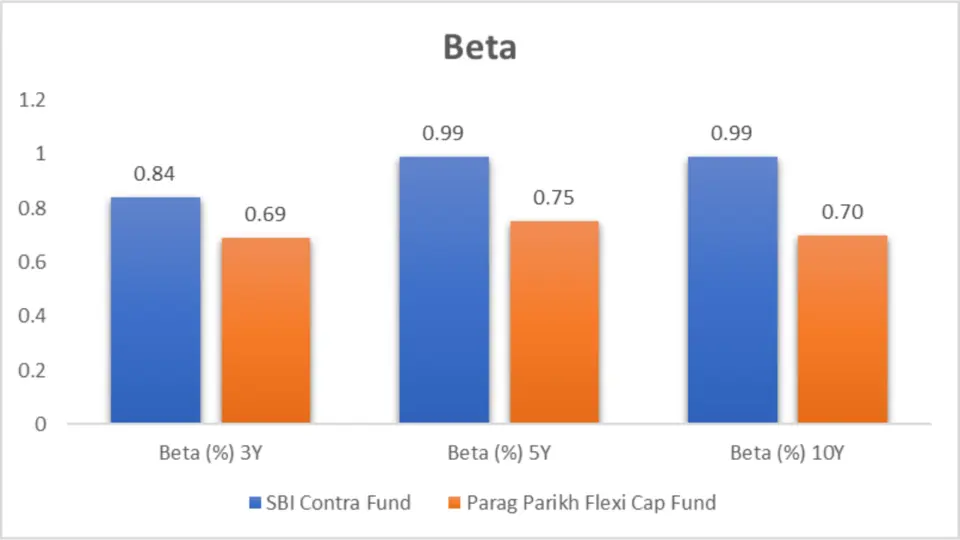
| Fund Name | Beta (%) 3Y | Beta (%) 5Y | Beta (%) 10Y |
| SBI Contra Fund | 0.84 | 0.99 | 0.99 |
| Parag Parikh Flexi Cap Fund | 0.69 | 0.75 | 0.70 |
Key Takeaways
- Parag Parikh Flexi Cap Fund consistently shows lower Beta values across all periods—3Y, 5Y, and 10Y—making it the go-to choice for investors who prefer a more conservative approach. Its low volatility means it’s less likely to experience wild swings in Performance, which can be reassuring in volatile markets.
- SBI Contra Fund, on the other hand, has a Beta that increases over time, reaching 0.99 in the 5-year and 10-year periods. This means the fund’s Performance is closely tied to market movements, making it more suitable for investors who are comfortable with market-like volatility.
Alpha
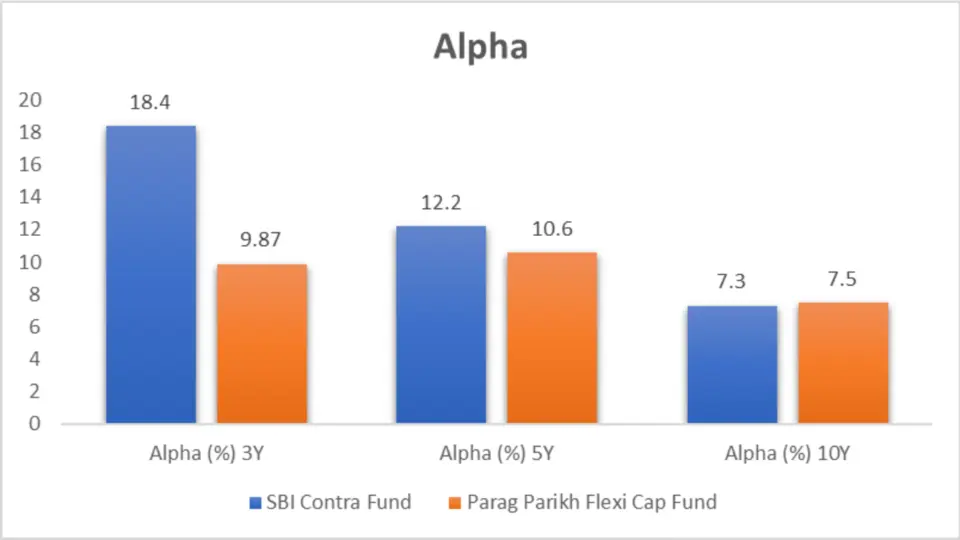
Alpha measures the active return of a fund relative to a benchmark index (NIFTY 100).
| Fund Name | Alpha (%) 3Y | Alpha (%) 5Y | Alpha (%) 10Y |
| SBI Contra Fund | 18.4 | 12.2 | 7.3 |
| Parag Parikh Flexi Cap Fund | 9.87 | 10.6 | 7.5 |
Key Takeaways
- SBI Contra Fund dominates in the short term with a high 3-year Alpha of 18.4%. This fund has demonstrated exceptional Performance in recent years, making it a potentially attractive option for investors looking for aggressive, short-term gains.
- Parag Parikh Flexi Cap Fund, while not as aggressive in the short term, shows a more consistent performance across periods. Its 10-year Alpha of 7.5% slightly surpasses that of SBI Contra Fund, making it a strong contender for long-term investors who value steady, market-beating returns.
Standard Deviation
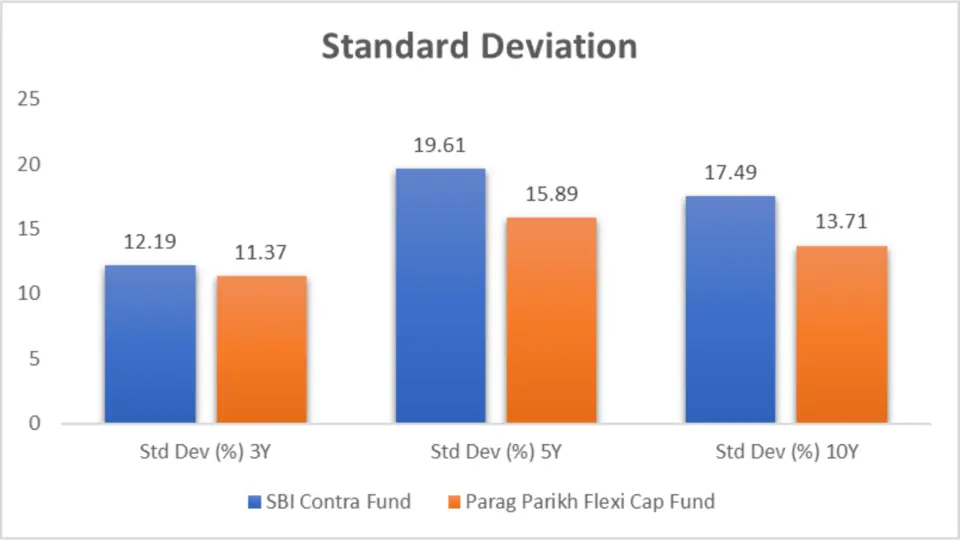
Now, let’s look at how the SBI Contra Fund and Parag Parikh Flexi Cap Fund stack up in standard Deviation across different periods.
| Fund Name | Std Dev (%) 3Y | Std Dev (%) 5Y | Std Dev (%) 10Y |
| SBI Contra Fund | 12.19 | 19.61 | 17.49 |
| Parag Parikh Flexi Cap Fund | 11.37 | 15.89 | 13.71 |
Key Takeaways
- Parag Parikh Flexi Cap Fund consistently demonstrates lower volatility across all periods analyzed—3Y, 5Y, and 10Y. This makes it attractive for risk-averse investors who prefer a smoother ride with fewer surprises. The lower standard Deviation across the board suggests that the fund has managed to shield its returns from excessive market turbulence.
- SBI Contra Fund, on the other hand, shows a higher standard deviation across all periods, indicating greater volatility. While this might lead to potentially higher returns during bullish phases, it also means more risk during downturns. This fund might appeal more to aggressive investors who are prepared to take higher risks for the possibility of higher returns.
Ratings
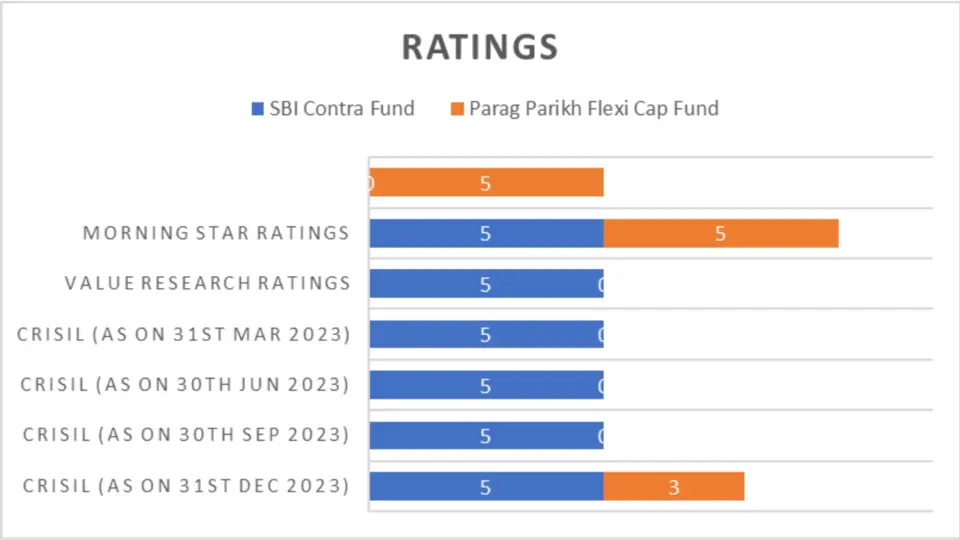
| Rating Agency | Rating Period | SBI Contra Fund | Parag Parikh Flexi Cap Fund |
| CRISIL Rank Ratings | As on 31st Mar 2024 | 5 | 3 |
| As on 31st Dec 2023 | 5 | NA | |
| As on 30th Sep 2023 | 5 | NA | |
| As on 30th Jun 2023 | 5 | NA | |
| As on 31st Mar 2023 | 5 | NA | |
| Value Research Ratings | Latest | 5 | 5 |
| Morningstar Ratings | Latest | NA | 5 |
Key Takeaways
- SBI Contra Fund consistently shines with a CRISIL Rank of 5 across all periods where ratings are available. This indicates that the fund has maintained top Performance within its category over the past year. The 5-star rating from Value Research further solidifies its position as a leading fund.
- Parag Parikh Flexi Cap Fund has strong ratings from Value Research and Morningstar, both awarding it 5 stars. However, its lower CRISIL Rank of 3 in the most recent period suggests that it might not perform as well as SBI Contra Fund in terms of risk-adjusted returns over the past year.
Portfolio Analysis
Portfolio Overlap

Let’s compare the portfolio overlap between SBI Contra Fund and Parag Parikh Flexi Cap Fund, expressed as a percentage of total holdings.
| Fund Name | Portfolio Overlap Total % |
| SBI Contra Fund | 21.01% |
| Parag Parikh Flexi Cap Fund | 40.04% |
Key Takeaways
Balanced Approach: Investors who are considering both funds should be aware of the overlap. If you decide to hold both, consider other funds or assets that can diversify your portfolio to balance the concentration risk.
Diversification Strategy: If your goal is to maximize diversification, the lower portfolio overlap in SBI Contra Fund makes it a better choice for pairing with other funds, as it is more likely to introduce unique assets into your portfolio.
Concentrated Exposure: The higher overlap in the Parag Parikh Flexi Cap Fund suggests that it may be investing heavily in particular sectors or companies. If you already have exposure to these sectors through other investments, adding this fund could increase your concentration risk.
Portfolio Composition
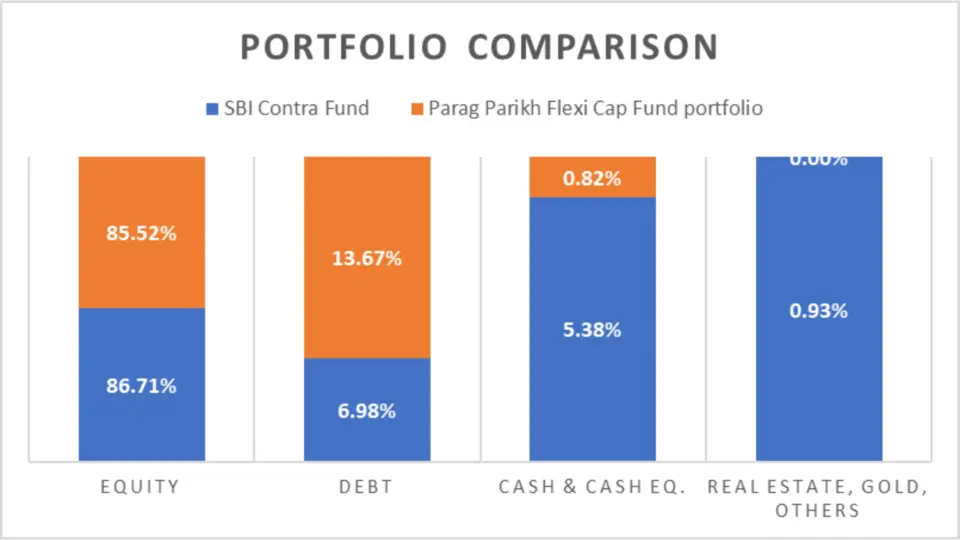
| Category | SBI Contra Fund | Parag Parikh Flexi Cap Fund |
| Equity | 86.71% | 85.52% |
| Debt | 6.98% | 13.67% |
| Cash & Cash Equivalents | 5.38% | 0.82% |
| Real Estate, Gold, Others | 0.93% | 0.00% |
| Commodities | 0.00% | 0.00% |
Analysis
Equity Exposure
Both funds have high equity exposure, with SBI Contra Fund at 86.71% and Parag Parikh Flexi Cap Fund at 85.52%. This indicates that both funds are heavily invested in stocks, which can drive higher returns and volatility.
Debt Exposure
Parag Parikh Flexi Cap Fund has a higher debt exposure (13.67%) than the SBI Contra Fund (6.98%). This suggests that Parag Parikh Flexi Cap Fund may have a more conservative approach, providing more stability through fixed-income investments.
Cash & Cash Equivalents
SBI Contra Fund holds more cash and cash equivalents (5.38%) than Parag Parikh Flexi Cap Fund (0.82%). This can provide more liquidity and flexibility for the fund to benefit from investment opportunities.
Key Takeaways
- Higher Equity Exposure: Both funds have a high equity exposure, indicating a focus on growth.
- Conservative Approach by Parag Parikh: Parag Parikh Flexi Cap Fund has a higher debt exposure, suggesting a more conservative investment strategy.
- Diversification by SBI Contra Fund: SBI Contra Fund has a higher allocation to cash and cash equivalents, providing more liquidity and flexibility.
Market Cap Allocation
Market cap allocation provides insights into the size of the companies where the funds are invested. Let’s compare the market cap allocation for the SBI Contra Fund and Parag Parikh Flexi Cap Fund.
| Category | SBI Contra Fund | Parag Parikh Flexi Cap Fund |
| No of Stocks | 91 | 48 |
| Large Cap | 35.51% | 49.05% |
| Mid Cap | 18.27% | 6.17% |
| Small Cap | 8.96% | 6.52% |
| Others | 19.90% | 24.71% |
| Foreign Equity Holdings | 3.76% | 15.48% |
Analysis
No of Stocks
SBI Contra Fund holds 91 stocks, significantly more than the Parag Parikh Flexi Cap Fund’s 48 stocks. This indicates a more diversified portfolio for the SBI Contra Fund.
Large Cap Allocation
Parag Parikh Flexi Cap Fund has a higher allocation to large-cap stocks (49.05%) than the SBI Contra Fund (35.51%). This suggests a focus on more stable, established companies.
Mid Cap Allocation
SBI Contra Fund has a higher allocation to mid-cap stocks (18.27%) than Parag Parikh Flexi Cap Fund (6.17%). This indicates a greater emphasis on growth potential from mid-sized companies.
Small Cap Allocation
Both funds have similar small-cap allocations, with the SBI Contra Fund at 8.96% and the Parag Parikh Flexi Cap Fund at 6.52%.
Others and Foreign Equity Holdings
Parag Parikh Flexi Cap Fund has a higher allocation to ‘Others’ (24.71%) and foreign equity holdings (15.48%) compared to SBI Contra Fund (19.90% and 3.76%, respectively). This indicates a more diversified approach across different categories and geographies.
Key Takeaways
- Higher Diversification by SBI Contra Fund: SBI Contra Fund holds more stocks, indicating a diversified portfolio.
- Focus on Large Caps by Parag Parikh: Parag Parikh Flexi Cap Fund has a higher allocation to large-cap stocks.
- Growth Potential by SBI Contra Fund: SBI Contra Fund has a higher provision to mid-cap stocks, focusing on growth potential.
Sector Allocation
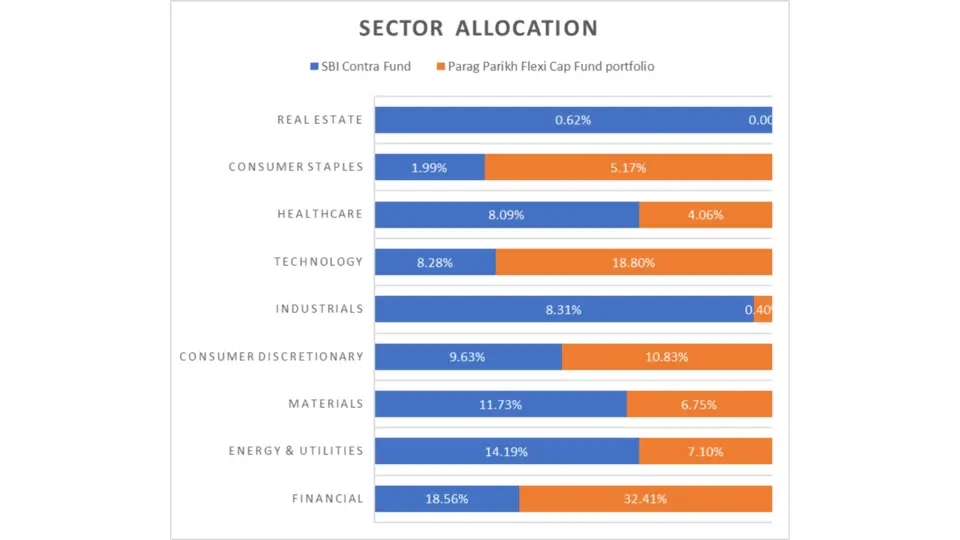
Sector allocation provides insights into the industries in which the funds are invested. Let’s compare the sector allocation for the SBI Contra Fund and Parag Parikh Flexi Cap Fund.
| Category | SBI Contra Fund | Parag Parikh Flexi Cap Fund |
| Financial | 18.56% | 32.41% |
| Energy & Utilities | 14.19% | 7.10% |
| Materials | 11.73% | 6.75% |
| Consumer Discretionary | 9.63% | 10.83% |
| Industrials | 8.31% | 0.40% |
| Technology | 8.28% | 18.80% |
| Healthcare | 8.09% | 4.06% |
| Consumer Staples | 1.99% | 5.17% |
| Real Estate | 0.62% | NA |
Key Takeaways
- Strong Financial Focus by Parag Parikh: Parag Parikh Flexi Cap Fund has a high allocation to the financial sector.
- Energy & Utilities Focus by SBI Contra Fund: SBI Contra Fund has a higher allocation to the energy & utilities sector.
- Tech-driven Growth by Parag Parikh: Parag Parikh Flexi Cap Fund’s significant allocation to the technology sector suggests a focus on tech-driven growth.
Fund Management Comparison
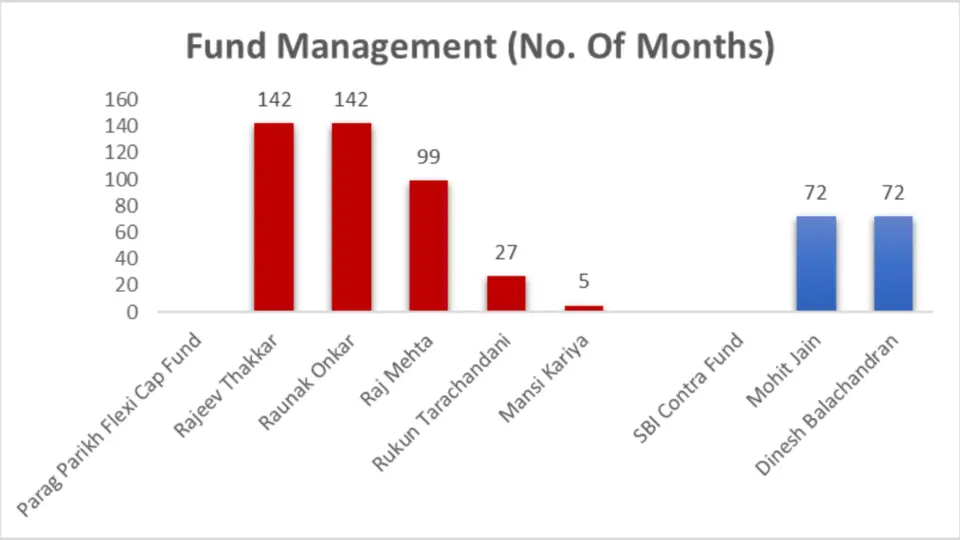
The experience and expertise of fund managers play a crucial role in a fund’s Performance. Let’s compare the fund management teams for the SBI Contra Fund and Parag Parikh Flexi Cap Fund.
| Fund Name | Fund Manager | No. Of Months |
| Parag Parikh Flexi Cap Fund | Rajeev Thakkar | 142 |
| Raunak Onkar | 142 | |
| Raj Mehta | 99 | |
| Rukun Tarachandani | 27 | |
| Mansi Kariya | 5 | |
| SBI Contra Fund | Mohit Jain | 72 |
| Dinesh Balachandran | 72 |
Key Takeaways
- Experienced Team at Parag Parikh: Parag Parikh Flexi Cap Fund has a more skilled and diverse team.
- Consistent Management at SBI Contra Fund: SBI Contra Fund’s managers have significant experience, although the team is more minor.
Other Important General Details
Understanding the critical general details about each fund can help investors make better decisions. Here, we’ll compare some important general information about the SBI Contra Fund and Parag Parikh Flexi Cap Fund.
| Category | SBI Contra Fund | Parag Parikh Flexi Cap Fund |
| NAV | 379.43 | 77.42 |
| AUM (in Cr.) | 26,776 | 60,559 |
| Expense Ratio (%) | 0.65 | 0.57 |
| Turnover | 188.00% | 34% |
| Benchmark | NIFTY 100 | NIFTY 500 |
Key Takeaways
- Higher NAV for SBI Contra Fund: SBI Contra Fund has a significantly higher NAV.
- Larger AUM for Parag Parikh: Parag Parikh Flexi Cap Fund has a larger AUM, indicating higher investor confidence.
- Lower Expense Ratio for Parag Parikh: Parag Parikh Flexi Cap Fund offers a lower expense ratio.
- Different Benchmarks: Each fund tracks a different benchmark, indicating varied market focus.
Minimum Investment Amount
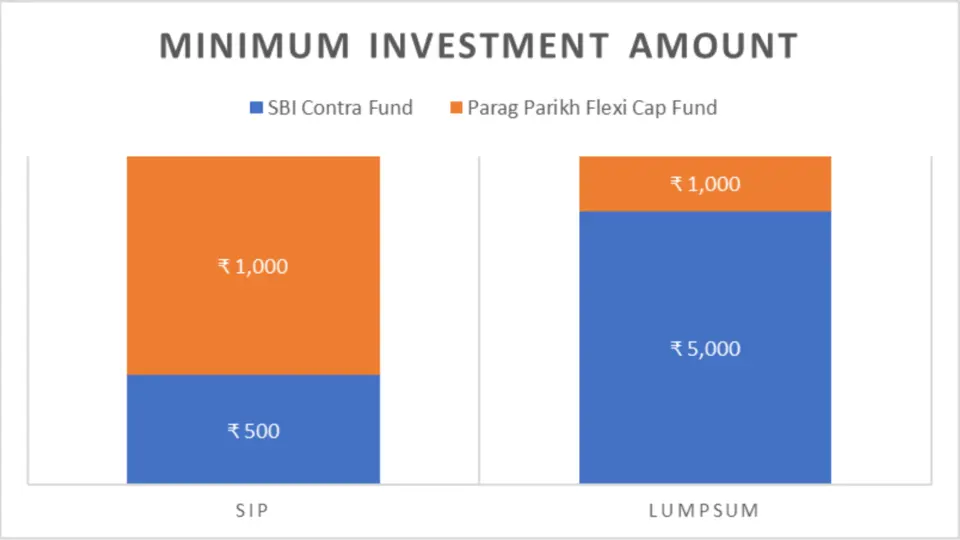
The minimum investment amount required for SIP and lumpsum investments can influence an investor’s decision based on their budget and investment strategy.
| Category | SIP | Lumpsum |
| SBI Contra Fund | ₹500 | ₹5,000 |
| Parag Parikh Flexi Cap Fund | ₹1,000 | ₹1,000 |
Analysis
SIP (Systematic Investment Plan)
SBI Contra Fund requires a lower minimum SIP amount of ₹500 compared to Parag Parikh Flexi Cap Fund’s ₹1,000. This makes the SBI Contra Fund more accessible for investors with smaller budgets.
Lumpsum Investment
For lumpsum investments, SBI Contra Fund requires a higher minimum amount of ₹5,000, whereas Parag Parikh Flexi Cap Fund requires only ₹1,000. This makes Parag Parikh Flexi Cap Fund more accessible for one-time investors.
Conclusion
SBI Contra Fund and Parag Parikh Flexi Cap Fund have their strengths, their choice depends on your investment tenure and risk appetite. SBI Contra Fund outperforms in short to medium terms with higher returns and a lower minimum SIP amount, making it an excellent choice for those seeking aggressive growth and are comfortable with higher short-term volatility.
On the other hand, Parag Parikh Flexi Cap Fund shines with its superior long-term Performance, lower expense ratio, and stability during market downturns, making it more suitable for conservative investors looking for consistent long-term growth with lower volatility.

FAQs-Parag Parikh Flexi Cap Fund vs SBI Contra Fund
1. Which fund has shown better short-term Performance, the SBI Contra Fund or Parag Parikh Flexi Cap Fund?
SBI Contra Fund has demonstrated superior short-term Performance, significantly outperforming Parag Parikh Flexi Cap Fund in 1, 2, and 3-year returns. For example, SBI Contra Fund had a 1-year return of 51.71%, compared to Parag Parikh Flexi Cap Fund’s 40.17%.
2. How do the funds compare in terms of long-term Performance?
Over ten years, Parag Parikh Flexi Cap Fund slightly outperforms SBI Contra Fund, with returns of 20.04% compared to 19.54%. This indicates more consistent long-term growth for the Parag Parikh Flexi Cap Fund.
3. Which fund is better for lumpsum investments?
For short-term lumpsum investments, SBI Contra Fund shows higher growth potential. For instance, a one-year lump sum investment would have grown to ₹15,187.9 in the SBI Contra Fund, compared to ₹14,029.5 in the Parag Parikh Flexi Cap Fund. However, for very long-term investments (10 years), Parag Parikh Flexi Cap Fund outperforms with a value of ₹62,195.2 compared to SBI Contra Fund’s ₹59,681.4
4. What are the differences in SIP returns between the two funds?
SBI Contra Fund has consistently delivered higher SIP returns across various periods. For example, a 5-year SIP return is 35.19% for the SBI Contra Fund, whereas the Parag Parikh Flexi Cap Fund offers 26.57%. Both funds are long-term solid performers, but SBI Contra Fund has a slight advantage.
5. Based on their quarterly results, How do the funds perform during different market conditions?
SBI Contra Fund outperformed Parag Parikh Flexi Cap Fund in more quarters (7 out of 11), indicating more robust Performance across various market conditions. However, Parag Parikh Flexi Cap Fund showed strong Performance in the most recent quarter (Q1 2024).
6. What are the key risk metrics for these funds?
SBI Contra Fund has higher short-term risk-adjusted returns (Sharpe Ratio of 1.86 for 3 years). Still, Parag Parikh Flexi Cap Fund shows better long-term risk-adjusted Performance (Sharpe Ratio of 0.99 for 10 years). Parag Parikh Flexi Cap Fund has lower Beta values, indicating less volatility.
7. How do the funds compare in terms of portfolio composition?
SBI Contra Fund holds a more diversified portfolio with 91 stocks compared to Parag Parikh Flexi Cap Fund’s 48 stocks. Parag Parikh Flexi Cap Fund has a higher allocation to large-cap stocks (49.05%) and foreign equity holdings (15.48%), suggesting a focus on more stable, established companies and international diversification.
8. What are the sector allocations for these funds?
Parag Parikh Flexi Cap Fund has a higher allocation to the financial sector (32.41%) and technology sector (18.80%). In contrast, the SBI Contra Fund has a significant allocation to the energy & utilities sector (14.19%) and materials sector (11.73%).
9. Which fund has a more experienced fund management team?
Parag Parikh Flexi Cap Fund boasts a more experienced and diverse management team, with critical managers like Rajeev Thakkar and Raunak Onkar, each having over 140 months of experience. SBI Contra Fund is managed by Mohit Jain and Dinesh Balachandran, each with 72 months of experience.
10. What are the general details, such as NAV, AUM, and expense ratios for these funds?
SBI Contra Fund has an NAV of 379.43 and an AUM of ₹26,776 Cr, with an expense ratio of 0.65%. Parag Parikh Flexi Cap Fund has an NAV of 77.42 and a larger AUM of ₹60,559 Cr, with a lower expense ratio of 0.57%
11. What are the minimum investment amounts for these funds?
For SIPs, SBI Contra Fund requires a lower minimum investment amount of ₹500 compared to Parag Parikh Flexi Cap Fund’s ₹1,000. The SBI Contra Fund requires ₹5,000 for lumpsum investments, whereas the Parag Parikh Flexi Cap Fund requires ₹1,000.
12. Which fund is more suitable for investors with different risk appetites?
SBI Contra Fund is better for aggressive investors seeking higher short-term returns and can handle higher volatility. With its lower volatility and consistent long-term Performance, Parag Parikh Flexi Cap Fund is more suitable for conservative investors looking for reliability and steady growth
Disclaimer:
The information provided in this article is solely the author/advertisers’ opinion and not investment advice – it is provided for educational purposes only. Using this, you agree that the information does not constitute any investment or financial instructions by Ace Equity Research/Mutual Fund Focus/IPO First and the team. Anyone wishing to invest should seek their own independent financial or professional advice. Conduct your research with registered financial advisors before making any investment decisions. Ace Equity Research/ Mutual Fund Focus / IPO First and the team are not accountable for the investment views provided in the article.
Mutual Fund investments are subject to market risks. Read all scheme-related documents carefully.
Investments in the securities market are subject to market risks. Read all the related documents carefully before investing