Are you torn between the Quant Flexi Cap Fund vs JM Flexi Cap Fund for your investment portfolio? You’re in the right place! This article will provide a complete and engaging comparative analysis of these two popular Flexi cap mutual funds. We’ll look at their SIP returns, investment values, CAGR, rolling returns, and annualized returns to help you make an informed decision.
Investment Style
| Fund Name | Investment Style |
| Quant Flexi Cap Fund | Value |
| JM Flexi Cap Fund | Growth |

Trailing Returns

| Period Invested For | Quant Flexi Cap Fund | JM Flexi Cap Fund |
| 1 Year | 57.57% | 64.80% |
| 2 Years | 34.29% | 40.19% |
| 3 Years | 30.43% | 30.86% |
| 5 Years | 32.12% | 25.20% |
| 10 Years | 24.20% | 21.19% |
Analysis
- Over the 1 year, JM Flexi Cap Fund outperforms with a 64.80% return compared to Quant Flexi Cap Fund‘s 57.57%.
- For 2 years, JM Flexi Cap Fund again leads with 40.19%, while Quant Flexi Cap Fund trails with 34.29%.
- The 3-year returns are close, with JM Flexi Cap Fund at 30.86% and Quant Flexi Cap Fund at 30.43%.
- Moving to the 5 years, Quant Flexi Cap Fund takes the lead with 32.12%, leaving JM Flexi Cap Fund behind at 25.20%.
Key Takeaways
- Short-Term (1-2 years): JM Flexi Cap Fund excels in short-term SIP returns, ideal for those seeking quick gains.
- Medium-Term (3 years): Both funds perform well, but JM Flexi Cap Fund has a slight advantage.
- Long-Term (5-10 years): Quant Flexi Cap Fund dominates, offering better returns and consistency, making it the optimal choice for long-term investors.
SIP Returns
Returns Over Different Periods
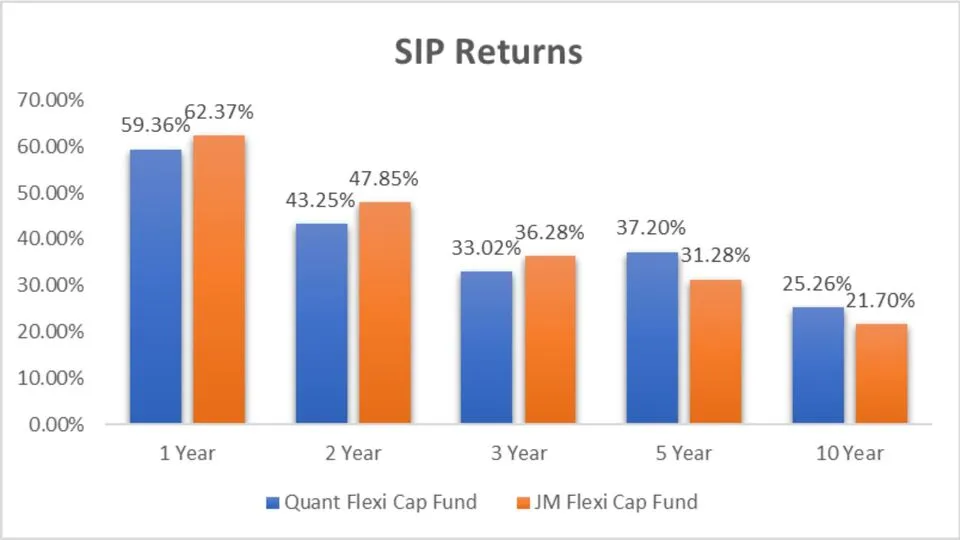
| Period Invested For | Quant Flexi Cap Fund | JM Flexi Cap Fund |
| 1 Year | 59.36% | 62.37% |
| 2 Years | 43.25% | 47.85% |
| 3 Years | 33.02% | 36.28% |
| 5 Years | 37.20% | 31.28% |
| 10 Years | 25.26% | 21.70% |
Analysis
- 1 Year: JM Flexi Cap Fund leads 62.37%, while Quant Flexi Cap Fund follows at 59.36%.
- 2 Years: JM Flexi Cap Fund again outperforms with 47.85% compared to Quant Flexi Cap Fund’s 43.25%.
- 3 Years: JM Flexi Cap Fund has a slight edge at 36.28% over Quant Flexi Cap Fund’s 33.02%.
- 5 Years: Quant Flexi Cap Fund takes the lead with 37.20%, surpassing JM Flexi Cap Fund’s 31.28%.
- 10 Years: Quant Flexi Cap Fund maintains its lead with 25.26%, while JM Flexi Cap Fund stands at 21.70%.
Key Takeaways
- Short-Term (1-2 years): JM Flexi Cap Fund excels in short-term growth, making it suitable for investors seeking immediate returns.
- Medium-Term (3 years): JM Flexi Cap Fund provides slightly better returns for a three-year investment horizon. Long-Term (5-10 years)
- Quant Flexi Cap Fund dominates in the long term, offering significantly higher returns and consistent growth, making it the best choice for long-term investors
SIP Investment Value
Investment Growth Over Time
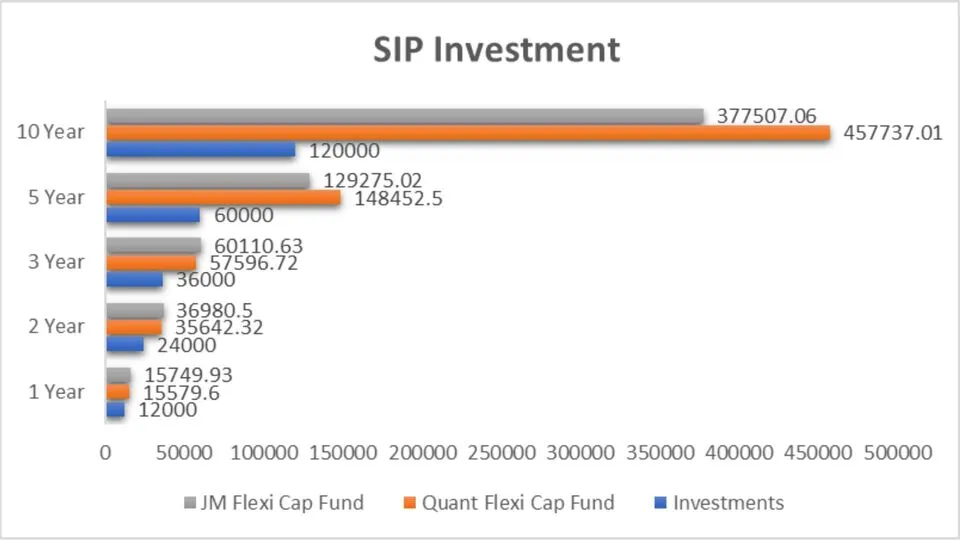
| Period Invested For | Investments (₹) | Quant Flexi Cap Fund (₹) | JM Flexi Cap Fund (₹) |
| 1 Year | 12,000 | 15,579.6 | 15,749.93 |
| 2 Years | 24,000 | 35,642.32 | 36,980.5 |
| 3 Years | 36,000 | 57,596.72 | 60,110.63 |
| 5 Years | 60,000 | 148,452.5 | 129,275.02 |
| 10 Years | 120,000 | 457,737.01 | 377,507.06 |
Analysis
- 1 Year: An investment of ₹12,000 grows to ₹15,749.93 in JM Flexi Cap Fund, slightly higher than ₹15,579.6 in Quant Flexi Cap Fund.
- 2 Years: For ₹24,000 invested, JM Flexi Cap Fund achieves ₹36,980.5, outpacing Quant Flexi Cap Fund’s ₹35,642.32.
- 3 Years: ₹36,000 invested grows to ₹60,110.63 in JM Flexi Cap Fund compared to ₹57,596.72 in Quant Flexi Cap Fund.
- 5 Years: Quant Flexi Cap Fund outshines with ₹148,452.5 for ₹60,000 invested, whereas JM Flexi Cap Fund stands at ₹129,275.02.
- 10 Years: Over a decade, ₹120,000 invested in Quant Flexi Cap Fund grows to ₹457,737.01, while JM Flexi Cap Fund reaches ₹377,507.06.
Key Takeaways
- Short-Term (1-2 years): JM Flexi Cap Fund excels in short-term growth, making it suitable for investors seeking immediate returns.
- Medium-Term (3 years): JM Flexi Cap Fund provides slightly better returns for a three-year investment horizon. Long-Term (5-10 years): Quant Flexi Cap Fund dominates in the long term, offering significantly higher returns and consistent growth, making it the best choice for long-term investors
Compound Annual Growth Rate (CAGR)

| Category | 1 Year | 3 Years | 5 Years | 9 Years |
| Quant Flexi Cap Fund | 59.47% | 34.15% | 30.15% | 21.56% |
| JM Flexi Cap Fund | 59.10% | 24.12% | 23.31% | 17.52% |
Analysis
- 1 Year: Both funds perform similarly, with Quant Flexi Cap Fund slightly ahead at 59.47% compared to 59.10% for JM Flexi Cap Fund.
- 3 Years: Quant Flexi Cap Fund leads with 34.15%, outpacing JM Flexi Cap Fund’s 24.12%.
- 5 Years: Quant Flexi Cap Fund continues to outperform with 30.15% against JM Flexi Cap Fund’s 23.31%.
- 9 Years: Quant Flexi Cap Fund remains in the lead with 21.56%, while JM Flexi Cap Fund stands at 17.52%.
Key Takeaways
- Short-Term (1 year): Both funds show short-term solid growth, with Quant Flexi Cap Fund slightly outperforming.
- Medium-Term (3-5 years): Quant Flexi Cap Fund demonstrates significantly better performance, making it ideal for medium-term investments.
- Long-Term (9 years): Quant Flexi Cap Fund consistently outperforms, providing superior long-term growth, making it the preferred choice for long-term investors.
Rolling Returns
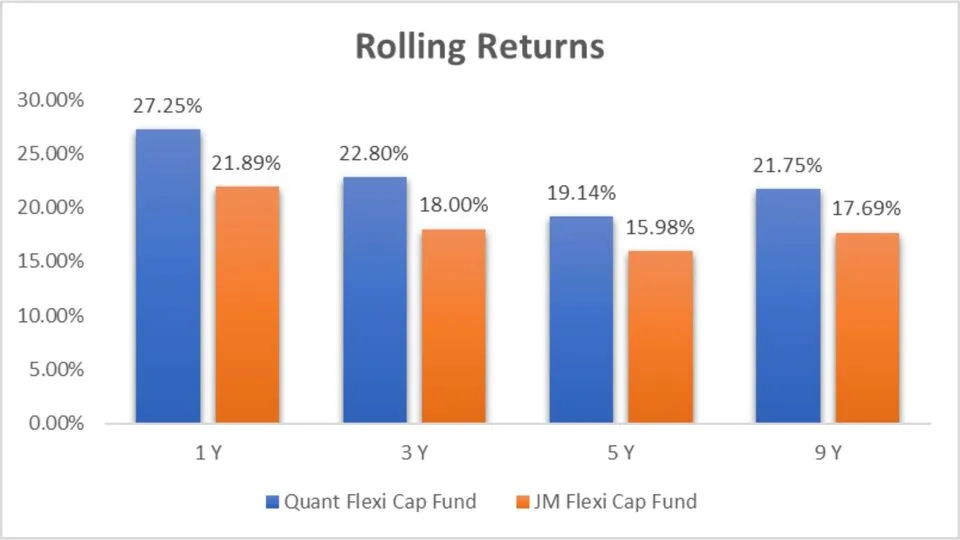
| Category | 1 Year | 3 Years | 5 Years | 9 Years |
| Quant Flexi Cap Fund | 27.25% | 22.80% | 19.14% | 21.75% |
| JM Flexi Cap Fund | 21.89% | 18.00% | 15.98% | 17.69% |
Analysis
- 1 Year: Quant Flexi Cap Fund outperforms 27.25%, compared to 21.89% for JM Flexi Cap Fund.
- 3 Years: Quant Flexi Cap Fund leads 22.80%, while JM Flexi Cap Fund returns 18.00%.
- 5 Years: Quant Flexi Cap Fund shows 19.14% against JM Flexi Cap Fund’s 15.98%.
- 9 Years: Quant Flexi Cap Fund maintains a higher return at 21.75%, whereas JM Flexi Cap Fund stands at 17.69%.
Key Takeaways
- Short-Term (1 year): Quant Flexi Cap Fund outperforms, offering significantly higher returns.
- Medium-Term (3-5 years): Quant Flexi Cap Fund consistently leads, making it ideal for medium-term investments.
- Long-Term (9 years): Quant Flexi Cap Fund delivers superior performance, providing excellent long-term growth, making it the preferred choice for long-term investors.
Annualized/Calendar Year Returns
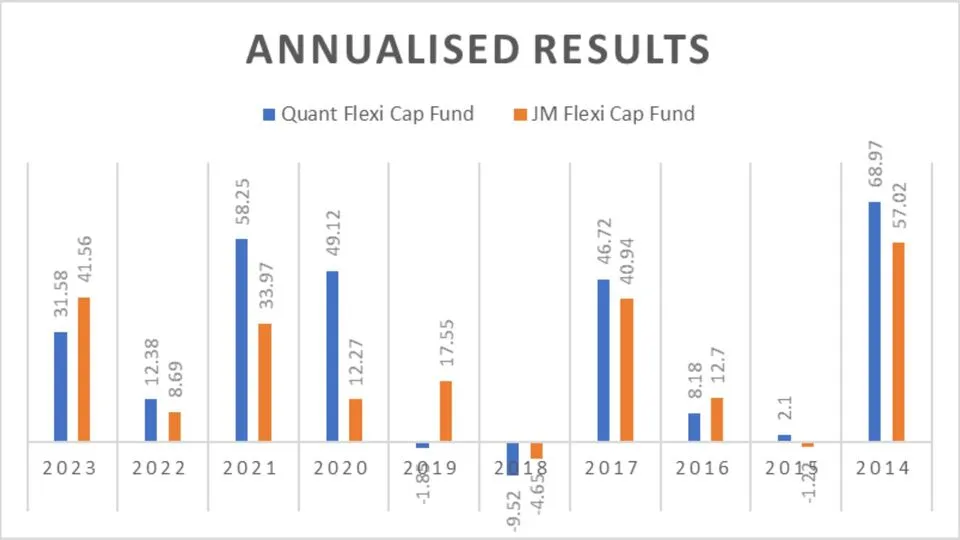
| Period | Quant Flexi Cap Fund | JM Flexi Cap Fund |
| 2023 | 31.58 | 41.56 |
| 2022 | 12.38 | 8.69 |
| 2021 | 58.25 | 33.97 |
| 2020 | 49.12 | 12.27 |
| 2019 | -1.85 | 17.55 |
| 2018 | -9.52 | -4.65 |
| 2017 | 46.72 | 40.94 |
| 2016 | 8.18 | 12.70 |
| 2015 | 2.10 | -1.22 |
| 2014 | 68.97 | 57.02 |
Analysis
- 2023: JM Flexi Cap Fund leads 41.56%, while Quant Flexi Cap Fund stands at 31.58%.
- 2022: Quant Flexi Cap Fund outperforms with 12.38%, compared to JM Flexi Cap Fund’s 8.69%.
- 2021: Quant Flexi Cap Fund shows impressive returns of 58.25% against JM Flexi Cap Fund’s 33.97%.
- 2020: Quant Flexi Cap Fund outperforms 49.12%, while JM Flexi Cap Fund returns 12.27%.
- 2019: JM Flexi Cap Fund leads 17.55%, compared to Quant Flexi Cap Fund’s -1.85%.
- 2018: Both funds show negative returns, with Quant Flexi Cap Fund at -9.52% and JM Flexi Cap Fund at -4.65%.
- 2017: Quant Flexi Cap Fund leads with 46.72%, while JM Flexi Cap Fund follows at 40.94%.
- 2016: JM Flexi Cap Fund outperforms 12.70%, compared to Quant Flexi Cap Fund’s 8.18%.
- 2015: Quant Flexi Cap Fund shows a slight positive return of 2.10%, while JM Flexi Cap Fund is at -1.22%.
- 2014: Quant Flexi Cap Fund leads with 68.97%, compared to JM Flexi Cap Fund’s 57.02%.
Outperformance
- Quant Flexi Cap Fund: 6 times
- JM Flexi Cap Fund: 4 times
Key Takeaways
Outperformance Count: Quant Flexi Cap Fund outperformed JM Flexi Cap Fund 6 times. JM Flexi Cap Fund outperformed Quant Flexi Cap Fund 4 times.
Short-Term Performance: JM Flexi Cap Fund has shown more robust performance in recent years, like 2023 and 2016. Long-Term Performance: Quant Flexi Cap Fund excels in more years, particularly in high-growth years like 2014, 2020, and 2021, indicating better long-term potential
Best Quarters
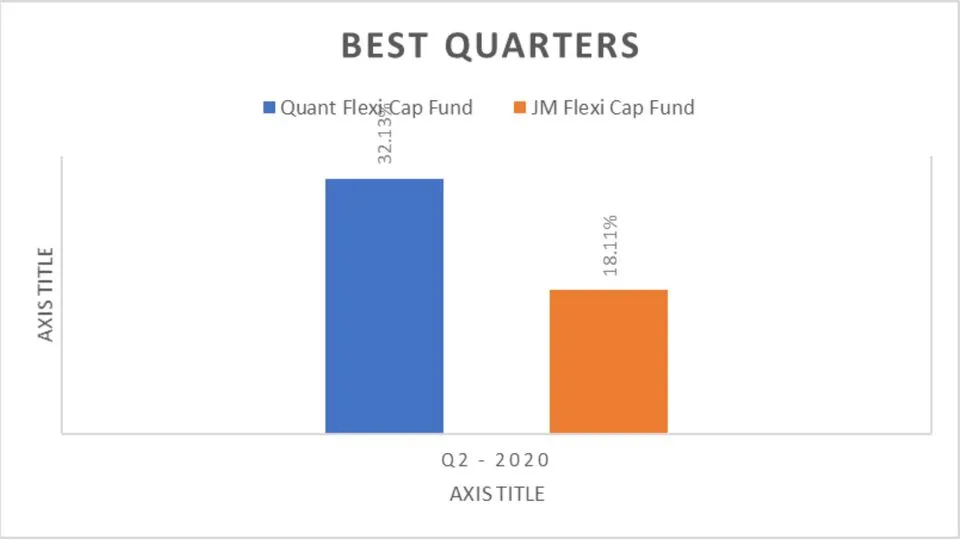
| Period | Quant Flexi Cap Fund | JM Flexi Cap Fund |
| Q2 – 2020 | 32.13% | 18.11% |
Analysis
- In Q2 of 2020, the Quant Flexi Cap Fund significantly outperformed the JM Flexi Cap Fund, achieving a return of 32.13% compared to 18.11%.
Key Takeaways
Quant Flexi Cap Fund demonstrated exceptional performance during one of the best quarters, showing its potential for high growth and strong returns during
favourable market conditions.
This outperformance indicates that Quant Flexi Cap Fund can capitalize on favourable market trends more effectively than JM Flexi Cap Fund, making it a compelling option for investors looking for high returns during intense market periods.
Worst Quarters

| Period | Quant Flexi Cap Fund | JM Flexi Cap Fund |
| Q1 – 2020 | -22.95% | -25.63% |
| Q2 – 2022 | -11.63% | -8.70% |
Analysis
- During the worst quarters, specifically Q1 of 2020, the Quant Flexi Cap Fund had a slightly better performance with a -22.95% return compared to -25.63% for the JM Flexi Cap Fund.
- In Q2 of 2022, JM Flexi Cap Fund outperformed with a less negative return of -8.70%, whereas Quant Flexi Cap Fund recorded -11.63%.
Key Takeaways
- Q1 – 2020: Quant Flexi Cap Fund performed better during the significant market drop, indicating its relative resilience.
- Q2 – 2022: JM Flexi Cap Fund outperformed during another challenging period, suggesting its capability to mitigate losses effectively.
Quarterly Results
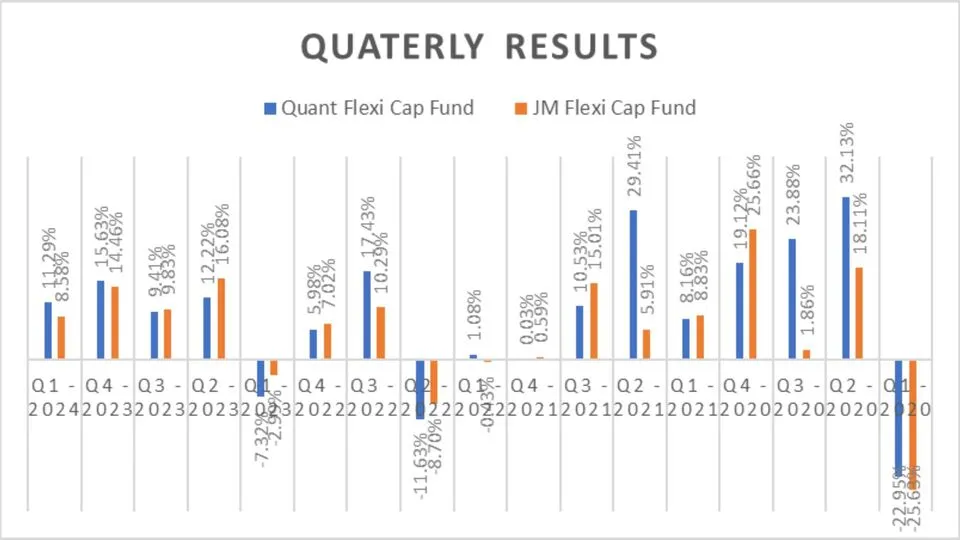
| Period | Quant Flexi Cap Fund | JM Flexi Cap Fund |
| Q1 – 2024 | 11.29% | 8.58% |
| Q4 – 2023 | 15.63% | 14.46% |
| Q3 – 2023 | 9.41% | 9.83% |
| Q2 – 2023 | 12.22% | 16.08% |
| Q1 – 2023 | -7.32% | -2.99% |
| Q4 – 2022 | 5.98% | 7.02% |
| Q3 – 2022 | 17.43% | 10.29% |
| Q2 – 2022 | -11.63% | -8.70% |
| Q1 – 2022 | 1.08% | -0.43% |
| Q4 – 2021 | 0.03% | 0.59% |
| Q3 – 2021 | 10.53% | 15.01% |
| Q2 – 2021 | 29.41% | 5.91% |
| Q1 – 2021 | 8.16% | 8.83% |
| Q4 – 2020 | 19.12% | 25.66% |
| Q3 – 2020 | 23.88% | 1.86% |
| Q2 – 2020 | 32.13% | 18.11% |
| Q1 – 2020 | -22.95% | -25.63% |
Analysis
- Q1 2024: Quant Flexi Cap Fund led with 11.29% compared to JM Flexi Cap Fund’s 8.58%.
- Q4 2023: Quant Flexi Cap Fund showed a slight edge with 15.63% over JM Flexi Cap Fund’s 14.46%.
- Q3 2023: JM Flexi Cap Fund outperformed slightly at 9.83%, while Quant Flexi Cap Fund stood at 9.41%.
- Q2 2023: JM Flexi Cap Fund outshined with 16.08% against Quant Flexi Cap Fund’s 12.22%.
- Q1 2023: JM Flexi Cap Fund performed better with a smaller negative return of -2.99%, compared to -7.32% for Quant Flexi Cap Fund.
- Q4 2022: JM Flexi Cap Fund again led with 7.02%, while Quant Flexi Cap Fund returned 5.98%.
- Q3 2022: Quant Flexi Cap Fund outperformed by 17.43% against JM Flexi Cap Fund’s 10.29%.
- Q2 2022: JM Flexi Cap Fund had a more minor loss at -8.70%, compared to -11.63% for Quant Flexi Cap Fund.
- Q1 2022: Quant Flexi Cap Fund led with 1.08% while JM Flexi Cap Fund recorded -0.43%.
- Q4 2021: JM Flexi Cap Fund outperformed slightly with 0.59% over Quant Flexi Cap Fund’s 0.03%.
- Q3 2021: JM Flexi Cap Fund led with 15.01%, while Quant Flexi Cap Fund stood at 10.53%.
- Q2 2021: Quant Flexi Cap Fund significantly outperformed with 29.41% compared to JM Flexi Cap Fund’s 5.91%.
- Q1 2021: JM Flexi Cap Fund had a slight edge with 8.83% over Quant Flexi Cap Fund’s 8.16%.
- Q4 2020: JM Flexi Cap Fund outperformed with 25.66% compared to Quant Flexi Cap Fund’s 19.12%.
- Q3 2020: Quant Flexi Cap Fund led significantly with 23.88% against JM Flexi Cap Fund’s 1.86%.
- Q2 2020: Quant Flexi Cap Fund outperformed with 32.13% compared to JM Flexi Cap Fund’s 18.11%.
- Q1 2020: Both funds experienced losses, with Quant Flexi Cap Fund at -22.95% and JM Flexi Cap Fund at -25.63%.
Outperformance
- Quant Flexi Cap Fund: 8 times
- JM Flexi Cap Fund: 9 times
Key Takeaways
- Quarterly Performance: Both funds have periods of outperformance. JM Flexi Cap Fund leads in 9 out of 17 quarters, while Quant Flexi Cap Fund leads in 8 quarters.
- Short-Term Gains: JM Flexi Cap Fund has often performed better in recent quarters.
- Long-Term Performance: Quant Flexi Cap Fund demonstrates significant outperformance during solid market periods, indicating its potential for higher returns during favorable conditions.
Risk Analysis
Maximum Drawdown
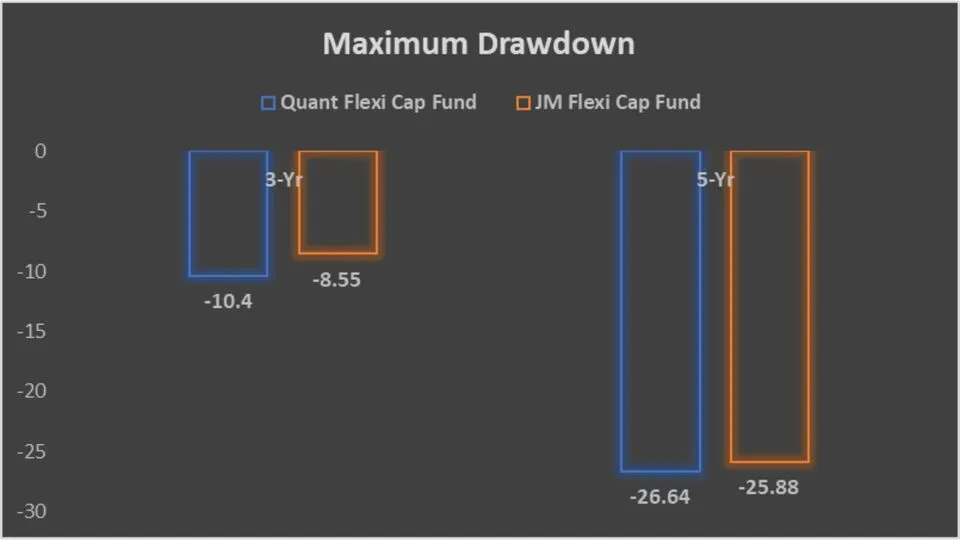
| Period | Quant Flexi Cap Fund | JM Flexi Cap Fund |
| 3-Yr | -10.4 | -8.55 |
| 5-Yr | -26.64 | -25.88 |
Analysis
- Over 3 years, the JM Flexi Cap Fund had a lower maximum drawdown of -8.55% compared to -10.4% for the Quant Flexi Cap Fund.
- Over 5 years, both funds had similar drawdowns, with JM Flexi Cap Fund at -25.88% and Quant Flexi Cap Fund at -26.64%.
Key Takeaways
- Short-Term (3 years): JM Flexi Cap Fund shows a lower maximum drawdown, indicating better performance in minimizing losses and handling market volatility.
- Medium-Term (5 years): Both funds exhibit similar maximum drawdowns, with JM Flexi Cap Fund showing marginally lower risk
Mean, Sortino Ratio and Treynor’s Ratio

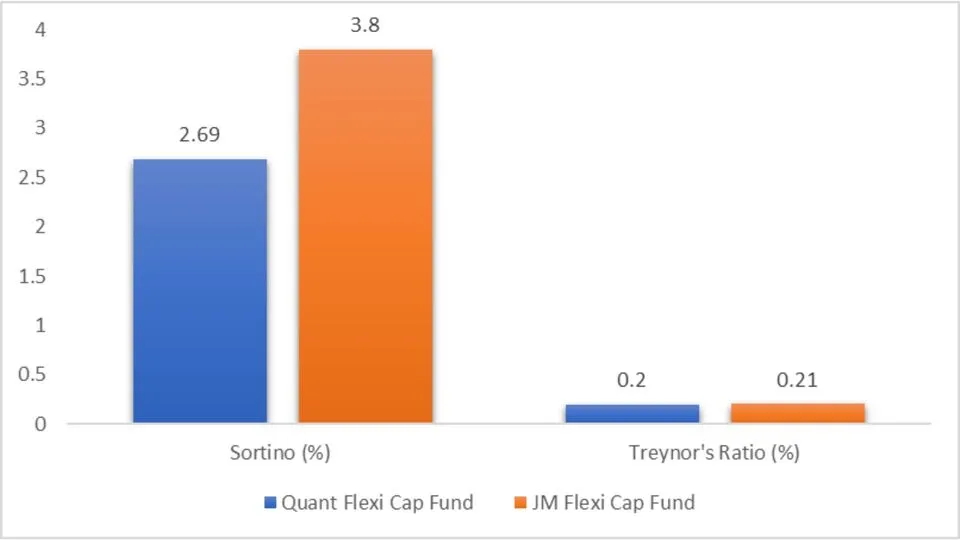
| Metric | Quant Flexi Cap Fund | JM Flexi Cap Fund |
| Mean Return (%) | 30.84 | 28.51 |
| Sortino Ratio (%) | 2.69 | 3.8 |
| Treynor’s Ratio (%) | 0.2 | 0.21 |
Analysis:
- Mean Return: Quant Flexi Cap Fund has a higher mean return of 30.84% than JM Flexi Cap Fund’s 28.51%.
- Sortino Ratio: JM Flexi Cap Fund has a better Sortino Ratio of 3.8 than Quant Flexi Cap Fund’s 2.69, indicating better risk-adjusted returns.
- Treynor’s Ratio: JM Flexi Cap Fund slightly outperforms with a Treynor’s Ratio of 0.21 compared to 0.2 for Quant Flexi Cap Fund.
Key Takeaways
- Higher Mean Return: Quant Flexi Cap Fund offers higher average returns, making it attractive for investors seeking outstanding performance.
- Better Risk-Adjusted Returns: JM Flexi Cap Fund provides better risk-adjusted returns, as evidenced by its superior Sortino Ratio.
- Market Risk Performance: JM Flexi Cap Fund slightly outperforms Treynor’s Ratio, indicating better handling of market risk.
- Volatility: Quant Flexi Cap Fund has higher volatility, indicating more significant performance fluctuations, while JM Flexi Cap Fund demonstrates lower volatility, suggesting
Standard Deviation
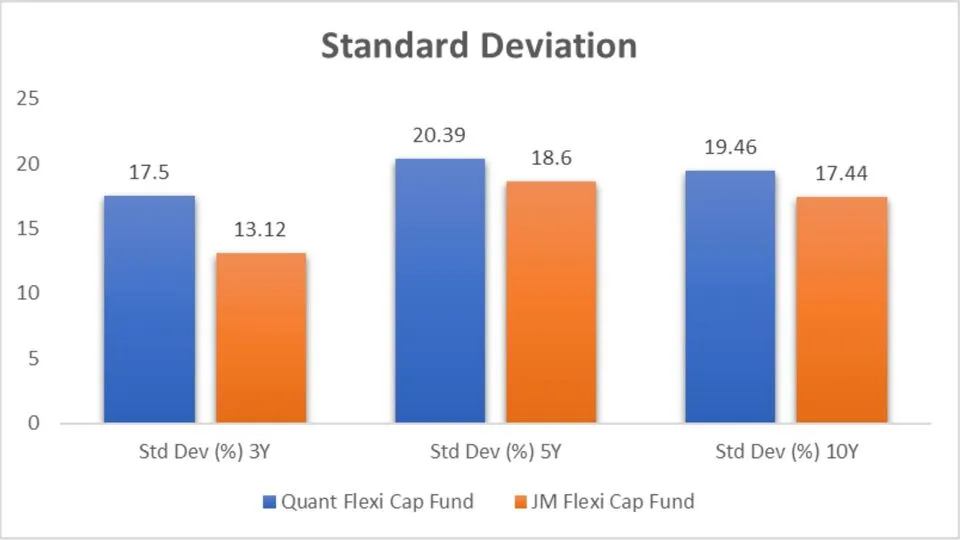
| Metric | Quant Flexi Cap Fund | JM Flexi Cap Fund |
| Standard Deviation 3Y (%) | 17.5 | 13.12 |
| Standard Deviation 5Y (%) | 20.39 | 18.6 |
| Standard Deviation 10Y (%) | 19.46 | 17.44 |
Analysis
- 3-Year Standard Deviation: The Quant Flexi Cap Fund exhibits higher volatility with a standard deviation of 17.5% compared to JM Flexi Cap Fund’s 13.12%. This indicates more significant price fluctuations in the short term.
- 5-Year Standard Deviation: Over five years, the Quant Flexi Cap Fund shows higher volatility at 20.39% versus 18.6% for the JM Flexi Cap Fund.
- 10-Year Standard Deviation: The trend remains over ten years, with Quant Flexi Cap Fund having a higher standard deviation of 19.46% compared to JM Flexi Cap Fund’s 17.44%.
Key Takeaways
- Short-Term Volatility: The Quant Flexi Cap Fund exhibits higher short-term volatility (3-year standard deviation) than the JM Flexi Cap Fund, indicating more significant price fluctuations.
- Medium-Term Volatility: The Quant Flexi Cap Fund shows higher medium-term volatility (5-year standard deviation), suggesting more pronounced price movements.
- Long-Term Volatility: Over the long term (10-year standard deviation), the Quant Flexi Cap Fund maintains higher volatility, indicating consistent higher price fluctuations
Sharpe Ratio Analysis
The Sharpe ratio indicates the performance of an investment compared to a risk-free asset after adjusting for its risk. The higher the Sharpe ratio, the better the risk-adjusted performance.
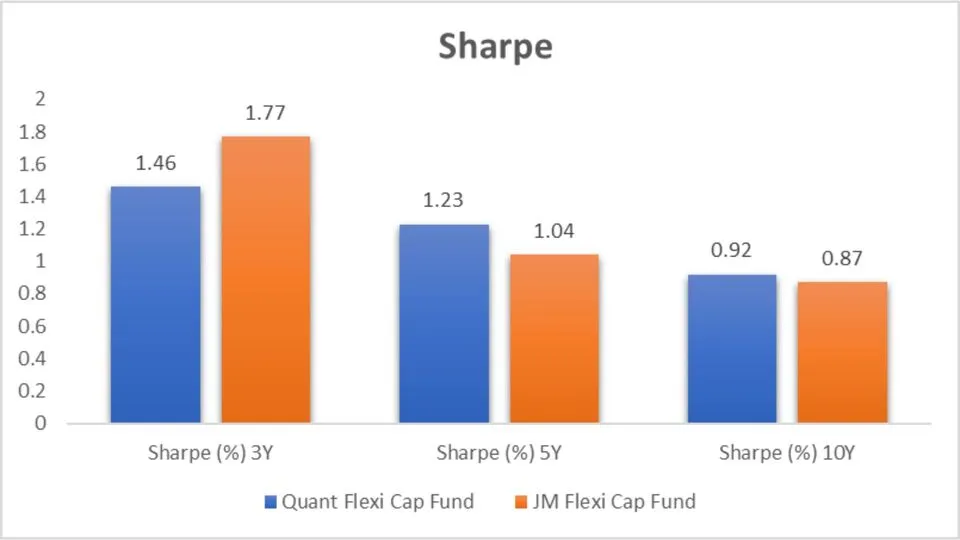
| Fund | Sharpe Ratio 3Y (%) | Sharpe Ratio 5Y (%) | Sharpe Ratio 10Y (%) |
| Quant Flexi Cap Fund | 1.46 | 1.23 | 0.92 |
| JM Flexi Cap Fund | 1.77 | 1.04 | 0.87 |
Analysis
- 3 Years: JM Flexi Cap Fund outperforms with a Sharpe ratio of 1.77 compared to Quant Flexi Cap Fund’s 1.46.
- 5 Years: Quant Flexi Cap Fund leads with 1.23, while JM Flexi Cap Fund scores 1.04.
- 10 Years: Quant Flexi Cap Fund maintains a slight edge with 0.92 over JM Flexi Cap Fund’s 0.87.
Key Takeaways
- Short-Term (3 years): JM Flexi Cap Fund demonstrates better risk-adjusted performance, making it a more attractive option for short-term investors seeking higher returns relative to risk.
- Medium-Term (5 years): Quant Flexi Cap Fund leads in risk-adjusted returns, suggesting it is a better choice for investors with a medium-term outlook.
- Long-Term (10 years): Quant Flexi Cap Fund has a slight advantage in long-term risk-adjusted performance, indicating consistent and stable returns over a decade
Beta Analysis
Beta measures the instability of a fund in the market. A beta lower than 1 indicates lower impulsiveness than the market, while a beta higher than 1 indicates higher volatility.
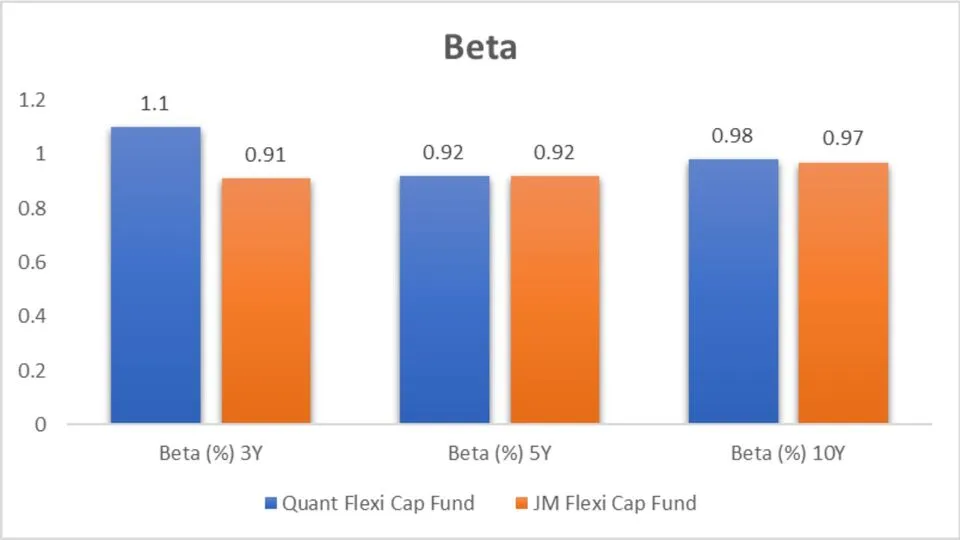
| Fund | Beta 3Y (%) | Beta 5Y (%) | Beta 10Y (%) |
| Quant Flexi Cap Fund | 1.1 | 0.92 | 0.98 |
| JM Flexi Cap Fund | 0.91 | 0.92 | 0.97 |
Analysis
- 3 Years: JM Flexi Cap Fund has a lower beta of 0.91, indicating lower volatility than Quant Flexi Cap Fund’s 1.1.
- 5 Years: Both funds have the exact beta of 0.92.
- 10 Years: JM Flexi Cap Fund slightly outperforms with a beta of 0.97 compared to 0.98 for Quant Flexi Cap Fund.
Key Takeaways
- Beta: JM Flexi Cap Fund generally has lower volatility.
- Short-Term (3 years): JM Flexi Cap Fund demonstrates lower volatility, making it a safer option for risk-averse investors over the short term.
- Medium-Term (5 years): Both funds show equal volatility, indicating similar market sensitivity and risk for medium-term investments.
- Long-Term (10 years): JM Flexi Cap Fund has a slight advantage in terms of lower long-term volatility, making it marginally more stable than Quant Flexi Cap Fund.
Alpha Analysis
Alpha measures the performance of a fund compared to a market index. A positive alpha indicates outperformance, while a negative alpha indicates underperformance.

| Index | Alpha 3Y (%) | Alpha 5Y (%) | Alpha 10Y (%) |
| NIFTY 500 | |||
| Quant Flexi Cap Fund | 14.41 | 13.2 | 10.9 |
| JM Flexi Cap Fund | 8.41 | 6.1 | 6.2 |
Analysis
- 3 Years: Quant Flexi Cap Fund outperforms significantly with an alpha of 14.41 compared to JM Flexi Cap Fund’s 8.41.
- 5 Years: Quant Flexi Cap Fund leads with 13.2 over JM Flexi Cap Fund’s 6.1.
- 10 Years: Quant Flexi Cap Fund continues to outperform with 10.9 compared to JM Flexi Cap Fund’s 6.2.
Key Takeaways
- Alpha: Quant Flexi Cap Fund consistently outperforms the market, showing higher alpha across all periods.
- Short-Term (3 years): Quant Flexi Cap Fund demonstrates significant outperformance with a much higher alpha, making it an excellent choice for short-term investors seeking superior returns.
- Medium-Term (5 years): Quant Flexi Cap Fund continues to lead with higher alpha, indicating consistent and strong performance relative to the market index over the medium term.
- Long-Term (10 years): Quant Flexi Cap Fund maintains a significant lead with a higher alpha, showcasing its ability to deliver superior long-term performance.
Portfolio Analysis
Portfolio Overlapping Comparison
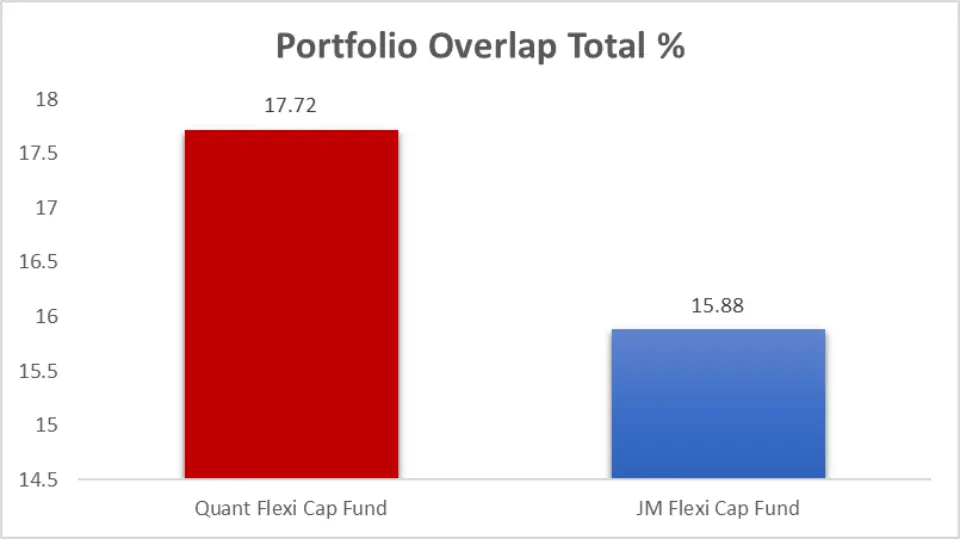
| Fund | Portfolio Overlap Total % |
| Quant Flexi Cap Fund | 17.72 |
| JM Flexi Cap Fund | 15.88 |
Analysis
- Portfolio Overlap: Quant Flexi Cap Fund has a higher portfolio overlap at 17.72% compared to JM Flexi Cap Fund’s 15.88%.
Key Takeaways
- Quant Flexi Cap Fund: The higher portfolio overlap indicates a more concentrated investment strategy, potentially leading to higher returns and greater volatility.
- JM Flexi Cap Fund: The slightly lower portfolio overlap suggests a more diversified approach, which may result in more stable performance with reduced risk.
Portfolio Composition

| Asset Class | Quant Flexi Cap Fund | JM Flexi Cap Fund Portfolio |
| Equity | 98.47% | 98.64% |
| Debt | 4.83% | 0.00% |
| Cash & Cash Equivalents | -3.27% | 1.36% |
Analysis
- Equity: Both funds have a high equity allocation, with JM Flexi Cap Fund slightly higher at 98.64%.
- Debt: Quant Flexi Cap Fund holds 4.83% in debt, whereas JM Flexi Cap Fund holds none.
- Cash & Cash Equivalents: Quant Flexi Cap Fund shows a negative cash balance, possibly indicating leverage or short positions, while JM Flexi Cap Fund holds 1.36%.
Key Takeaways
- High Equity Focus: Both funds prioritize equity investments, reflecting a growth-oriented strategy.
- Debt and Diversification: Quant Flexi Cap Fund includes a small allocation to debt, offering some diversification, whereas JM Flexi Cap Fund remains fully invested in equities, indicating higher risk and return potential.
- Cash Position: Quant Flexi Cap Fund’s negative cash balance indicates a leveraged approach. JM Flexi Cap Fund maintains a favourable cash position for stability and liquidity.
Market Cap Allocation

| Metric | Quant Flexi Cap Fund | JM Flexi Cap Fund Portfolio |
| No of Stocks | 46 | 56 |
| Large Cap (%) | 56.82% | 51.72% |
| Mid Cap (%) | 15.90% | 14.72% |
| Small Cap (%) | 16.65% | 32.65% |
| Others (%) | 10.63% | 1.11% |
| Foreign Equity Holdings |
Analysis
- No of Stocks: JM Flexi Cap Fund has a more diversified portfolio with 56 stocks than 46 in Quant Flexi Cap Fund.
- Large Cap: Quant Flexi Cap Fund has a higher allocation to large caps at 56.82%.
- Mid Cap: Both funds have a similar mid-cap allocation.
- Small Cap: JM Flexi Cap Fund has a significantly higher small cap allocation at 32.65% compared to 16.65% for Quant Flexi Cap Fund.
Key Takeaways
- Diversification: JM Flexi Cap Fund has a more diversified portfolio with more stocks, reducing individual stock risk.
- Significant Cap Focus: Quant Flexi Cap Fund focuses more on large-cap stocks, offering stability and consistent returns.
- Mid-Cap Balance: Both funds maintain a balanced approach to mid-cap stocks, offering growth with moderate risk.
- Slight Cap Aggressiveness: JM Flexi Cap Fund’s higher small-cap allocation indicates a more aggressive growth strategy with higher potential returns and risk.
- Alternative Investments: Quant Flexi Cap Fund’s allocation to other categories suggests additional diversification.
Sector Allocation
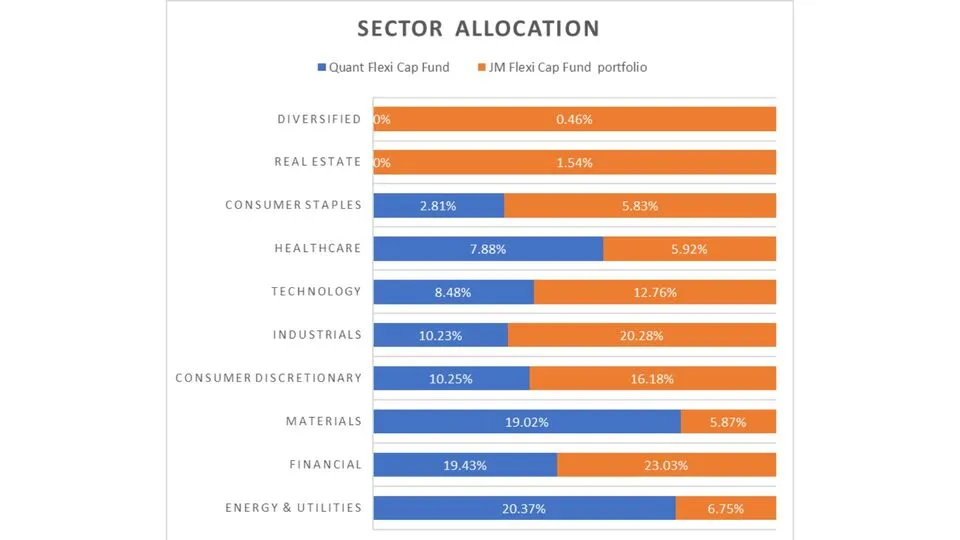
| Sector | Quant Flexi Cap Fund | JM Flexi Cap Fund Portfolio |
| Energy & Utilities | 20.37% | 6.75% |
| Financial | 19.43% | 23.03% |
| Materials | 19.02% | 5.87% |
| Consumer Discretionary | 10.25% | 16.18% |
| Industrials | 10.23% | 20.28% |
| Technology | 8.48% | 12.76% |
| Healthcare | 7.88% | 5.92% |
| Consumer Staples | 2.81% | 5.83% |
| Real Estate | NA | 1.54% |
| Diversified | NA | 0.46% |
Analysis
- Energy & Utilities: Quant Flexi Cap Fund has a higher allocation at 20.37%.
- Financial: JM Flexi Cap Fund leads with 23.03%.
- Materials: Quant Flexi Cap Fund allocates more to materials at 19.02%.
- Consumer Discretionary and Industrials: JM Flexi Cap Fund has higher allocations in these sectors.
- Technology: JM Flexi Cap Fund leads with 12.76%.
Key Takeaways
- Energy & Utilities: Quant Flexi Cap Fund has a strong focus, potentially benefiting from energy sector growth.
- Financial: JM Flexi Cap Fund emphasizes financial services, which can thrive during economic expansion.
- Materials: Quant Flexi Cap Fund targets the materials sector, benefiting from industrial growth.
- Consumer Discretionary and Industrials: JM Flexi Cap Fund focuses on consumer and industrial growth, indicating a strategy for robust economic conditions.
- Technology: JM Flexi Cap Fund’s higher tech allocation suggests a focus on innovation and growth potential.
- Healthcare: Quant Flexi Cap Fund’s allocation provides stability and growth opportunities in health-related industries.
- Consumer Staples: JM Flexi Cap Fund provides stability through essential goods and services.
Fund Management Comparison
Fund managers’ experience and stability can significantly impact a mutual fund’s performance. Here’s a look at the fund managers for both funds:
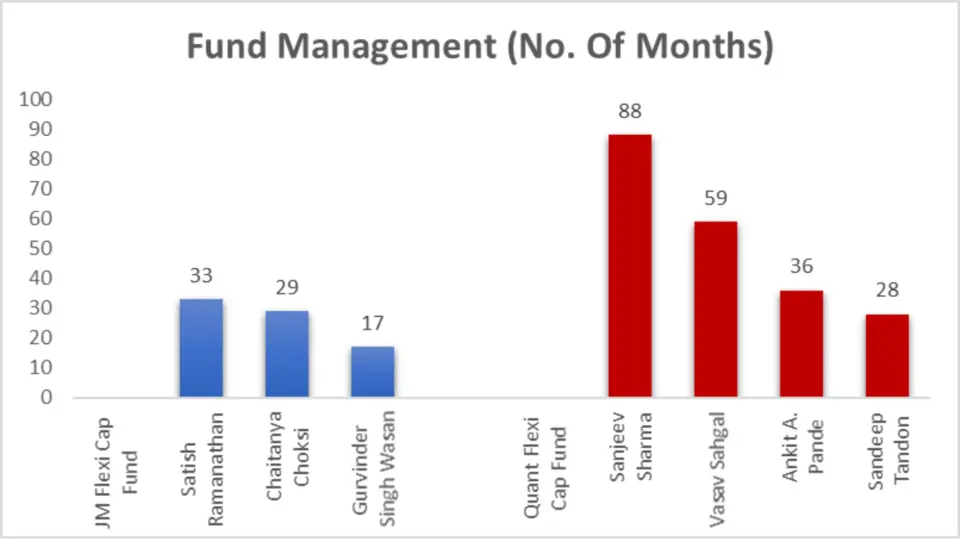
| Fund | Fund Manager | No. of Months |
| JM Flexi Cap Fund | Satish Ramanathan | 33 |
| Chaitanya Choksi | 29 | |
| Gurvinder Singh Wasan | 17 | |
| Quant Flexi Cap Fund | Sanjeev Sharma | 88 |
| Vasav Sahgal | 59 | |
| Ankit A. Pande | 36 | |
| Sandeep Tandon | 28 |
Analysis
- JM Flexi Cap Fund has three fund managers with varying tenures, providing a blend of experience and fresh perspectives.
- Quant Flexi Cap Fund is managed by four fund managers with significant experience, particularly Sanjeev Sharma, who has 88 months of tenure.
Key Takeaways
- Diverse Management Team: JM Flexi Cap Fund benefits from a diverse management team with different levels of experience, fostering innovation and adaptability.
- Experienced Leadership: Quant Flexi Cap Fund is led by a highly skilled team, especially with Sanjeev Sharma’s extensive tenure, providing stability and consistent fund management.
Other Important General Details
Understanding the funds’ general details can help make a well-informed investment decision.
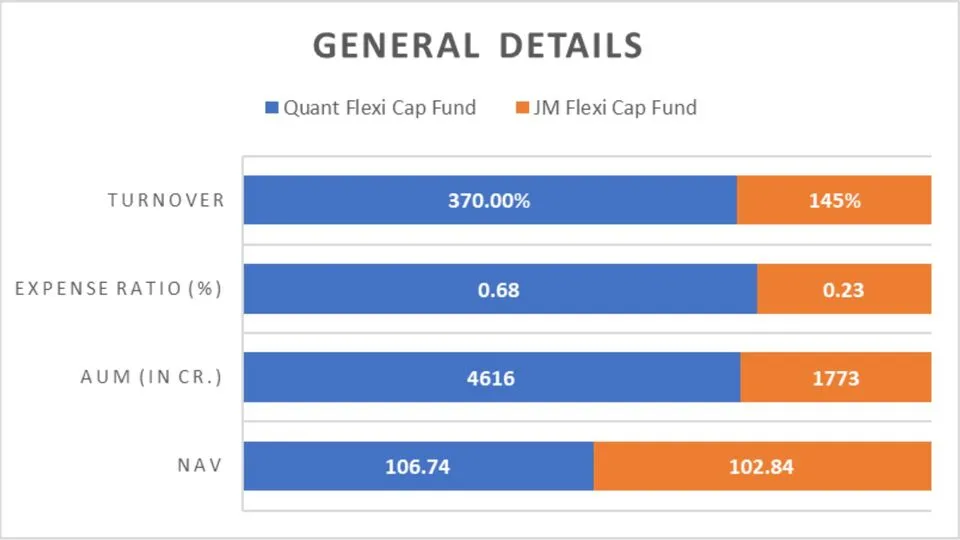
| Metric | Quant Flexi Cap Fund | JM Flexi Cap Fund |
| NAV | 106.74 | 102.84 |
| AUM (in Cr.) | 4616 | 1773 |
| Expense Ratio (%) | 0.68 | 0.23 |
| Turnover (%) | 370.00% | 145% |
| Benchmark | NIFTY 50 | NIFTY 500 |
Analysis
- NAV: Quant Flexi Cap Fund has a higher NAV at 106.74.
- AUM: Quant Flexi Cap Fund has a significantly larger AUM, indicating higher investor confidence.
- Expense Ratio: JM Flexi Cap Fund has a lower expense ratio of 0.23%, making it more cost-effective.
- Turnover: Quant Flexi Cap Fund has a higher turnover, indicating a more active management strategy.
- Benchmark: Both funds use different benchmarks, reflecting their distinct investment strategies.
Key Takeaways
- Higher NAV: Quant Flexi Cap Fund’s higher NAV indicates potentially higher per-unit valuation.
- More significant AUM: Quant Flexi Cap Fund’s larger AUM suggests higher investor confidence and a more substantial market presence.
- Cost-Effectiveness: JM Flexi Cap Fund’s lower expense ratio makes it more cost-effective for investors.
- Active Management: Quant Flexi Cap Fund’s higher turnover ratio indicates a more active management approach.
- Distinct Benchmarks: The different benchmarks reflect the distinct investment strategies of each fund.
Minimum Investment Amount
Here’s a look at the minimum investment requirements for both SIP and lump sum investments:

| Investment Type | Quant Flexi Cap Fund | JM Flexi Cap Fund |
| SIP | ₹1,000 | ₹100 |
| Lumpsum | ₹5,000 | ₹1,000 |
Analysis
- SIP: JM Flexi Cap Fund is more accessible with a lower SIP requirement of ₹100.
- Lumpsum: JM Flexi Cap Fund requires a lower initial lump sum investment of ₹1,000.
Key Takeaways
- Accessibility: JM Flexi Cap Fund offers greater accessibility with lower minimum investment amounts for SIP and lump sum investments.
- Investment Flexibility: The lower requirements make JM Flexi Cap Fund a more flexible option for new and small-scale investors looking to start with smaller investments.
Conclusion
The Quant Flexi Cap Fund and the JM Flexi Cap Fund have distinct strengths catering to different investor preferences. The Quant Flexi Cap Fund generally offers higher long-term returns, making it ideal for investors seeking substantial growth and tolerating higher volatility. It excels in long-term SIP returns, CAGR, rolling returns, and alpha generation. It has a more extensive fund management team with significant experience.
On the other hand, the JM Flexi Cap Fund is better suited for those looking for consistent short-term performance and better risk-adjusted returns, as indicated by its lower beta, higher Sharpe and Sortino ratios, and a more cost-effective expense ratio. Its lower minimum investment requirements make it more accessible for new investors.
Ultimately, the Quant Flexi Cap Fund is a superior choice if you prioritize long-term growth and can handle volatility. However, suppose you prefer steady performance with lower risk and easier entry points. The JM Flexi Cap Fund might be the better option in that case.

We hope you found this guide on mutual funds helpful.
If you have any mutual fund-related queries, feel free to comment below—we’re here to help! S.K. Singh, a registered professional with the Association of Mutual Funds in India (AMFI), will answer your queries and holds the ARN-251149.
Invest wisely!
FAQs- Quant Flexi Cap Fund vs JM Flexi Cap Fund
What is the main difference in investment style between Quant Flexi Cap Fund and JM Flexi Cap Fund?
The Quant Flexi Cap Fund follows a Value investment style, focusing on stocks that are undervalued compared to their intrinsic worth. On the other hand, the JM Flexi Cap Fund follows a Growth investment style, targeting stocks with solid growth potential and high future returns.
Which fund has performed better in the short term?
In the short term, the JM Flexi Cap Fund generally outperforms, especially in 1-year and 3-year SIP returns. For example, over 1 year, JM Flexi Cap Fund delivered a 62.37% return compared to Quant Flexi Cap Fund’s 59.36%.
Which fund offers better long-term returns?
The Quant Flexi Cap Fund dominates in long-term performance. Over 10 years, it delivered a return of 25.26%, while JM Flexi Cap Fund provided a return of 21.70%. Similarly, it shows superior results in 5-year SIP investment values and CAGR.
How do the funds compare in terms of risk-adjusted returns?
JM Flexi Cap Fund exhibits better risk-adjusted returns as indicated by higher Sharpe and Sortino ratios over 3 years. For instance, its Sortino Ratio is 3.8 compared to Quant Flexi Cap Fund’s 2.69, suggesting better performance relative to downside risk.
Which fund is more volatile?
The Quant Flexi Cap Fund tends to be more volatile than the JM Flexi Cap Fund. This is evident from its higher standard deviation values across 3-year, 5-year, and 10-year periods.
Which fund has a higher expense ratio?
The Quant Flexi Cap Fund has a higher expense ratio of 0.68%, whereas the JM Flexi Cap Fund has a more cost-effective expense ratio of 0.23%.
How do the funds differ in their portfolio composition?
Both funds are heavily equity-focused, but the Quant Flexi Cap Fund includes a small allocation to debt (4.83%) and shows a negative cash balance, indicating possible leverage. However, the JM Flexi Cap Fund has no debt and a small positive cash balance.
Which sectors are the funds most exposed to?
The Quant Flexi Cap Fund has higher exposure to Energy & Utilities (20.37%) and Materials (19.02%), while the JM Flexi Cap Fund leads in Financials (23.03%), Industrials (20.28%) and Technology (12.76%).
Based on different risk appetites, which fund is better suited for investors?
The Quant Flexi Cap Fund is a superior choice for investors seeking higher long-term returns and tolerating higher volatility. Conversely, the JM Flexi Cap Fund is the better option for those preferring more consistent performance with lower risk.
Which fund has outperformed more often in recent quarters?
A10: The JM Flexi Cap Fund has outperformed the Quant Flexi Cap Fund in 9 out of 17 recent quarters, showing a more consistent performance over shorter periods.
How do the funds’ maximum drawdowns compare?
The JM Flexi Cap Fund tends to have a smaller maximum drawdown, indicating lower risk. Over 3 years, it had a drawdown of -8.55% compared to -10.4% for the Quant Flexi Cap Fund.
What is the portfolio overlap between the two funds?
The portfolio overlap between Quant Flexi Cap Fund and JM Flexi Cap Fund is 17.72%, indicating that they share some joint holdings but also have significant differences.
Who manages the Quant Flexi Cap Fund and JM Flexi Cap Fund?
The Quant Flexi Cap Fund is managed by Sanjeev Sharma, Vasav Sahgal, Ankit A. Pande, and Sandeep Tandon. Satish Ramanathan, Chaitanya Choksi, and Gurvinder Singh Wasan manage the JM Flexi Cap Fund.
Disclaimer:
The information provided in this article is solely the author/advertisers’ opinion and not investment advice – it is provided for educational purposes only. Using this, you agree that the information does not constitute any investment or financial instructions by Ace Equity Research/Mutual Fund Focus/IPO First and the team. Anyone wishing to invest should seek their own independent financial or professional advice. Conduct your research with registered financial advisors before making any investment decisions. Ace Equity Research/ Mutual Fund Focus / IPO First and the team are not accountable for the investment views provided in the article.
Mutual Fund investments are subject to market risks. Read all scheme-related documents carefully.
Investments in the securities market are subject to market risks. Read all the related documents carefully before investing.


