Investing in focused mutual funds can be an excellent way to enhance your portfolio, especially if you’re keen on targeting specific sectors or companies. But with so many options out there, how do you choose the right one? Today, we’re diving into a comprehensive comparison of two popular focused funds: Quant Focused Fund vs JM Focused Fund. This analysis will give you all the insights you need to make an informed decision and select the best Fund for your long-term investment strategy.
Investment Strategy
A growth strategy emphasizes investing in companies expected to grow exponentially compared to other companies. This typically involves investing in equities of companies that are in their expansion phase, reinvesting their profits into the business rather than paying dividends. While growth funds can be more volatile, they also have the potential for higher returns.
- Quant Focused Fund and JM Focused Fund both fall into this category, making them suitable for investors with a higher risk acceptance and a long-term investment horizon.

Returns Analysis
Trailing Returns

| Period Invested For | Quant Focused Fund | JM Focused Fund |
| 1 Year | 48.79% | 48.87% |
| 2 Year | 34.85% | 34.61% |
| 3 Year | 24.57% | 25.20% |
| 5 Year | 26.90% | 20.65% |
| 10 Year | 20.01% | 16.09% |
Analysis
- 1-Year Return: Both funds have shown remarkable growth in the past year, with JM Focused Fund slightly edging out Quant Focused Fund by a mere 0.08%. This suggests both funds are performing well in the short term, making either a viable option if you want immediate returns.
- 2-Year Return: Over two years, the Quant Focused Fund showed a slight lead of 34.85%, which is just 0.24% higher than the JM Focused Fund. This small margin indicates similar performance, but Quant Focused Fund might have had more consistent returns.
- 3-Year Return: JM Focused Fund takes the lead with 25.20% versus 24.57% for Quant Focused Fund. While the difference is minimal, it’s essential to note that JM Focused Fund may have had a better selection or market timing during this period.
- 5-Year Return: The Quant Focused Fund shines here with a significant 26.90% return compared to JM Focused Fund‘s 20.65%. This 6.25% gap suggests that a focused Fund may be a better choice for medium-term investments.
- 10-Year Return: When looking at the long-term horizon, Quant Focused Fund again outperforms with 20.01% compared to JM Focused Fund‘s 16.09%. Over a decade, this difference could lead to substantially higher returns, making Quant Focused Fund a potentially better option for long-term growth.
Key Takeaways:
- Short-Term (1 Year): Both funds perform similarly, with JM Focused Fund slightly ahead.
- Medium-Term (2-3 Years): The funds show comparable performance, with JM Focused Fund leading in the 3 years.
- Long-Term (5-10 Years): Quant Focused Fund clearly outperforms, making it the better choice for long-term investors seeking sustained growth.]
Lumpsum Investment Value
| Period Invested For | Quant Focused Fund | JM Focused Fund |
| 1 Year | ₹14,895.2 | ₹14,903.6 |
| 2 Year | ₹18,230.2 | ₹18,163.1 |
| 3 Year | ₹19,354.9 | ₹19,651.1 |
| 5 Year | ₹32,953.5 | ₹25,595.8 |
| 10 Year | ₹62,087 | ₹44,520.6 |
Analysis
- 1-Year Investment: Both funds would have nearly identical investment values, with JM Focused Fund slightly ahead by just ₹8.4. This indicates that either Fund could serve well for short-term investments, though the difference is negligible.
- 2-Year Investment: Quant Focused Fund edges out JM Focused Fund by ₹67.1, suggesting that Quant might have had a slightly more consistent performance over this period.
- 3-Year Investment: JM Focused Fund outperforms Quant Focused Fund by ₹296.2, indicating that in the mid-term, JM Focused Fund might have better capitalized on specific market conditions.
- 5-Year Investment: Quant Focused Fund shows a clear advantage with ₹32,953.5 compared to ₹25,595.8 for JM Focused Fund. This significant difference underscores Quant Focused Fund‘s strength in generating consistent returns over a medium-term horizon.
- 10-Year Investment: Over the long haul, Quant Focused Fund would have given you ₹17,566.4 more than JM Focused Fund, which is a substantial difference for long-term investors.
Key Takeaways:
- Short-Term (1-2 Years): Both funds perform similarly, with the JM Focused Fund having a slight edge over one year. Still, the Quant Focused Fund was pulling ahead over two years.
- Mid-Term (3 Years): The JM Focused Fund takes the lead, making it a better choice for a 3-year lumpsum investment.
- Medium to Long-Term (5-10 Years): The Quant Focused Fund outperforms significantly, particularly in the 5-year and 10-year periods, making it the preferred choice for investors looking to maximize returns over these time frames.
SIP Returns Analysis
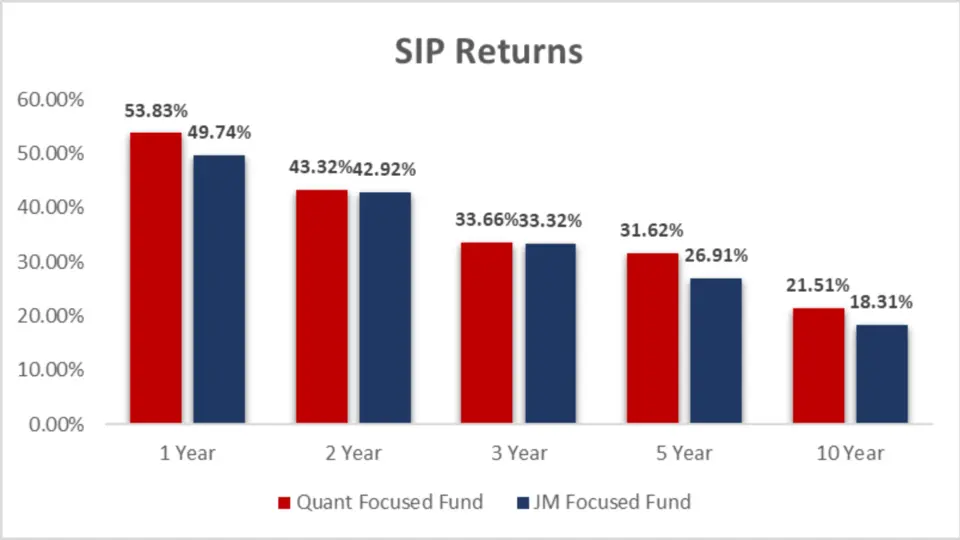
| Period Invested For | Quant Focused Fund | JM Focused Fund |
| 1 Year | 53.83% | 49.74% |
| 2 Year | 43.32% | 42.92% |
| 3 Year | 33.66% | 33.32% |
| 5 Year | 31.62% | 26.91% |
| 10 Year | 21.51% | 18.31% |
Analysis
- 1-Year SIP Return: Quant Focused Fund outperforms with a 53.83% return, slightly ahead of JM Focused Fund‘s 49.74%. This suggests that Quant Focused Fund has been more resilient in the short term.
- 2-Year SIP Return: Both funds show almost identical returns, with Quant Focused Fund at 43.32% and JM Focused Fund at 42.92%. This indicates similar performance, making either Fund a reasonable choice for a 2-year investment.
- 3-Year SIP Return: The performance gap remains narrow, with Quant Focused Fund at 33.66% and JM Focused Fund at 33.32%. This slight difference suggests comparable returns over the 3 years.
- 5-Year SIP Return: Quant Focused Fund begins to pull ahead with a 31.62% return compared to JM Focused Fund‘s 26.91%. This gap indicates that a focused Fund may be more effective in the medium term.
- 10-Year SIP Return: Over a longer horizon, Quant Focused Fund continues to lead with a 21.51% return, while JM Focused Fund trails at 18.31%. This suggests that a focused Fund might be better suited for long-term investors.
Key Takeaways:
- Short-Term (1-2 Years): The Quant-Focused Fund outperforms the JM-Focused Fund, providing better returns for short-term SIP investors.
- Medium-Term (3-5 Years): The gap between the two funds starts to widen, with the Quant-Focused Fund delivering more robust returns, particularly in the 5 years.
- Long-Term (10 Years): The Quant-Focused Fund consistently delivers higher returns over 10 years, making it a better choice for long-term SIP investors looking for maximum growth
SIP Investment Value

| Period Invested For | Investments (₹) | Quant Focused Fund | JM Focused Fund |
| 1 Year | 12,000 | ₹15,257.18 | ₹15,023.18 |
| 2 Year | 24,000 | ₹35,661.28 | ₹35,546.73 |
| 3 Year | 36,000 | ₹58,090.86 | ₹57,829.89 |
| 5 Year | 60,000 | ₹1,30,331.16 | ₹1,16,558.31 |
| 10 Year | 1,20,000 | ₹3,73,691.93 | ₹3,14,428.65 |
Analysis
- 1-Year Investment: After 1 year, a ₹12,000 investment in Quant Focused Fund would have grown to ₹15,257.18, slightly higher than the ₹15,023.18 from JM Focused Fund.
- 2-Year Investment: Over two years, the investment in Quant Focused Fund would be worth ₹35,661.28, slightly ahead of the ₹35,546.73 from JM Focused Fund.
- 3-Year Investment: The difference grows as we look at three years, with Quant Focused Fund returning ₹58,090.86, marginally more than JM Focused Fund at ₹57,829.89.
- 5-Year Investment: Over five years, the gap widens significantly. Quant Focused Fund would have turned ₹60,000 into ₹1,30,331.16, while JM Focused Fund lags at ₹1,16,558.31.
- 10-Year Investment: In the long term, Quant Focused Fund dramatically outperforms, with a ₹1,20,000 investment growing to ₹3,73,691.93, compared to ₹3,14,428.65 for JM Focused Fund.
Key Takeaways:
- Short-Term (1-2 Years): Both funds perform well, but the Quant Focused Fund edges out JM Focused Fund with slightly higher returns.
- Medium-Term (3-5 Years): The Quant-Focused Fund begins to pull ahead significantly, particularly in the 5 years, indicating its strength in generating higher returns over a longer horizon.
- Long-Term (10 Years): The Quant Focused Fund dominates, offering much higher returns than the JM Focused Fund, making it the preferred option for long-term SIP investors.
CAGR (Compounded Annual Growth Rate)
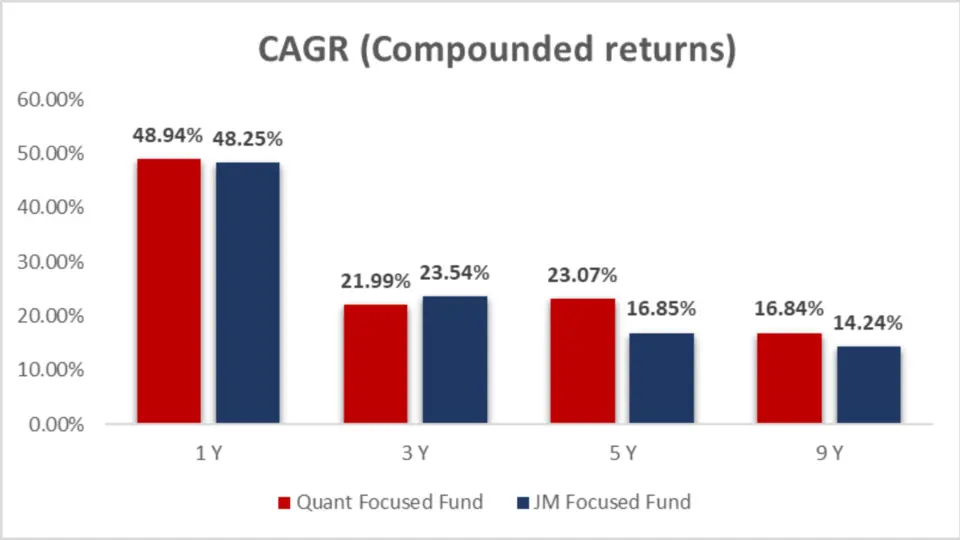
| Category | 1 Y | 3 Y | 5 Y | 9 Y |
| Quant Focused Fund | 48.94% | 21.99% | 23.07% | 16.84% |
| JM Focused Fund | 48.25% | 23.54% | 16.85% | 14.24% |
Analysis
- 1-Year CAGR: Both funds show similar short-term growth, with Quant Focused Fund at 48.94% and JM Focused Fund at 48.25%.
- 3-Year CAGR: Over three years, JM Focused Fund slightly outperforms with 23.54%, compared to 21.99% from Quant Focused Fund.
- 5-Year CAGR: Quant Focused Fund shows a more robust performance with a 23.07% CAGR, significantly higher than JM Focused Fund‘s 16.85%.
- 9-Year CAGR: Long-term growth again favours Quant Focused Fund, which delivers a 16.84% CAGR, compared to 14.24% from JM Focused Fund.
Key Takeaways:
- Short-Term (1-Year): Both funds have delivered impressive short-term gains, with the Quant Focused Fund slightly ahead, making either Fund a solid choice for short-term investors.
- Medium-Term (3-Year): The JM Focused Fund outperforms over three years, indicating its potential to deliver higher returns in the medium term.
- Medium to Long-Term (5-Year and 9-Year): The Quant Focused Fund clearly outshines the JM Focused Fund in these longer horizons, offering better consistency and higher returns, which makes it a more compelling option for investors with a minimum 5 years to long-term investment strategy.
Rolling Returns
Rolling returns provide a better understanding of a fund’s consistency over different time frames. Let’s analyze how these funds have performed in rolling returns.
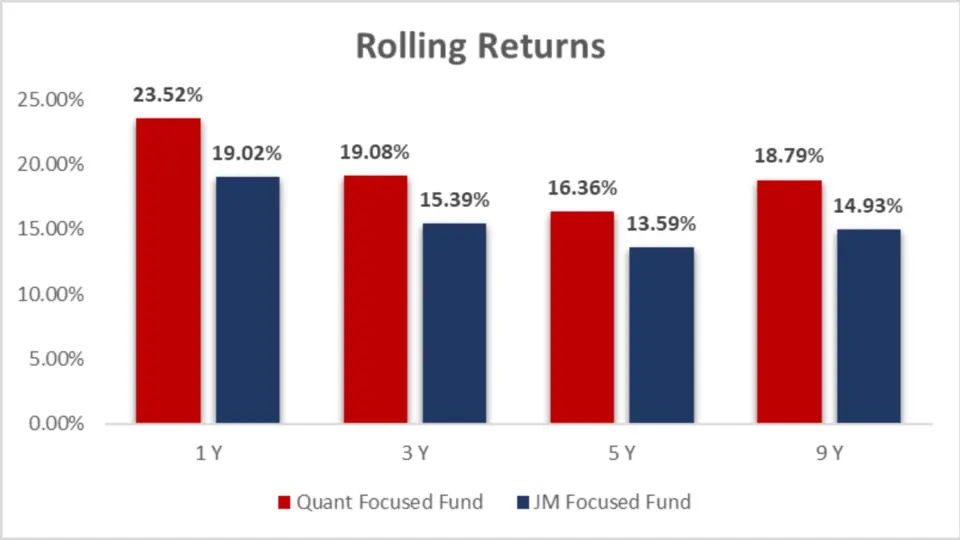
| Category | 1 Y | 3 Y | 5 Y | 9 Y |
| Quant Focused Fund | 23.52% | 19.08% | 16.36% | 18.79% |
| JM Focused Fund | 19.02% | 15.39% | 13.59% | 14.93% |
Analysis
- 1-Year Rolling Return: Quant Focused Fund shows more substantial 1-year rolling returns at 23.52%, ahead of JM Focused Fund‘s 19.02%.
- 3-Year Rolling Return: Quant Focused Fund continues to outperform with 19.08%, compared to JM Focused Fund at 15.39%.
- 5-Year Rolling Return: The trend remains, with Quant Focused Fund showing 16.36% rolling returns, while JM Focused Fund posts 13.59%.
- 9-Year Rolling Return: Quant Focused Fund leads with 18.79% over the long haul versus JM Focused Fund‘s 14.93%.
Key Takeaways
- Quant Focused Fund consistently outperforms JM Focused Fund in rolling returns across multiple time frames, suggesting more reliable performance over time.
Annualized/Calendar Year Returns
Understanding how a fund performs each year can give insights into its consistency and resilience during market fluctuations.
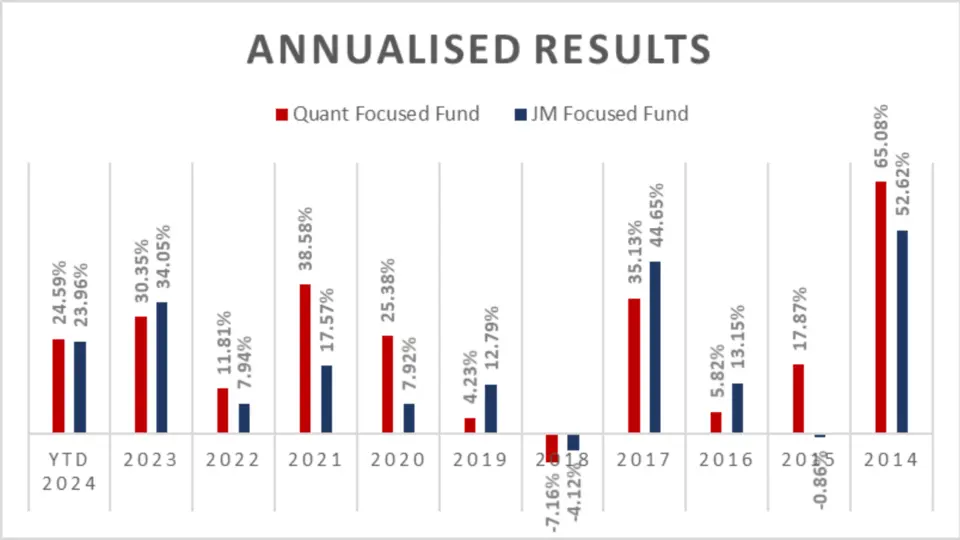
| Period | Quant Focused Fund | JM Focused Fund |
| YTD 2024 | 24.59% | 23.96% |
| 2023 | 30.35% | 34.05% |
| 2022 | 11.81% | 7.94% |
| 2021 | 38.58% | 17.57% |
| 2020 | 25.38% | 7.92% |
| 2019 | 4.23% | 12.79% |
| 2018 | -7.16% | -4.12% |
| 2017 | 35.13% | 44.65% |
| 2016 | 5.82% | 13.15% |
| 2015 | 17.87% | -0.86% |
| 2014 | 65.08% | 52.62% |
Analysis
- YTD 2024: Both funds are performing well, with Quant Focused Fund slightly ahead at 24.59% compared to JM Focused Fund‘s 23.96%.
- 2023: JM Focused Fund outperformed with 34.05% compared to Quant Focused Fund‘s 30.35%.
- 2022: Quant Focused Fund led with 11.81%, outshining JM Focused Fund at 7.94%.
- 2021: A strong year for Quant Focused Fund with 38.58%, compared to JM Focused Fund‘s 17.57%.
- 2020: The trend continues with Quant Focused Fund at 25.38%, well ahead of JM Focused Fund‘s 7.92%.
- Total Return (2014-2024): Quant Focused Fund leads with a 251.68% total return, surpassing JM Focused Fund‘s 209.67%.
- Average Return (2014-2024): Quant Focused Fund holds a higher average return at 22.88%, compared to JM Focused Fund‘s 19.06%.
Key Takeaways
- Quant Focused Funds have generally delivered more consistent and higher returns over the years, especially during periods of strong market performance.
- JM Focused Fund has had its share of solid years, particularly in 2017 and 2019, showing that it can outperform when market conditions align with its strategy.
- Risk Management: Quant Focused Fund manages downside risks better in challenging years, as seen in 2022 and 2020, while JM Focused Fund had better risk management in 2018.
Best Quarters
| Period | Quant Focused Fund | JM Focused Fund |
| Q2 – 2020 | 27.98% | 18.58% |
| Q4 – 2020 | 22.13% | 27.22% |
Analysis
- Q2 2020: Quant Focused Fund shined with 27.98% returns, outperforming JM Focused Fund.
- Q4 2020: However, JM Focused Fund took the lead with 27.22%, ahead of Quant Focused Fund‘s 22.13%.
Key Takeaways:
- Q2 2020: Quant Focused Fund demonstrated superior performance during the initial recovery phase of the market, indicating a strong ability to navigate sharp rebounds.
- Q4 2020: JM Focused Fund took the lead in the year’s final quarter, suggesting it may have been better at capturing gains during the continued market rally.
Worst Quarters
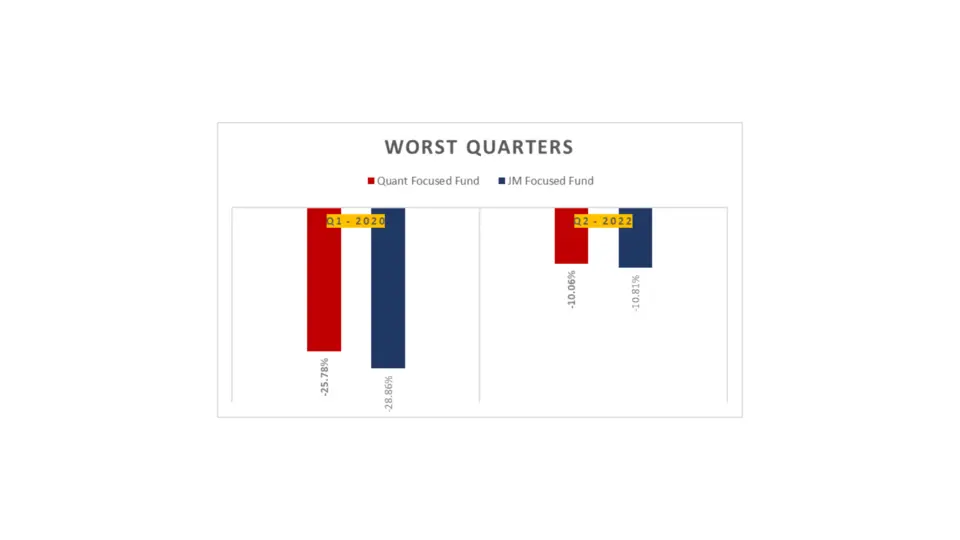
| Period | Quant Focused Fund | JM Focused Fund |
| Q1 – 2020 | -25.78% | -28.86% |
| Q2 – 2022 | -10.06% | -10.81% |
Analysis
- Q1 2020: Both funds suffered, but the Quant Focused Fund experienced a slightly less decline at -25.78%, compared to the JM Focused Fund at -28.86%.
- Q2 2022: Quant Focused Fund again showed resilience with a -10.06% drop, slightly better than JM Focused Fund‘s -10.81%.
Key Takeaways:
- Q1 2020: Quant Focused Fund exhibited better downside protection during the market crash caused by the pandemic, with a smaller decline than JM Focused Fund.
- Q2 2022: Both funds faced significant drops, but Quant Focused Fund again managed to limit losses more effectively, reinforcing its relative strength during market downturns
Maximum Drawdown
Understanding the maximum drawdown helps investors gauge the risk and potential loss they might face. Here’s how both funds compare:

Analysis
| Period | 3-Year | 5-Year |
| Quant Focused Fund | -10.46% | -28.65% |
| JM Focused Fund | -12.84% | -30.58% |
Analysis
- 3-Year Maximum Drawdown: Quant Focused Fund shows a lower drawdown of -10.46%, compared to JM Focused Fund at -12.84%.
- 5-Year Maximum Drawdown: Quant Focused Fund has performed better over five years with -28.65%, while JM Focused Fund shows a more significant drawdown of -30.58%.
Key Takeaways:
- 3-Year Maximum Drawdown: The Quant Focused Fund demonstrated superior performance with a smaller drawdown, indicating better protection against short-term market volatility.
- 5-Year Maximum Drawdown: Over a longer time frame, the Quant Focused Fund continued to perform better with a lower drawdown, suggesting a more consistent and stable approach to risk management
Quarterly Results

| Period | Quant Focused Fund | JM Focused Fund |
| Q2 – 2024 | 7.47% | 11.91% |
| Q1 – 2024 | 9.86% | 6.96% |
| Q4 – 2023 | 15.88% | 11.68% |
| Q3 – 2023 | 7.08% | 9.32% |
| Q2 – 2023 | 12.49% | 14.98% |
| Q1 – 2023 | -6.63% | -4.50% |
| Q4 – 2022 | 5.29% | 7.24% |
| Q3 – 2022 | 14.75% | 10.87% |
| Q2 – 2022 | -10.06% | -10.81% |
| Q1 – 2022 | 2.41% | 0.43% |
| Q4 – 2021 | 2.04% | -0.62% |
| Q3 – 2021 | 7.44% | 12.88% |
| Q2 – 2021 | 9.84% | 3.59% |
| Q1 – 2021 | 12.52% | 0.84% |
| Q4 – 2020 | 22.13% | 27.22% |
| Q3 – 2020 | 8.83% | 1.62% |
| Q2 – 2020 | 27.98% | 18.58% |
| Q1 – 2020 | -25.78% | -28.86% |
| Q4 – 2019 | 3.08% | 2.61% |
| Q3 – 2019 | -2.13% | 0.91% |
| Q2 – 2019 | 1.38% | -2.40% |
| Q1 – 2019 | 1.00% | 11.25% |
| Q4 – 2018 | -1.17% | 4.66% |
| Q3 – 2018 | 0.44% | -4.79% |
| Q2 – 2018 | -0.29% | 1.19% |
| Q1 – 2018 | -6.43% | -4.90% |
| Q4 – 2017 | 11.73% | 4.63% |
| Q3 – 2017 | 6.11% | 11.10% |
| Q2 – 2017 | 2.23% | 4.93% |
| Q1 – 2017 | 11.50% | 18.49% |
| Q4 – 2016 | -2.56% | -10.35% |
| Q3 – 2016 | 4.57% | 13.95% |
Key Takeaways:
- Consistency: Both funds have had periods of outperformance and underperformance. Quant Focused Fund consistently delivers higher returns, particularly in market recovery or growth periods.
- Volatility Handling: JM Focused Fund demonstrated the ability to capitalize on specific market conditions. Still, it also faced more significant losses in certain quarters, indicating higher volatility than Quant Focused Fund.
- Investment Strategy: The variation in quarterly returns suggests that the funds may have different investment strategies, with Quant Focused Fund possibly taking a more balanced approach. At the same time, JM-focused funds may focus on higher-risk, higher-reward opportunities.
- 7 for Quant Focused Fund.


Risk Analysis

| Metric | Quant Focused Fund | JM Focused Fund |
| Mean Return (%) | 23.16 | 23.51 |
| Sortino Ratio (%) | 2.09 | 2.38 |
| Treynor’s Ratio (%) | 0.14 | 0.15 |
Key Takeaways:
- Return vs. Risk:While both funds offer similar mean returns, JM Focused Fund slightly outperforms in terms of risk-adjusted returns, as indicated by its higher Sortino and Treynor’s Ratios.
- Downside Risk Management:JM Focused Fund’s higher Sortino Ratio suggests it has managed downside risk better than Quant Focused Fund, making it a potentially safer choice during market downturns.
- Market Risk Compensation:The slightly higher Treynor’s Ratio of JM Focused Fund indicates better compensation for market risk, which might appeal to investors looking for higher returns compared to the risk taken.
Standard Deviation
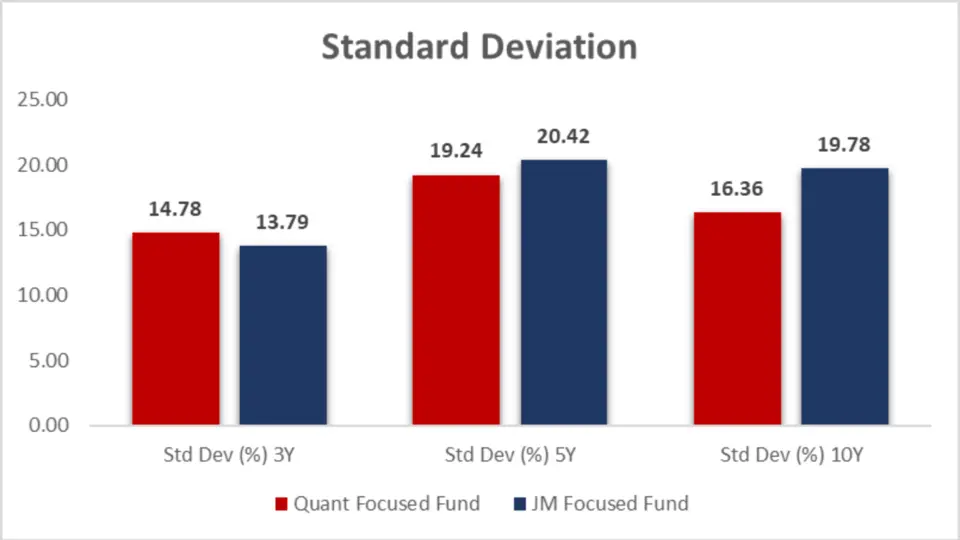
| Metric | Quant Focused Fund | JM Focused Fund |
| Std Dev (%) 3Y | 14.78 | 13.79 |
| Std Dev (%) 5Y | 19.24 | 20.42 |
| Std Dev (%) 10Y | 16.36 | 19.78 |
Key Takeaways:
- Short-Term (3 Years): The JM Focused Fund is slightly less volatile, making it a safer short-term investment.
- Medium-Term (5 Years): The Quant-Focused Fund shows lower volatility, indicating a better balance of risk and potential returns for medium-term investors.
- Long-Term (10 Years): The Quant-Focused Fund has significantly lower impulsiveness, making it a more stable investment option for long-term (Over 5 years) investors looking for steady growth with fewer fluctuations.
Sharpe Ratio
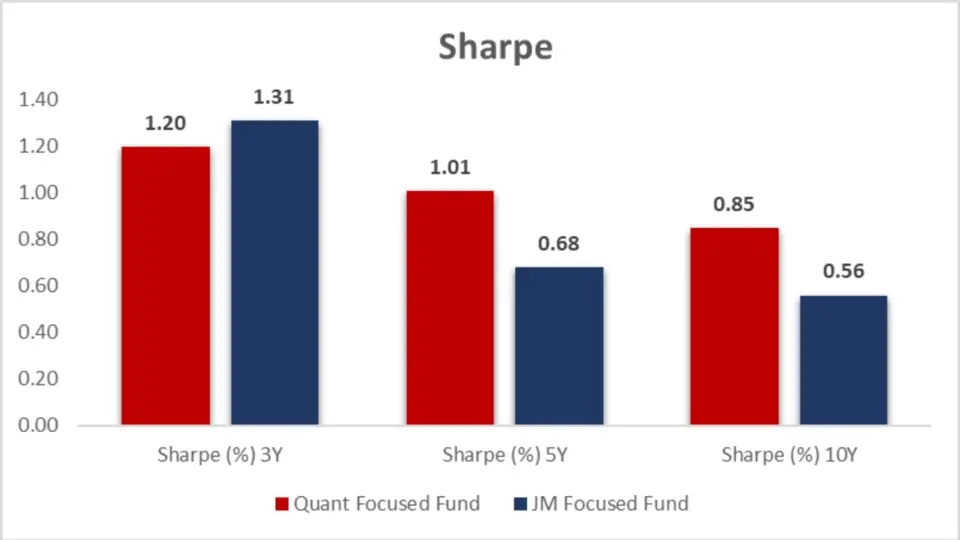
| Metric | Quant Focused Fund | JM Focused Fund |
| Sharpe (%) 3Y | 1.20 | 1.31 |
| Sharpe (%) 5Y | 1.01 | 0.68 |
| Sharpe (%) 10Y | 0.85 | 0.56 |
Key Takeaways:
- Short-Term (3 Years): The JM Focused Fund offers slightly better risk-adjusted returns, making it a strong contender for those with a shorter investment horizon.
- Medium-Term (5 Years): The Quant-Focused Fund outperforms, providing more efficient returns per unit of risk. This makes it a better choice for investors looking at a 5-year investment period.
- Long-Term (10 Years): The Quant-Focused Fund continues to lead, with significantly better risk-adjusted returns over a decade, making it the preferred option for long-term investors.
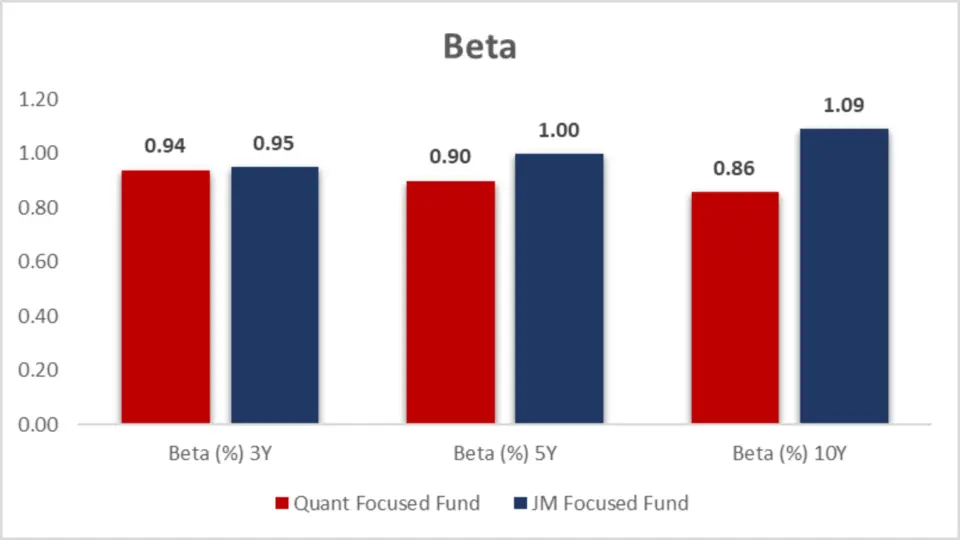
Beta

| Metric | Quant Focused Fund | JM Focused Fund |
| Beta (%) 3Y | 0.94 | 0.95 |
| Beta (%) 5Y | 0.90 | 1.00 |
| Beta (%) 10Y | 0.86 | 1.09 |
Key Takeaways:
Higher Volatility: The JM Focused Fund, with a Beta equal to or greater than 1 over the medium to long term, may appeal to investors with a higher risk tolerance who seek higher returns in exchange for accepting greater market-related volatility.
Lower Volatility: The Quant-Focused Fund consistently shows lower Beta values across all periods, making it a more attractive option for risk-averse investors who prefer a fund with less sensitivity to market fluctuations.
Alpha
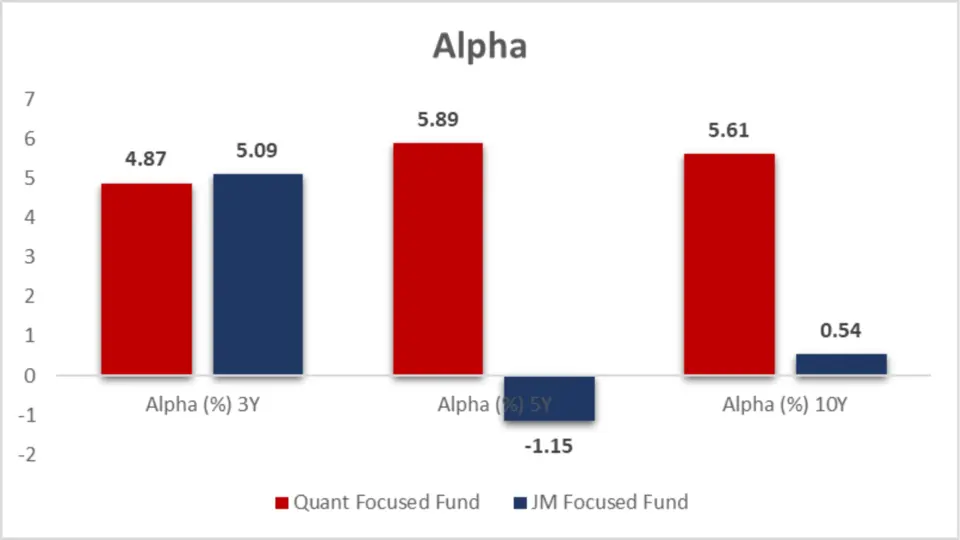
| Metric | Quant Focused Fund | JM Focused Fund |
| Alpha (%) 3Y | 4.87 | 5.09 |
| Alpha (%) 5Y | 5.89 | -1.15 |
| Alpha (%) 10Y | 5.61 | 0.54 |
Key Takeaways:
- 3-Year Performance: Both funds have outperformed their benchmarks over the past three years, with JM Focused Fund showing a slight edge in Alpha. This indicates recent solid performance by both funds, though JM Focused Fund leads by a small margin.
- 5-Year Performance: Quant Focused Fund clearly outshines JM Focused Fund in the 5 years, with a strong positive Alpha versus a negative Alpha for JM Focused Fund.
- 10-Year Performance: Quant Focused Fund’s consistently high Alpha over 10 years highlights its long-term success in outperforming its benchmark. JM Focused Fund’s much lower Alpha suggests that it has struggled to generate significant excess returns over the long haul.
Ratings
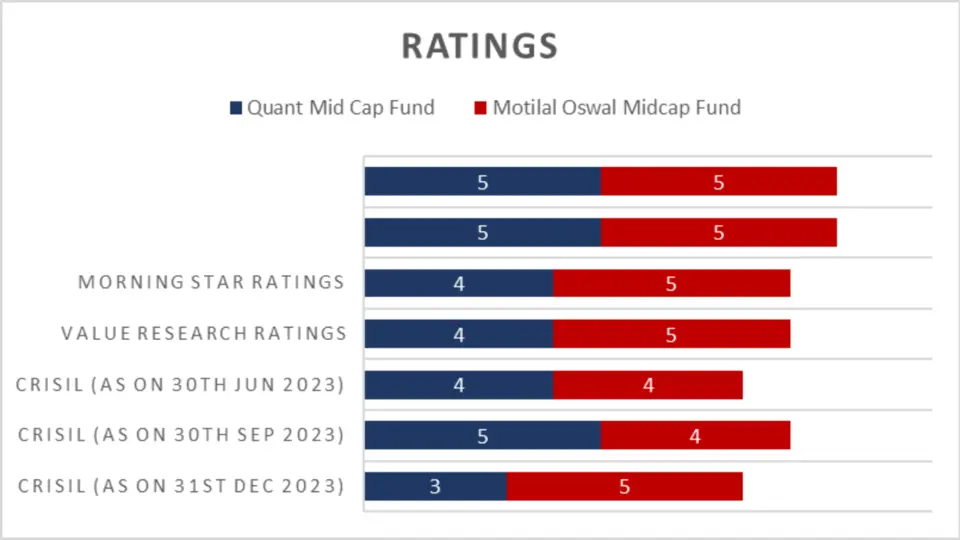
| Rating Agency | Quant Focused Fund | JM Focused Fund |
| CRISIL (31st Mar 2024) | 4 | 4 |
| CRISIL (31st Dec 2023) | 4 | 4 |
| CRISIL (30th Sep 2023) | 3 | 5 |
| CRISIL (30th Jun 2023) | 3 | 4 |
| CRISIL (31st Mar 2023) | 4 | 3 |
| Value Research | 5 | 4 |
| Morning Star | 5 | 3 |
Key Takeaways:
- CRISIL Ratings: Both funds have consistently received high ratings. However, JM Focused Fund has occasionally outperformed, as seen in the 5-star rating in September 2023. However, Quant Focused Fund has demonstrated steadier performance, generally maintaining ratings between 3 and 4 stars.
- Value Research and Morning Star Ratings: Both independent research firms rate Quant Focused Fund more favourably, with 5-star ratings, compared to JM Focused Fund’s lower 4-star and 3-star ratings. This indicates that a focused Fund is generally perceived as a stronger performer with better long-term prospects.
Portfolio Analysis
Portfolio Overlap and Turnover
| Metric | Quant Focused Fund | JM Focused Fund |
| Portfolio Overlap % | 10.45% | 7.00% |
| Portfolio Turnover % | 435.00% | 129.00% |

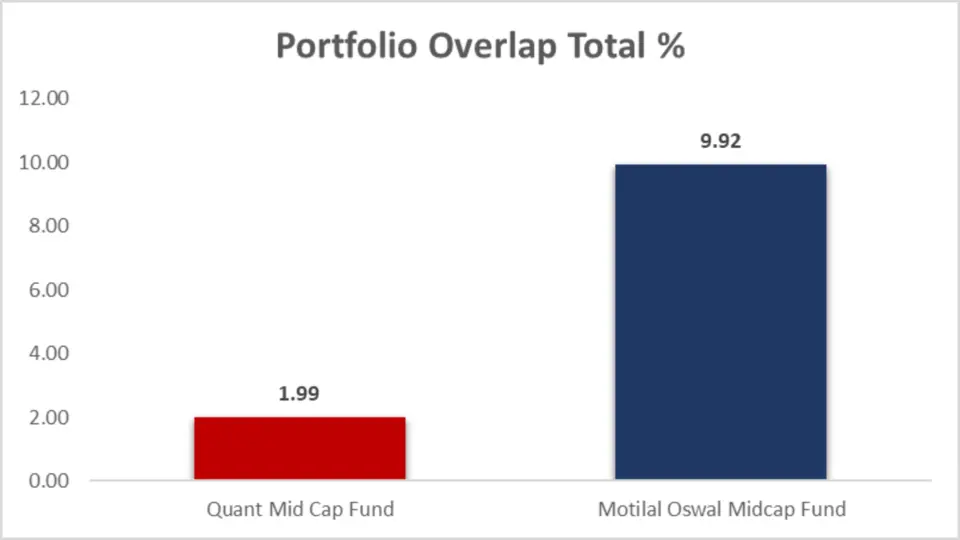
Key Takeaways:
- Portfolio Overlap: JM Focused Fund’s lower portfolio overlap (7.00%) suggests a more diversified investment approach, which could potentially offer better risk management through broader exposure to different assets.
- Portfolio Turnover: Quant Focused Fund’s high turnover ratio (435.00%) indicates an aggressive, actively managed strategy, which could appeal to investors looking for dynamic adjustments to market conditions but may also lead to higher costs
Portfolio Composition
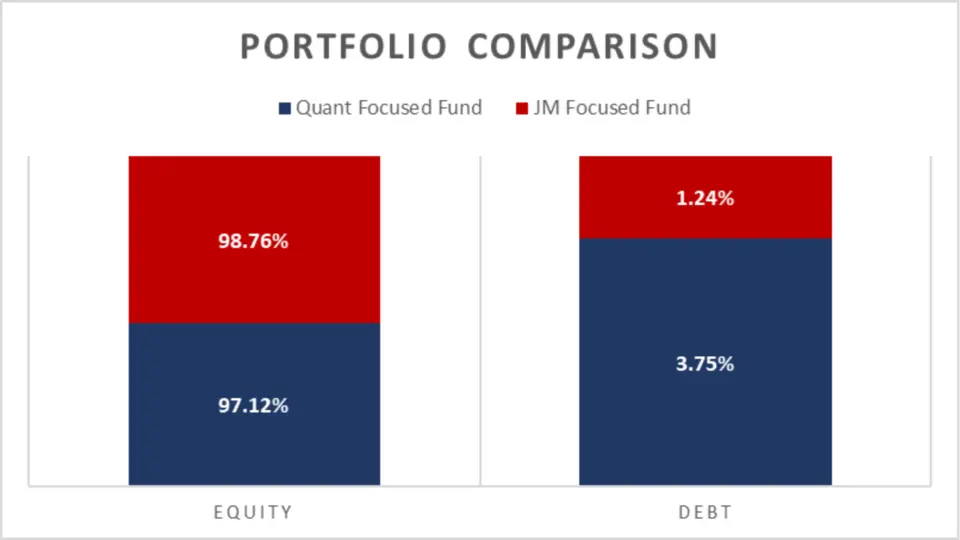
| Asset Class | Quant Focused Fund | JM Focused Fund |
| Equity | 97.12% | 98.76% |
| Debt | 3.75% | 1.24% |
| Cash & Cash Equivalents | -0.86% | 0.00% |
| Real Estate, Gold, Others | N/A | N/A |
| Commodities | N/A | N/A |
Analysis
- Equity Exposure: Both funds are heavily invested in equities, with JM Focused Fund slightly ahead at 98.76% compared to Quant Focused Fund‘s 97.12%. This high equity exposure indicates a focus on growth, making both funds suitable for investors with a higher risk tolerance.
- Debt Allocation: A focused Fund allocates 3.75% to debt, which provides a cushion against market volatility. In contrast, JM Focused Fund has a lower debt allocation of 1.24%, which suggests a more aggressive approach.
- Cash & Cash Equivalents: Interestingly, Quant Focused Fund shows a negative allocation (-0.86%) to cash equivalents, which could indicate an over-leveraged position or advanced investment strategies that involve borrowing.
Key Takeaways:
- Equity Allocation: Both funds are heavily invested in equities, signalling a strong focus on growth. JM Focused Fund’s slightly higher equity allocation suggests a more aggressive growth strategy, which may lead to higher returns and greater volatility.
- Debt Allocation: Quant Focused Fund’s higher debt allocation provides a small cushion against equity market fluctuations, potentially offering more stability than JM Focused Fund.
Market Cap Allocation
Market cap allocation reveals the Fund’s preference for large, mid, or small-cap stocks, which impacts risk and Return.

H2: Market Cap Distribution
| Metric | Quant Focused Fund | JM Focused Fund |
| No. of Stocks | 19 | 30 |
| Large Cap | 50.06% | 36.56% |
| Mid Cap | 7.93% | 15.86% |
| Small Cap | 0.00% | 12.50% |
| Others | 39.10% | 33.84% |
| Foreign Equity Holdings | N/A | N/A |
Analysis
- Number of Stocks: JM Focused Fund holds 30 stocks, offering broader diversification than Quant Focused Fund‘s 19 stocks. This could mean lower risk for JM Focused Fund due to more diversified holdings.
- Significant Cap Focus: Quant Focused Fund has a higher allocation to large-cap stocks (50.06%), suggesting a preference for stability and established companies. On the other hand, JM Focused Fund allocates 36.56% to large caps, with a higher emphasis on mid and small caps.
- Mid and Small Cap Exposure: JM Focused Fund has a substantial allocation to mid and small-cap stocks (15.86% and 12.50%, respectively), which could provide higher growth possibilities but also comes with increased volatility. Quant Focused Fund‘s lower allocation to mid-caps (7.93%) and no exposure to small caps may indicate a more conservative strategy.
Sector Allocation
| Sector | Quant Focused Fund | JM Focused Fund |
| Technology | 5.97% | 11.43% |
| Materials | 5.52% | 16.32% |
| Healthcare | 5.04% | 2.45% |
| Financial | 32.95% | 20.19% |
| Energy & Utilities | 20.39% | 6.36% |
| Consumer Staples | 27.24% | N/A |
| Consumer Discretionary | N/A | 19.69% |
| Industrials | N/A | 22.32% |
Analysis
- Technology and Materials: JM Focused Fund is heavily weighted towards technology (11.43%) and materials (16.32%), focusing on sectors that could benefit from innovation and industrial growth. Quant Focused Fund has a more balanced approach, with 5.97% in technology and 5.52% in materials.
- Financials and Energy: Quant Focused Fund strongly prefers financials (32.95%) and energy & utilities (20.39%), sectors known for stability and consistent returns. JM Focused Fund allocates 20.19% to financials and a smaller 6.36% to energy, reflecting a different sector strategy.
- Consumer Staples vs. Discretionary: Quant Focused Fund has a significant allocation to consumer staples (27.24%), which are generally considered safer investments. JM Focused Fund leans towards consumer discretionary (19.69%) and industrials (22.32%), sectors that may offer higher growth but also higher risk.
Key Takeaways:
- Diversification: JM Focused Fund’s broader diversification with 30 stocks may offer a lower risk profile compared to the more concentrated portfolio of Quant Focused Fund.
- Large-Cap Focus: Quant-Focused Fund’s higher allocation to large-cap stocks suggests a preference for stability and lower risk, making it potentially more suitable for conservative investors.
- Mid and Small-Cap Exposure: JM Focused Fund’s significant allocations to mid-cap (15.86%) and small-cap (12.50%) stocks indicate a more aggressive strategy to capture growth from emerging companies. This positions the Fund as a potentially higher-risk, higher-reward option.
- Strategic Flexibility: Both funds are substantially allocated to the “Others” category, indicating a strategic focus on niche sectors or specific investment themes. Quant Focused Fund shows a slightly greater emphasis.
Fund Management Details

| Fund | Fund Manager | Tenure (Months) |
| JM Focused Fund | Asit Bhandarkar | 185 |
| Chaitanya Choksi | 120 | |
| Gurvinder Singh Wasan | 20 | |
| Quant Focused Fund | Sanjeev Sharma | 91 |
| Vasav Sahgal | 61 | |
| Ankit A. Pande | 51 |
Key Takeaways:
- Experience Depth: JM Focused Fund has a clear advantage in terms of management experience, particularly with Asit Bhandarkar’s 15+ years in the role. This depth of experience might provide a higher confidence level for investors looking for a fund managed by a seasoned professional.
- Team Stability: The combination of Bhandarkar’s long tenure and Choksi’s decade of experience suggests a stable management team, likely contributing to the Fund’s consistency over time.
Other Important General Details
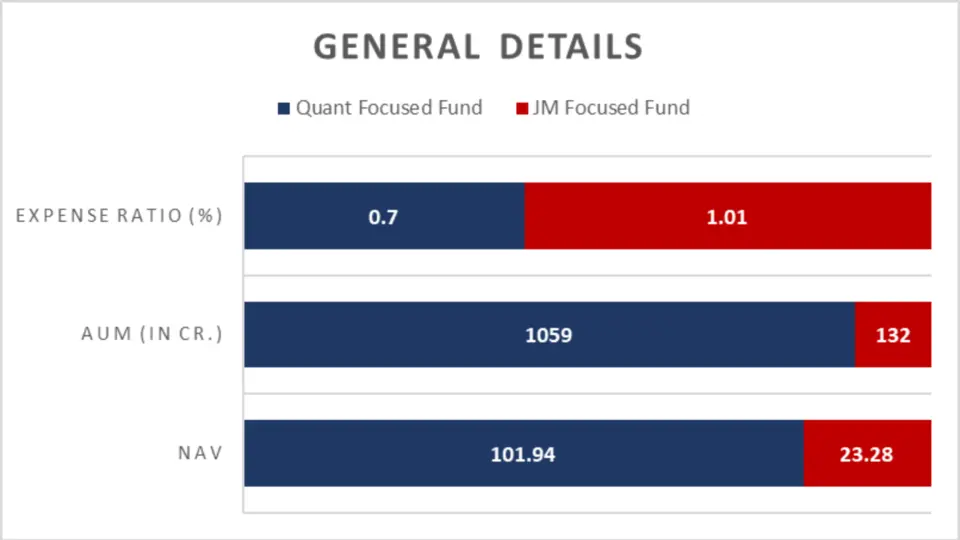
General fund details like NAV (Net Asset Value), AUM (Assets Under Management), and the expense ratio give insight into the Fund’s size, popularity, and cost-effectiveness.
| Metric | Quant Focused Fund | JM Focused Fund |
| NAV | ₹101.94 | ₹23.28 |
| AUM (in Cr.) | ₹1,059 | ₹132 |
| Expense Ratio (%) | 0.70% | 1.01% |
Analysis
- NAV (Net Asset Value): The NAV represents the per-unit value of the Fund. Quant Focused Fund has a higher NAV at ₹101.94, which reflects a more established and possibly better-performing fund. JM Focused Fund has a lower NAV at ₹23.28, making it potentially more accessible for new investors looking to enter at a lower price point.
- AUM (Assets Under Management): Quant Focused Fund significantly outpaces JM Focused Fund in terms of AUM, managing ₹1,059 crore compared to ₹132 crore for JM Focused Fund. A higher AUM generally indicates greater investor confidence and stability due to the more extensive capital base.
- Expense Ratio: The expense ratio measures the Fund’s operating costs relative to its assets. A focused Fund has a lower expense ratio of 0.70%, making it more cost-effective for investors. JM Focused Fund‘s expense ratio of 1.01% is higher, which could eat into returns over time.
Minimum Investment Amount
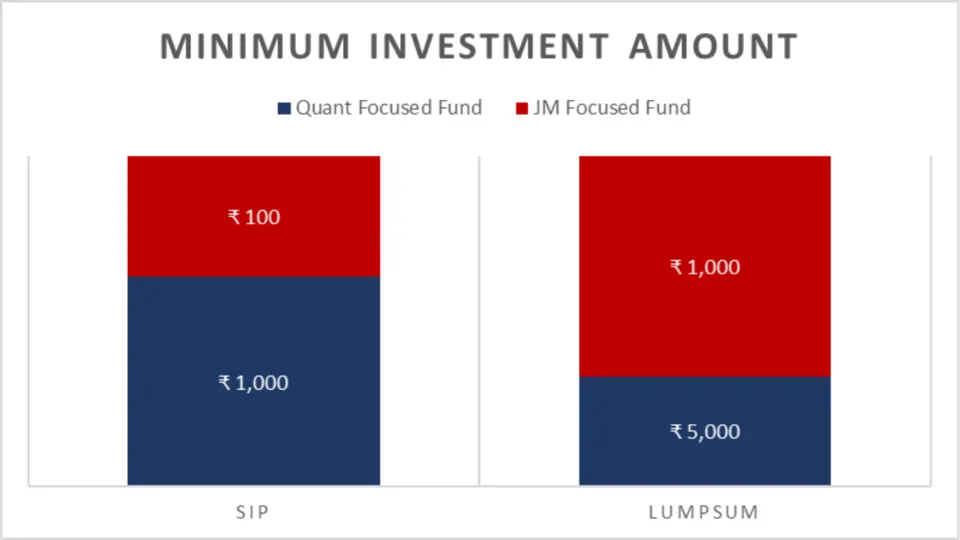
Understanding the minimum investment required for both SIPs and lumpsum investments can help you plan your entry into these funds.
| Investment Type | Quant Focused Fund | JM Focused Fund |
| SIP | ₹1,000 | ₹100 |
| Lumpsum | ₹5,000 | ₹1,000 |
Analysis
- SIP (Systematic Investment Plan): JM Focused Fund offers a much lower minimum SIP investment at ₹100, making it highly accessible for investors looking to start small. In contrast, a focused Fund requires a minimum SIP of ₹1,000, which is still reasonable but targets slightly higher initial contributions.
- Lumpsum Investment: JM Focused Fund again has a lower threshold at ₹1,000 for lumpsum investments, allowing investors to enter with a smaller amount. Quant Focused Fund requires a higher minimum lumpsum investment of ₹5,000, which might suit investors with a bit more capital to deploy upfront.
Conclusion
While both Quant Focused Fund and JM Focused Fund offer robust growth-oriented investment opportunities, Quant Focused Fund emerges as the more vital option overall, especially for medium to long-term investors. It consistently outperforms in critical metrics such as long-term returns, SIP returns, rolling returns, and CAGR while maintaining a lower expense ratio and higher fund ratings. A focused Fund is better suited for investors with a moderate to high-risk appetite looking for stable and consistent long-term growth.
On the other hand, JM Focused Fund may appeal to those with a higher tolerance for volatility and those looking to start investing with a lower initial amount, thanks to its lower minimum investment requirements and higher short-term Alpha. Depending on your risk desire and investment horizon, either Fund could serve well. Still, Quant Focused Fund stands out as the superior choice across most parameters.

FAQs- Quant Focused Fund vs JM Focused Fund
Which Fund offers better long-term returns, a quantitative or a JM-focused fund?
Quant Focused Fund has consistently outperformed JM Focused Fund over the long term. For instance, over 10 years, Quant Focused Fund delivered a return of 20.01%, compared to JM Focused Fund’s 16.09%. A focused Fund is a more vital choice for long-term investors seeking substantial growth.
Which Fund is more suitable for risk-averse investors?
Quant Focused Fund may be the better option for risk-averse investors due to its lower volatility, as indicated by its lower standard deviation over the 10 years (16.36% vs. JM Focused Fund’s 19.78%). A focused Fund has a lower Beta, indicating less volatility than the market.
What are the critical differences in portfolio allocation between the two funds?
Quant Focused Fund has a higher allocation to large-cap stocks (50.06%) compared to JM Focused Fund (36.56%), indicating a focus on stability and established companies. On the other hand, JM Focused Fund allocates more to mid and small-caps, offering higher growth potential but with increased volatility.
How do the expense ratios of Quant Focused Fund and JM Focused Fund compare?
Quant Focused Fund has a lower expense ratio of 0.70%, making it more cost-effective for investors. In contrast, JM Focused Fund’s expense ratio is higher at 1.01%, which could impact the overall returns over time.
Which Fund has a lower minimum investment requirement for SIPs and lumpsum investments?
JM Focused Fund is more accessible with a lower minimum SIP investment of ₹100 and a lumpsum investment requirement of ₹1,000. Quant Focused Fund requires a higher minimum SIP of ₹1,000 and a lumpsum investment of ₹5,000.
Which Fund is better for medium-term investments?
Quant Focused Fund stands out for medium-term investments with a 5-year return of 26.90%, significantly higher than JM Focused Fund’s 20.65%. This makes Quant Focused Fund more suitable for investors with a medium-term horizon.
How do the fund management teams of Quant Focused Fund and JM Focused Fund compare?
Quant Focused Fund has a lower expense ratio of 0.70%, making it more cost-effective for investors. In contrast, JM Focused Fund’s expense ratio is higher at 1.01%, which could impact the overall returns over time.
Which Fund offers better risk-adjusted returns?
JM Focused Fund shows a higher Sortino ratio (2.38% vs. Quant Focused Fund’s 2.09%) and a better 3-year Sharpe ratio (1.31% vs. 1.20%), indicating superior risk-adjusted returns in the short term. However, over the 5-year and 10-year periods, Quant Focused Fund outperforms in terms of Sharpe ratio.
How do the two funds perform during market downturns?
JM Focused Fund boasts a more experienced management team, with Asit Bhandarkar leading with 185 months of experience. Quant Focused Fund’s team is less skilled but still competent, led by Sanjeev Sharma with 91 months of experience.
Which Fund offers better risk-adjusted returns?
Quant Focused Fund has a significantly higher portfolio turnover ratio of 435.00%, indicating more frequent changes in its holdings. JM Focused Fund’s lower turnover ratio of 129.00% suggests a more stable and less actively managed portfolio.
Is Quant Focused Fund or JM Focused Fund rated higher by independent research firms?
Quant Focused Fund generally receives higher ratings, with a 5-star rating from both Value Research and Morning Star. While also highly rated, JM Focused Fund scores slightly lower with 4-star and 3-star ratings, respectively.
Disclaimer:
The information provided in this article is solely the author/advertisers’ opinion and not investment advice – it is provided for educational purposes only. Using this, you agree that the information does not constitute any investment or financial instructions by Ace Equity Research/Mutual Fund Focus/IPO First and the team. Anyone wishing to invest should seek their own independent financial or professional advice. Conduct your research with registered financial advisors before making any investment decisions. Ace Equity Research/ Mutual Fund Focus / IPO First and the team are not accountable for the investment views provided in the article.
Mutual Fund investments are subject to market risks. Read all scheme-related documents carefully.
Investments in the securities market are subject to market risks. Read all the related documents carefully before investing