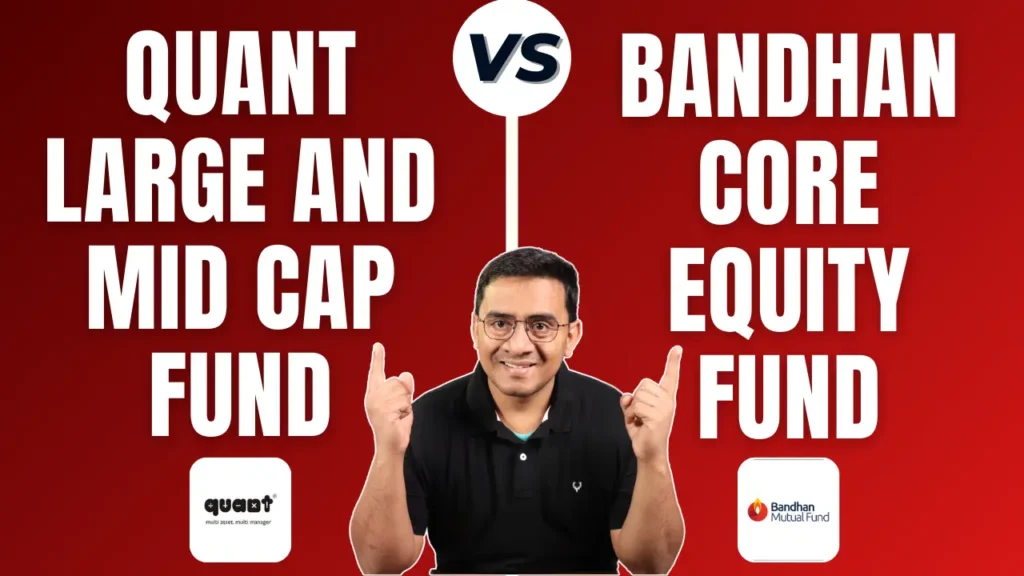
Suppose you’re considering investing in large and mid-cap funds and need clarification on the Quant Large and Mid Cap Fund vs Bandhan Core Equity Fund. In that case, you’ve come to the right place. This blog will help resolve all your doubts. Here, we dive deep into a five-step comprehensive comparative analysis of these two funds, evaluating critical parameters to help you choose the most consistent and best-performing fund for your mutual fund investment portfolio.
Investment Style
The Quant Large and Mid Cap Fund and the Bandhan Core Equity Fund follow a blended investment style. This means they invest in a mix of large-cap and mid-cap stocks, providing a balance between growth potential and Stability.
Returns Analysis
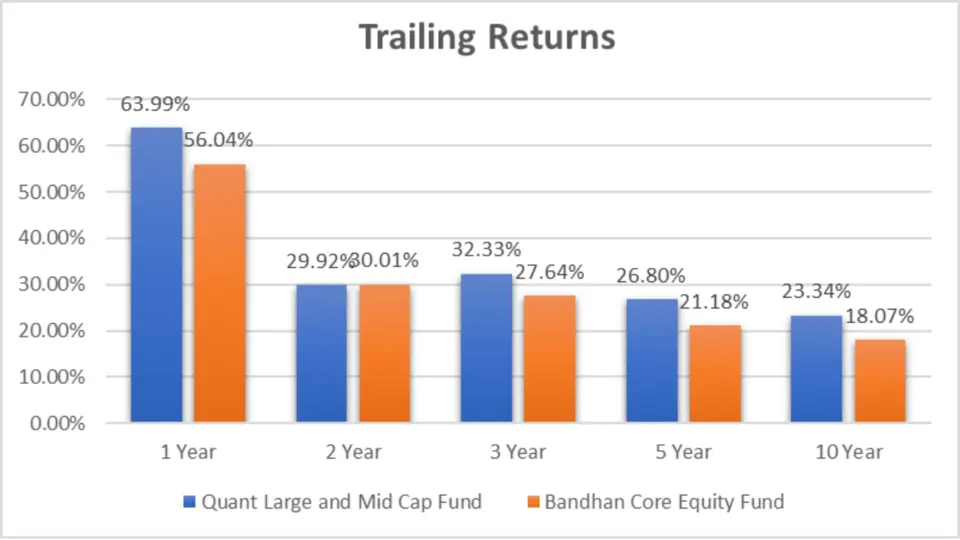
Returns are a crucial factor when selecting a mutual fund. Below, we present a detailed comparison of the trailing returns for both funds as of 28th March 2024.
Trailing Returns
| Period Invested for | Quant Large and Mid Cap Fund | Bandhan Core Equity Fund |
| 1 Year | 63.99% | 56.04% |
| 2 Year | 29.92% | 30.01% |
| 3 Year | 32.33% | 27.64% |
| 5 Year | 26.80% | 21.18% |
| 10 Year | 23.34% | 18.07% |
Analysis:
- 1 Year: The Quant Large and Mid Cap Fund outperform with a return of 63.99% compared to the Bandhan Core Equity Fund’s 56.04%.
- 2 Year: Bandhan Core Equity Fund slightly edges out with 30.01% over Quant’s 29.92%.
- 3 Year, 5 Year, and 10 Year: Quant Large and Mid Cap Fund consistently outperforms Bandhan Core Equity Fund.
Key Takeaways
- Short-Term Performance (1 Year): Quant Large and Mid Cap Fund is the winner with significantly higher returns.
- Mid-Term Performance (2-3 Years): While Bandhan slightly edges out Quant in the 2 years, Quant takes the lead in the 3 years, showing better overall mid-term Stability.
- Long-Term Performance (5-10 Years): Quant Large and Mid Cap Fund consistently outperforms Bandhan Core Equity Fund, making it a more reliable choice for long-term investment horizons.
Lumpsum Investment Value
Investors also consider the value of their lumpsum investments over different periods. Here is a comparative analysis:

| Period Invested for | Quant Large and Mid Cap Fund | Bandhan Core Equity Fund |
| 1 Year | ₹16,421.2 | ₹15,622.5 |
| 2 Year | ₹16,890.1 | ₹16,915.2 |
| 3 Year | ₹23,190.1 | ₹20,810 |
| 5 Year | ₹32,846.4 | ₹26,171.2 |
| 10 Year | ₹81,696.4 | ₹52,765.4 |
Analysis:
- 1 Year: A lumpsum investment in Quant Large and Mid Cap Fund yields ₹16,421.2, higher than Bandhan’s ₹15,622.5.
- 2 Year: Bandhan Core Equity Fund shows a slight edge with ₹16,915.2 over Quant’s ₹16,890.1.
- 3 Year, 5 Year, and 10 Year: Quant Large and Mid Cap Fund significantly outperform, offering higher returns on lumpsum investments.
Key Takeaways
- Short-Term Performance (1 Year): Quant Large and Mid Cap Fund shows higher returns, making it the better choice for short-term investment.
- Mid-Term Performance (2-3 Years): While Bandhan slightly leads in the 2 years, Quant Large and Mid Cap Fund significantly outperform in the 3 years, indicating better overall mid-term Performance.
- Long-Term Performance (5-10 Years): Quant Large and Mid Cap Fund consistently outperforms Bandhan Core Equity Fund, making it a more reliable choice for long-term investment horizons.
SIP Returns
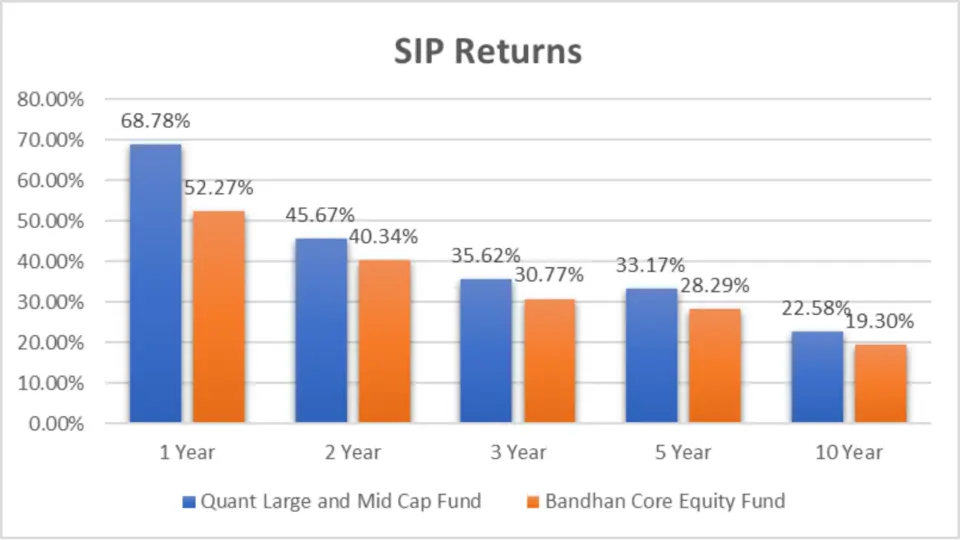
Let’s kick things off with SIP returns. This is a critical factor if you’re planning to invest systematically.
| Period Invested for | Quant Large and Mid Cap Fund | Bandhan Core Equity Fund |
| 1 Year | 68.78% | 52.27% |
| 2 Year | 45.67% | 40.34% |
| 3 Year | 35.62% | 30.77% |
| 5 Year | 33.17% | 28.29% |
| 10 Year | 22.58% | 19.30% |
Analysis:
- 1 Year: The Quant Large and Mid Cap Fund leads with 68.78% compared to Bandhan’s 52.27%.
- 2 Year: Quant again outperforms with 45.67%, whereas Bandhan offers 40.34%.
- 3 Year: Quant stands at 35.62% while Bandhan is at 30.77%.
- 5 Year: Quant continues its lead with 33.17%, compared to Bandhan’s 28.29%.
- 10 Year: Quant shows 22.58%, ahead of Bandhan’s 19.30%.
Key Takeaways
- Superior Short-Term Performance: Quant Large and Mid Cap Fund show a strong performance in the short term, with 68.78% over one year, making it an attractive option for immediate gains.
- Consistent Mid-Term Growth: Over 2 and 3 years, Quant consistently outperforms Bandhan, indicating stable Growth and better returns.
- Long-Term Strength: Quant’s returns over 5 and 10 years are significantly higher than Bandhan’s, demonstrating its superior Performance for long-term SIP investments. This makes Quant a more reliable choice for investors seeking sustained Growth over extended periods.
SIP Investment Value
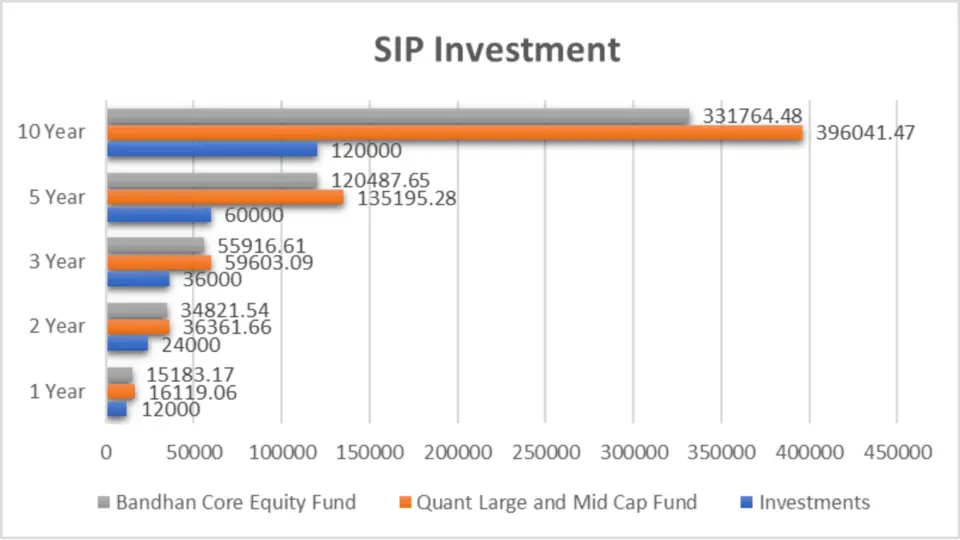
Let’s see how your money grows with these funds over different periods with SIP investments.
Investment Value Over Time
| Period Invested for | Investments (₹) | Quant Large and Mid Cap Fund | Bandhan Core Equity Fund |
| 1 Year | 12,000 | 16,119.06 | 15,183.17 |
| 2 Year | 24,000 | 36,361.66 | 34,821.54 |
| 3 Year | 36,000 | 59,603.09 | 55,916.61 |
| 5 Year | 60,000 | 1,35,195.28 | 1,20,487.65 |
| 10 Year | 1,20,000 | 3,96,041.47 | 3,31,764.48 |
Analysis:
- 1 Year: A SIP of ₹12,000 grows to ₹16,119.06 in Quant, higher than Bandhan’s ₹15,183.17.
- 2 Year: Quant stands at ₹36,361.66, leading over Bandhan’s ₹34,821.54.
- 3 Year: Quant’s ₹59,603.09 outshines Bandhan’s ₹55,916.61.
- 5 Year: Quant grows to ₹1,35,195.28, whereas Bandhan reaches ₹1,20,487.65.
- 10 Year: Quant hits ₹3,96,041.47, significantly higher than Bandhan’s ₹3,31,764.48.
Key Takeaways
- Short-Term Growth (1 Year): Quant Large and Mid Cap Fund shows strong short-term Growth, making it a better choice for immediate returns.
- Mid-Term Growth (2-3 Years): Quant maintains its edge in the mid-term, indicating better performance stability.
- Long-Term Growth (5-10 Years): Quant significantly outperforms Bandhan in the long term, making it a superior option for Sustained Growth over extended periods.
Compound Annual Growth Rate (CAGR)
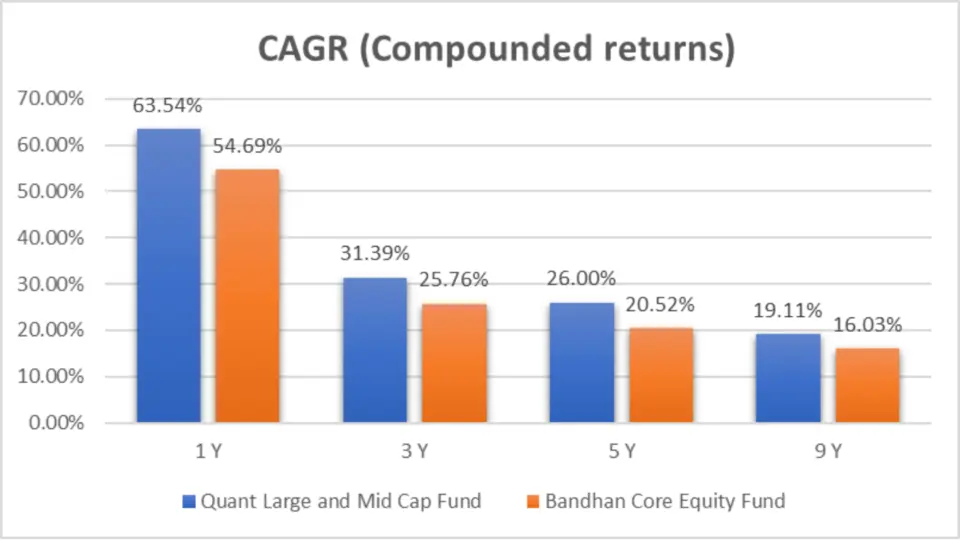
Let’s break down the CAGR for different periods to see the growth rate of these funds.
CAGR Analysis
| Category | 1 Y | 3 Y | 5 Y | 9 Y |
| Quant Large and Mid Cap Fund | 63.54% | 31.39% | 26.00% | 19.11% |
| Bandhan Core Equity Fund | 54.69% | 25.76% | 20.52% | 16.03% |
Analysis:
- 1 Year: Quant leads with a CAGR of 63.54%, compared to Bandhan’s 54.69%.
- 3 Year: Quant shows 31.39%, ahead of Bandhan’s 25.76%.
- 5 Year: Quant achieves 26.00%, surpassing Bandhan’s 20.52%.
- 9 Year: Quant stands strong at 19.11%, over Bandhan’s 16.03%.
Key Takeaways
- 1-Year Performance: Quant Large and Mid Cap Fund has a superior short-term growth rate with a CAGR of 63.54%, significantly higher than Bandhan Core Equity Fund’s 54.69%.
- 3-Year Performance: Quant continues to lead with a CAGR of 31.39%, demonstrating better medium-term Growth than Bandhan’s 25.76%.
- 5 Year Performance: Over five years, Quant achieves a CAGR of 26.00%, surpassing Bandhan’s 20.52%, indicating strong and consistent Performance.
- 9-Year Performance: Quant maintains its dominance with a CAGR of 19.11%, outperforming Bandhan’s 16.03%, making it a more reliable choice for long-term Growth.
Rolling Returns
Rolling returns provide a better understanding of fund performance over different periods.

| Category | 1 Y | 3 Y | 5 Y | 9 Y |
| Quant Large and Mid Cap Fund | 24.06% | 20.32% | 16.90% | 20.33% |
| Bandhan Core Equity Fund | 18.98% | 15.78% | 13.67% | 15.36% |
Analysis:
- 1 Year: Quant delivers 24.06%, leading over Bandhan’s 18.98%.
- 3 Year: Quant’s 20.32% outperforms Bandhan’s 15.78%.
- 5 Year: Quant shows 16.90%, better than Bandhan’s 13.67%.
- 9 Year: Quant leads with 20.33%, compared to Bandhan’s 15.36%.
Key Takeaways
- 1-Year Performance: Quant Large and Mid Cap Fund delivered a rolling return of 24.06%, outperforming Bandhan Core Equity Fund’s 18.98%, showcasing superior short-term Performance.
- 3-Year Performance: Quant maintains its edge with a rolling return of 20.32%, compared to Bandhan’s 15.78%, indicating better medium-term Stability.
- 5-Year Performance: Quant shows a more robust rolling return of 16.90%, ahead of Bandhan’s 13.67%, demonstrating consistent Performance over five years.
- 9-Year Performance: Quant leads with a rolling return of 20.33%, surpassing Bandhan’s 15.36%, making it the better choice for long-term Growth and Stability.
Annualized/Calendar Year Returns
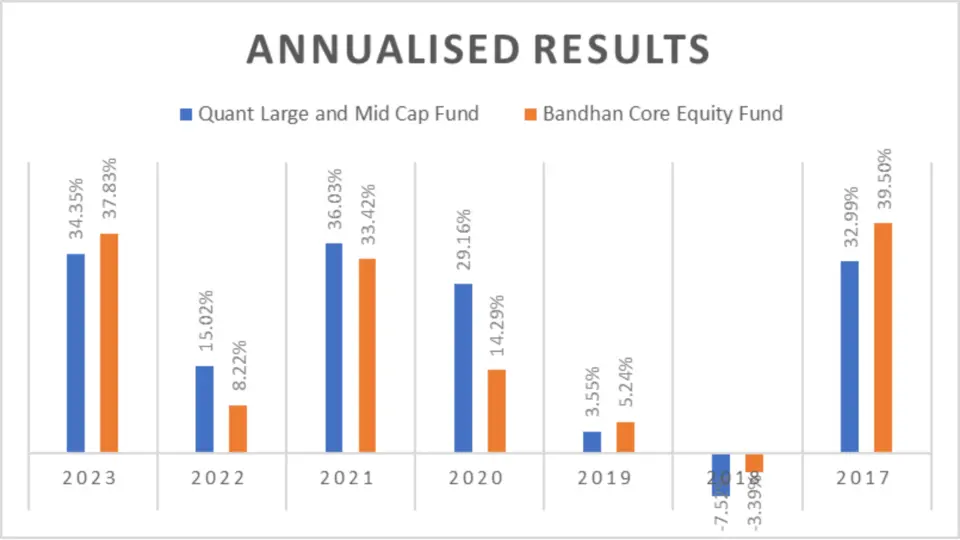
Yearly Performance
| Period | Quant Large and Mid Cap Fund | Bandhan Core Equity Fund |
| 2023 | 34.35% | 37.83% |
| 2022 | 15.02% | 8.22% |
| 2021 | 36.03% | 33.42% |
| 2020 | 29.16% | 14.29% |
| 2019 | 3.55% | 5.24% |
| 2018 | -7.52% | -3.39% |
| 2017 | 32.99% | 39.50% |
Analysis:
- 2023: Bandhan leads with 37.83% compared to Quant’s 34.35%.
- 2022: Quant outperforms with 15.02% over Bandhan’s 8.22%.
- 2021: Quant achieves 36.03%, slightly higher than Bandhan’s 33.42%.
- 2020: Quant excels with 29.16%, significantly better than Bandhan’s 14.29%.
- 2019 & 2018: Bandhan shows better Performance.
- 2017: Bandhan again outperforms with 39.50% compared to Quant’s 32.99%.
Key Takeaways
- Bandhan Core Equity Fund has demonstrated more robust Performance in recent years (2023, 2019, 2018, and 2017).
- Quant Large and Mid Cap Fund shows resilience and better Performance during challenging periods (2022, 2021, and 2020).
Outperformance Count
| Fund | Outperformance |
| Quant Large and Mid Cap Fund | 3 |
| Bandhan Core Equity Fund | 4 |
Best Quarters
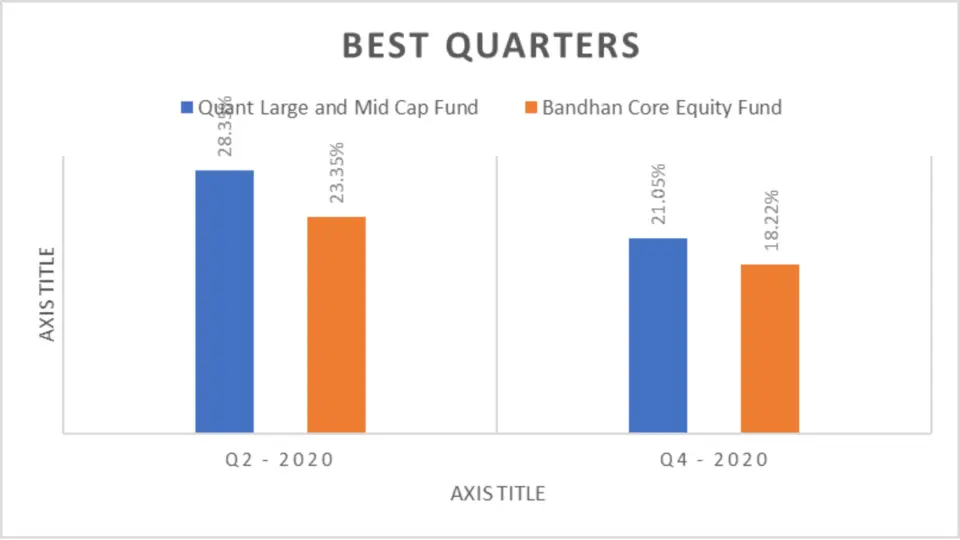
| Period | Quant Large and Mid Cap Fund | Bandhan Core Equity Fund |
| Q2 – 2020 | 28.35% | 23.35% |
| Q4 – 2020 | 21.05% | 18.22% |
Analysis:
- Q2 – 2020: Quant leads with 28.35% over Bandhan’s 23.35%.
- Q4 – 2020: Quant outperforms with 21.05% compared to Bandhan’s 18.22%.
Key Takeaways
- Quant Large and Mid Cap Funds perform better during the best quarters, demonstrating their potential for higher returns during favourable market conditions.
- Bandhan Core Equity Fund experiences more significant declines during the worst quarters, indicating higher volatility than Quant during market downturns.
- Investors seeking higher returns during market upswings might prefer Quant Large and Mid Cap Funds. At the same time, those more concerned about mitigating losses during downturns should consider the comparative volatility of both funds.
Worst Quarters
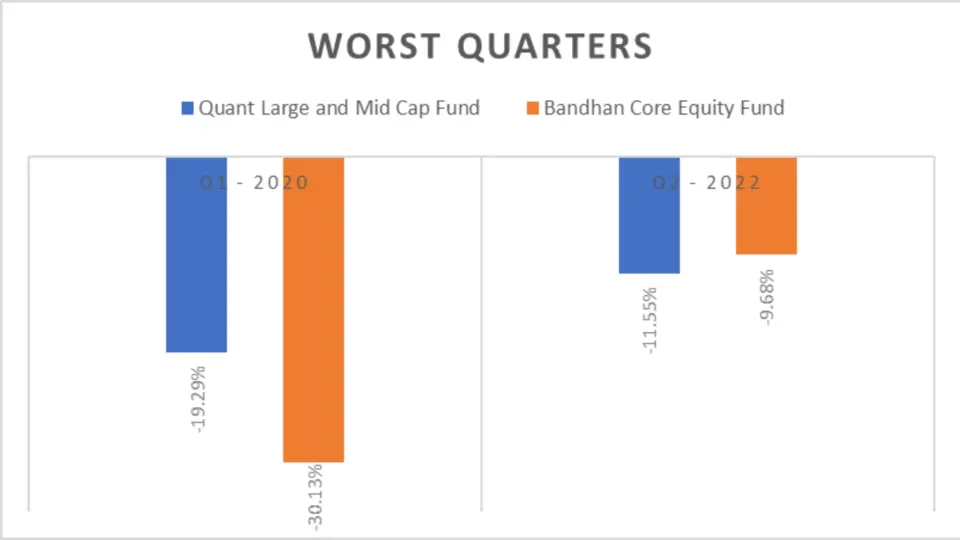
| Period | Quant Large and Mid Cap Fund | Bandhan Core Equity Fund |
| Q1 – 2020 | -19.29% | -30.13% |
| Q2 – 2022 | -11.55% | -9.68% |
Analysis:
- Q1 – 2020: Bandhan shows a more significant decline with -30.13% compared to Quant’s -19.29%.
- Q2 – 2022: Bandhan performs slightly better with -9.68% over Quant’s -11.55%.
Key Takeaways
- Bandhan Core Equity Fund tends to exhibit greater volatility and larger declines during significant market downturns, as evidenced by its Performance in Q1 2020.
- Quant Large and Mid Cap Funds show relatively lower volatility with smaller declines during the worst quarters, indicating better resilience during market downturns.
- Investors concerned with minimizing losses during volatile periods may find Quant Large and Mid Cap Funds a more stable choice. In contrast, the Bandhan Core Equity Fund may pose a higher risk during downturns due to its more significant declines.
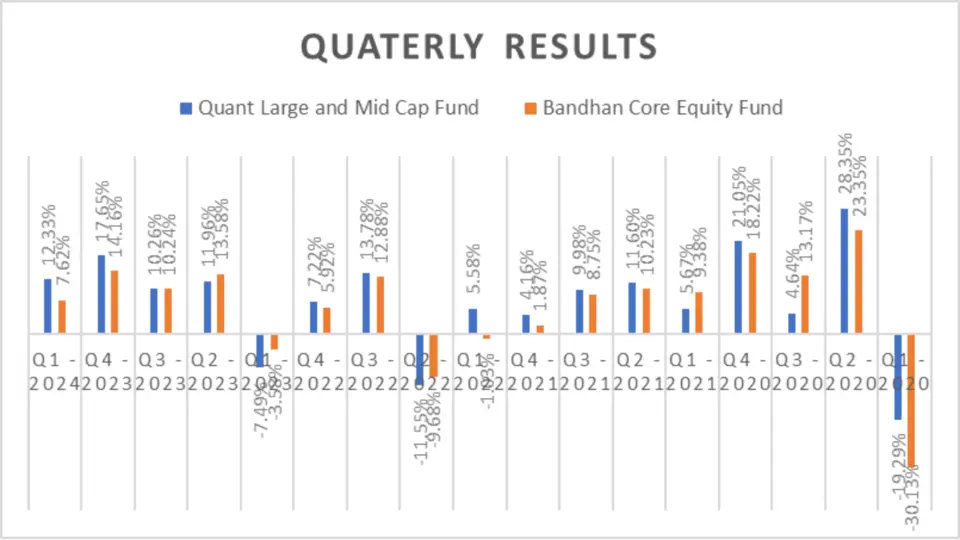
Quarterly Results
Quarterly Performance
| Period | Quant Large and Mid Cap Fund | Bandhan Core Equity Fund |
| Q1 – 2024 | 12.33% | 7.62% |
| Q4 – 2023 | 17.65% | 14.16% |
| Q3 – 2023 | 10.26% | 10.24% |
| Q2 – 2023 | 11.96% | 13.58% |
| Q1 – 2023 | -7.49% | -3.58% |
| Q4 – 2022 | 7.22% | 5.92% |
| Q3 – 2022 | 13.78% | 12.88% |
| Q2 – 2022 | -11.55% | -9.68% |
| Q1 – 2022 | 5.58% | -1.03% |
| Q4 – 2021 | 4.16% | 1.87% |
| Q3 – 2021 | 9.98% | 8.75% |
| Q2 – 2021 | 11.60% | 10.23% |
| Q1 – 2021 | 5.67% | 9.38% |
| Q4 – 2020 | 21.05% | 18.22% |
| Q3 – 2020 | 4.64% | 13.17% |
| Q2 – 2020 | 28.35% | 23.35% |
| Q1 – 2020 | -19.29% | -30.13% |
Analysis:
- Q1 – 2024: Quant leads 12.33% over Bandhan’s 7.62%.
- Q4 – 2023: Quant shows 17.65%, higher than Bandhan’s 14.16%.
- Q3 – 2023: Quant and Bandhan perform similarly.
- Q2 – 2023: Bandhan outperforms with 13.58% over Quant’s 11.96%.
- Q1 – 2023: Bandhan shows a smaller decline.
Key Takeaways
- Quant Large and Mid Cap Funds demonstrate more frequent and consistent outperformance across various quarters, making it a striking option for investors seeking regular and robust returns.
- Bandhan Core Equity Fund shows its strength in certain quarters, particularly in managing declines better during some downturns. This could appeal to investors who are focusing on risk management.
- When choosing between these funds, investors should consider their risk tolerance, market outlook, and investment goals, as each exhibits unique strengths in different market conditions.
Overall Outperformance
| Fund | Outperformance |
| Quant Large and Mid Cap Fund | 12 |
| Bandhan Core Equity Fund | 5 |
Risk Analysis
Mean, Sortino Ratio and Treynor’s Ratio
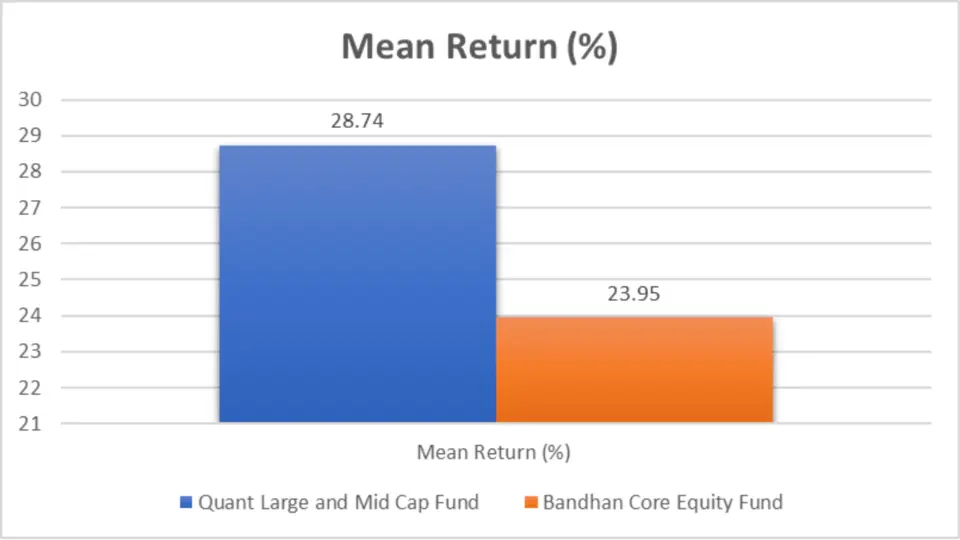
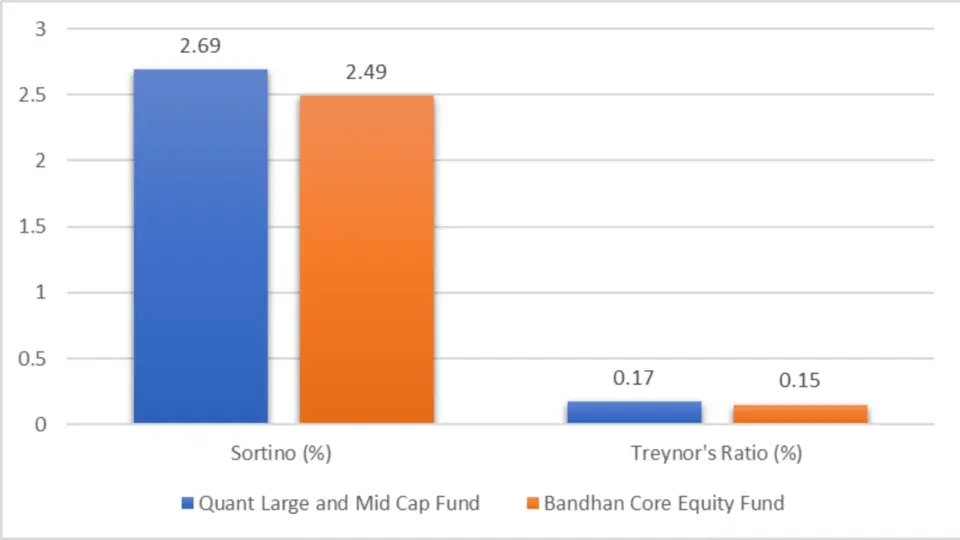
Risk Metrics
| Metric | Quant Large and Mid Cap Fund | Bandhan Core Equity Fund |
| Mean Return (%) | 28.74 | 23.95 |
| Sortino Ratio | 2.69 | 2.49 |
| Treynor’s Ratio | 0.17 | 0.15 |
Analysis:
- Mean Return: Quant shows a higher mean return of 28.74% compared to Bandhan’s 23.95%.
- Sortino Ratio: Quant leads with a ratio of 2.69, indicating better risk-adjusted returns.
- Treynor’s Ratio: Quant again outperforms with a ratio of 0.17.
Key Takeaways
- Quant Large and Mid Cap Funds exhibit superior Performance across all risk metrics, making them a more striking option for investors seeking higher returns and better risk management.
- Bandhan Core Equity Fund performs well but falls short compared to Quant in terms of mean Return, risk-adjusted returns, and Performance relative to market risk.
- Investors prioritizing higher returns and better risk-adjusted Performance should consider Quant Large and Mid Cap Fund a more favourable choice. However, Bandhan Core Equity Fund still presents a solid option for those looking for a dependable investment.
Maximum Drawdown
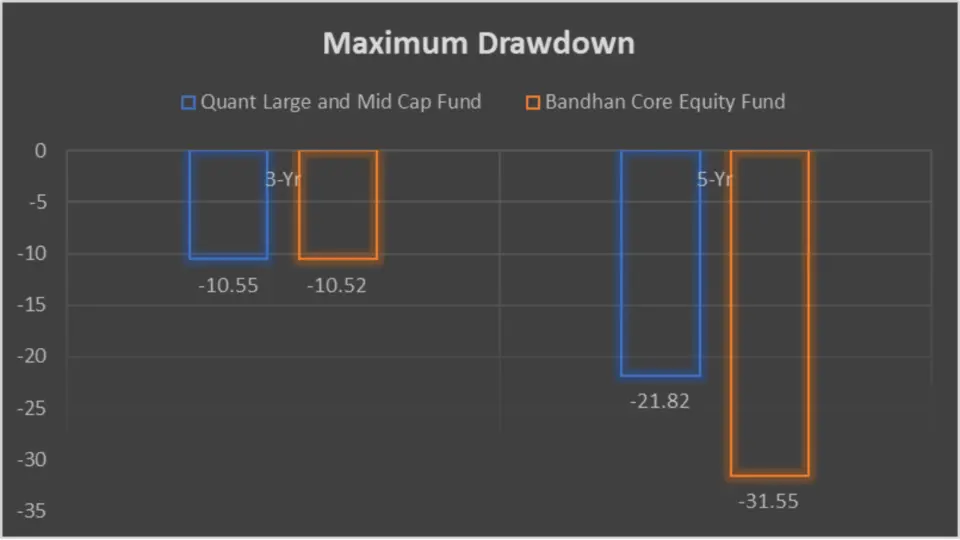
Drawdown Analysis
| Period | 3-Yr | 5-Yr |
| Quant Large and Mid Cap Fund | -10.55 | -21.82 |
| Bandhan Core Equity Fund | -10.52 | -31.55 |
Analysis:
- 3-Year: Both funds show similar drawdowns, with Bandhan slightly better at -10.52%.
- 5-Year: Quant performs better with a drawdown of -21.82% compared to Bandhan’s -31.55%.
Key Takeaways
- Short to Medium Term (3-Year): Both funds display similar drawdown levels, indicating comparable risk levels over this period. Bandhan Core Equity Fund shows a marginally better performance.
- Long-term (5-Year): Quant Large and Mid Cap Fund demonstrate superior resilience with a lower drawdown, making it a more stable option for long-term investors concerned with minimizing losses during market downturns.
- Investors prioritizing Stability and lower volatility, especially over longer investment horizons, may prefer Quant Large and Mid Cap Funds due to their better Performance in reducing maximum drawdown over five years.
Standard Deviation
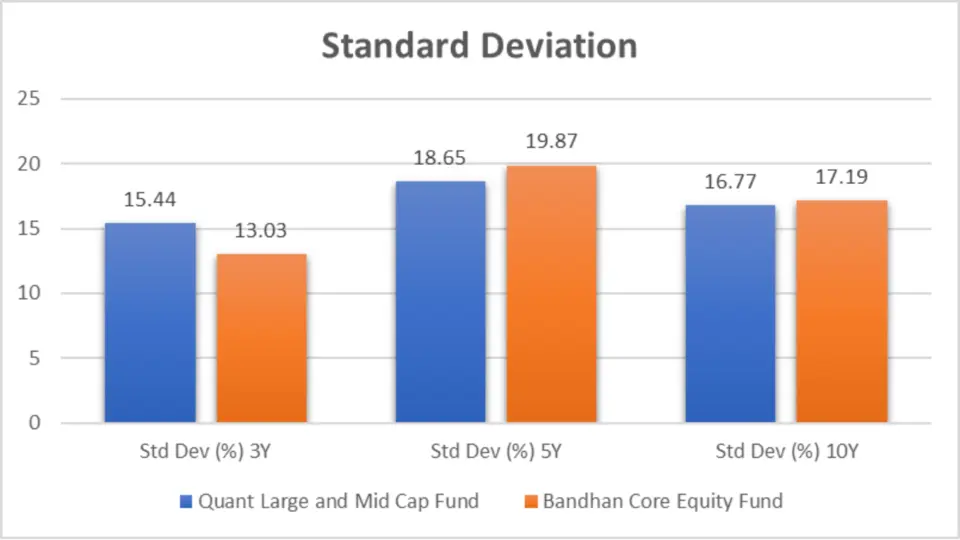
Standard deviation measures the fund’s volatility. Lower values indicate less volatility, which can mean more Stability for your investment.
| Period | Quant Large and Mid Cap Fund | Bandhan Core Equity Fund |
| 3Y | 15.44 | 13.03 |
| 5Y | 18.65 | 19.87 |
| 10Y | 16.77 | 17.19 |
Analysis:
- 3-Year: Bandhan Core Equity Fund shows lower volatility with a standard deviation of 13.03% compared to Quant’s 15.44%.
- 5-Year: Quant leads with a lower standard deviation of 18.65% versus Bandhan’s 19.87%.
- 10-Year: Quant maintains a slight edge with 16.77% compared to Bandhan’s 17.19%.
Key Takeaways
- Lower volatility (3Y): Bandhan Core Equity Fund has shown lower volatility in the short term (3 years), making it potentially more stable.
- Long-Term Stability (5Y & 10Y): Quant Large and Mid Cap Funds demonstrate lower volatility over 5 and 10 years, suggesting better long-term Stability.
Sharpe Ratio
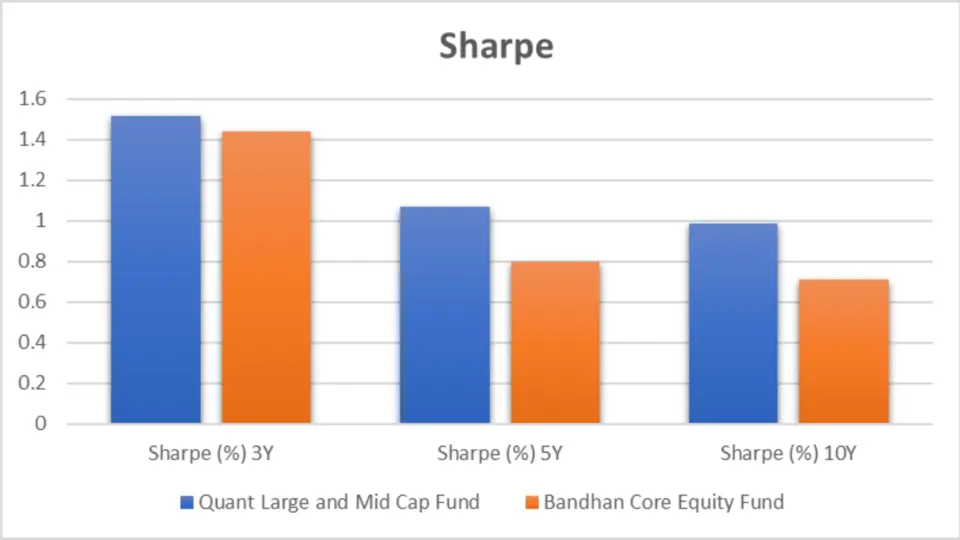
The Sharpe ratio indicates how much Return the fund provides per unit of risk. Higher ratios are better.
| Period | Quant Large and Mid Cap Fund | Bandhan Core Equity Fund |
| 3Y | 1.52 | 1.44 |
| 5Y | 1.07 | 0.80 |
| 10Y | 0.99 | 0.71 |
Analysis:
- 3-Year: Quant leads with a Sharpe ratio 1.52, indicating better risk-adjusted returns.
- 5-Year: Quant outperforms with 1.07 compared to Bandhan’s 0.80.
- 10-Year: Quant maintains its lead with 0.99 versus Bandhan’s 0.71.
Key Takeaways
- Superior Risk-Adjusted Returns (All Periods): Quant Large and Mid Cap Fund consistently shows higher Sharpe ratios across all periods, suggesting better returns for the level of risk taken.
Beta
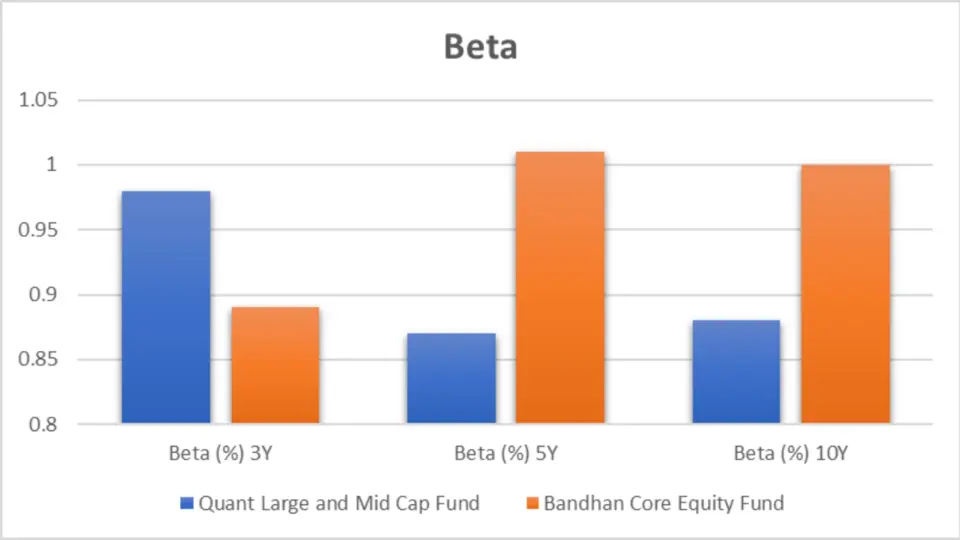
Beta measures a fund’s sensitivity to market movements. A beta of less than 1 indicates less volatility than the market.
| Period | Quant Large and Mid Cap Fund | Bandhan Core Equity Fund |
| 3Y | 0.98 | 0.89 |
| 5Y | 0.87 | 1.01 |
| 10Y | 0.88 | 1.00 |
Analysis:
- 3-Year: Bandhan shows less sensitivity to market movements with a beta of 0.89 compared to Quant’s 0.98.
- 5-Year: Quant demonstrates lower market sensitivity with a beta of 0.87 versus Bandhan’s 1.01.
- 10-Year: Quant maintains lower sensitivity with a beta of 0.88 compared to Bandhan’s 1.00.
Key Takeaways
- Lower Market Sensitivity: Quant Large and Mid Cap Funds generally show lower beta values, indicating less sensitivity to market volatility over more extended periods.
Alpha
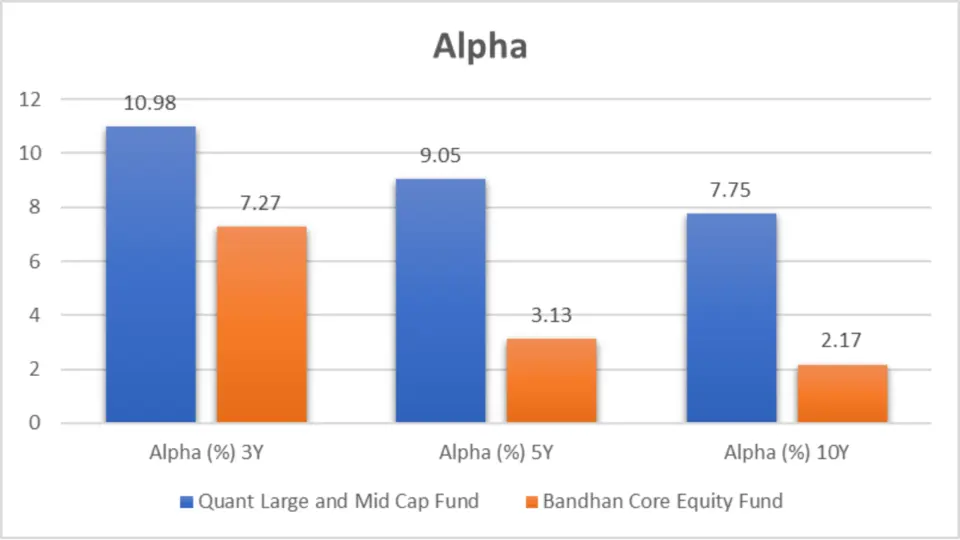
Alpha measures a fund’s performance relative to the market. Higher alpha indicates better Performance.
| Period | Quant Large and Mid Cap Fund | Bandhan Core Equity Fund |
| 3Y | 10.98 | 7.27 |
| 5Y | 9.05 | 3.13 |
| 10Y | 7.75 | 2.17 |
Analysis:
- 3-Year: Quant leads with an alpha of 10.98, indicating superior Performance.
- 5-Year: Quant outperforms with 9.05 compared to Bandhan’s 3.13.
- 10-Year: Quant maintains a strong lead with 7.75 versus Bandhan’s 2.17.
Key Takeaways
- Superior Performance: Quant Large and Mid Cap Fund consistently shows higher alpha values, indicating better Performance relative to the market.
Ratings
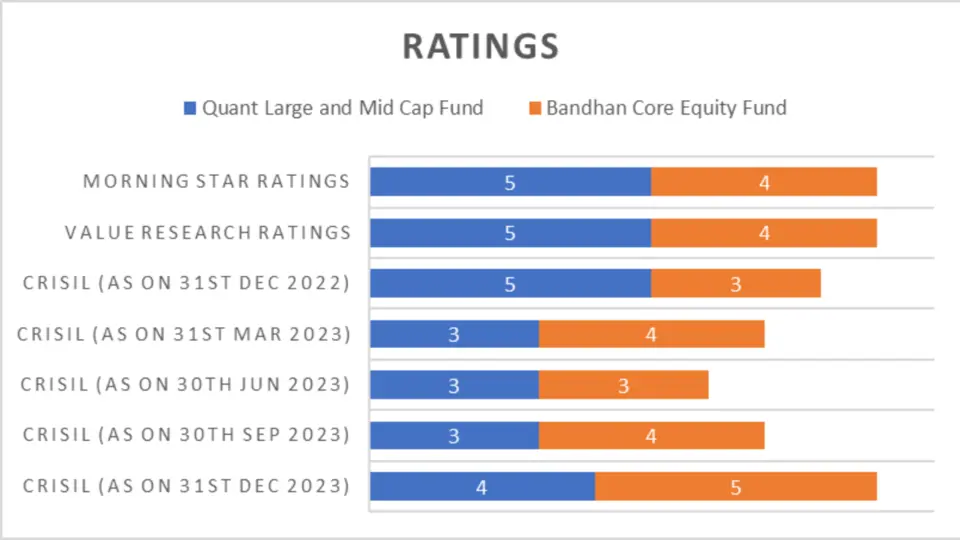
CRISIL Rank Ratings
| Date | Quant Large and Mid Cap Fund | Bandhan Core Equity Fund |
| 31st December 2023 | 4 | 5 |
| 30th September 2023 | 3 | 4 |
| 30th June 2023 | 3 | 3 |
| 31st March 2023 | 3 | 4 |
| 31st December 2022 | 5 | 3 |
| Value Research Ratings | 5 | 4 |
| Morning Star Ratings | 5 | 4 |
Analysis:
- CRISIL Ratings: Bandhan generally receives higher CRISIL ratings, especially in recent quarters.
- Value Research & Morning Star: Quant scores higher with a rating of 5 compared to Bandhan’s 4.
Key Takeaways
- Higher Independent Ratings: Quant Large and Mid Cap Funds tend to receive higher overall ratings from Value Research and Morning Star. In contrast, Bandhan receives favourable CRISIL ratings in specific periods.
Portfolio Analysis
Portfolio Overlapping Comparison
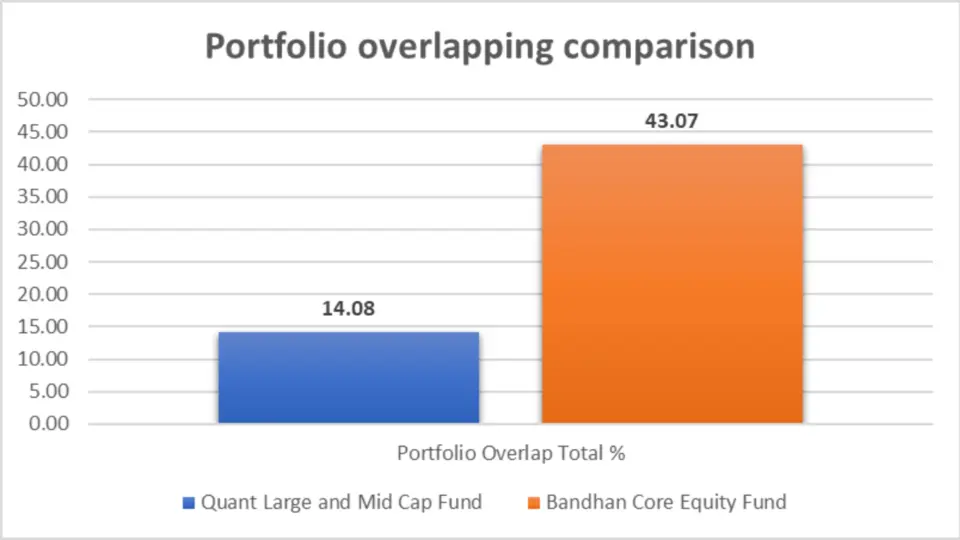
| Metric | Quant Large and Mid Cap Fund | Bandhan Core Equity Fund |
| Portfolio Overlap | 43.07% | 14.08% |
Analysis:
- Overlap: Quant has a higher portfolio overlap, indicating similar stock holdings within the large and mid-cap sectors.
Key Takeaways
- Higher Overlap: Quant Large and Mid Cap Fund shows a higher overlap percentage, suggesting a more concentrated investment strategy.
Portfolio Comparison
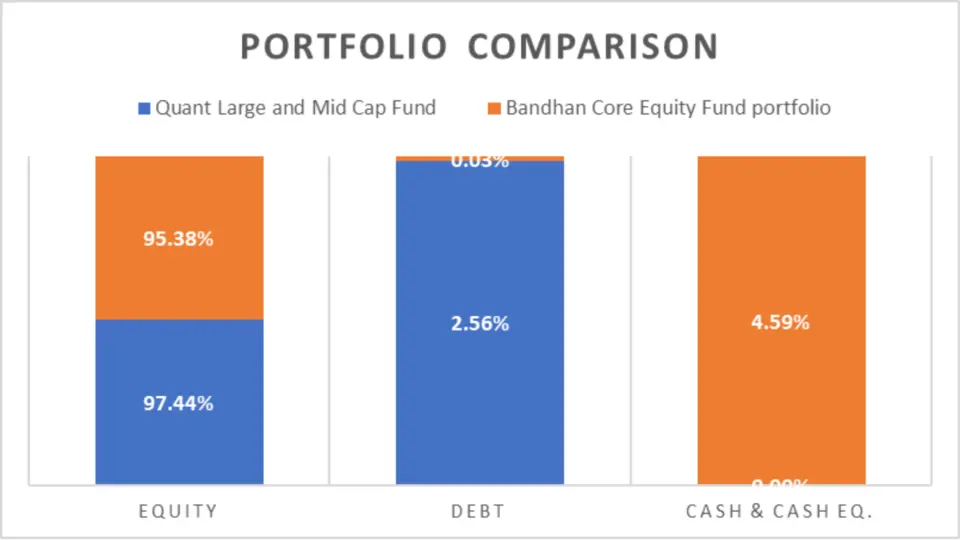
| Category | Quant Large and Mid Cap Fund | Bandhan Core Equity Fund |
| Equity | 97.44% | 95.38% |
| Debt | 2.56% | 0.03% |
| Cash & Cash Eq. | 0.00% | 4.59% |
Analysis:
- Equity Exposure: Quant has a slightly higher equity exposure at 97.44% compared to Bandhan’s 95.38%.
- Cash Holdings: Bandhan holds more cash and cash equivalents at 4.59% versus Quant’s 0.00%.
Key Takeaways
- Higher Equity Exposure: Quant Large and Mid Cap Funds have higher equity exposure, potentially leading to higher returns.
- Cash Holdings: Bandhan Core Equity Fund holds more cash, which could benefit liquidity and risk management.
Market Cap Allocation
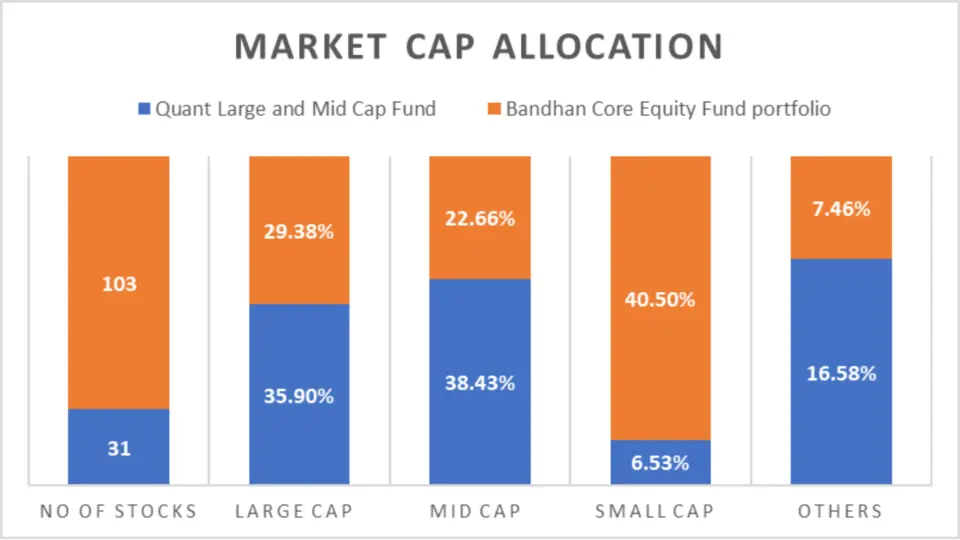
| Category | Quant Large and Mid Cap Fund | Bandhan Core Equity Fund |
| Large Cap | 35.90% | 29.38% |
| Mid Cap | 38.43% | 22.66% |
| Small Cap | 6.53% | 40.50% |
| Others | 16.58% | 7.46% |
Analysis:
- Large & Mid Cap: Quant allocates more in large and mid-cap stocks.
- Small Cap: Bandhan has a significant allocation in small-cap stocks at 40.50%.
Key Takeaways
- Diverse Cap Exposure: Quant Large and Mid Cap Fund shows balanced exposure across large and mid-cap stocks.
- Small Cap Focus: Bandhan Core Equity Fund strongly focuses on small-cap stocks, which could be more volatile but offer higher growth potential.
Sector Allocation
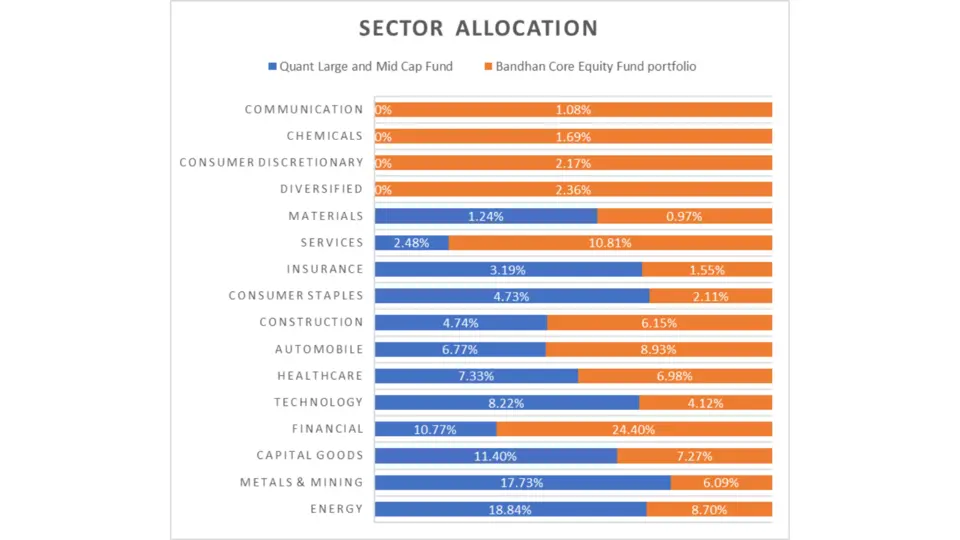
Sector Breakdown
Understanding where each fund allocates its resources can provide insights into its strategy and potential risks. Here’s how these funds compare across various sectors:
| Sector | Quant Large and Mid Cap Fund | Bandhan Core Equity Fund |
| Energy | 18.84% | 8.70% |
| Metals & Mining | 17.73% | 6.09% |
| Capital Goods | 11.40% | 7.27% |
| Financial | 10.77% | 24.40% |
| Technology | 8.22% | 4.12% |
| Healthcare | 7.33% | 6.98% |
| Automobile | 6.77% | 8.93% |
| Construction | 4.74% | 6.15% |
| Consumer Staples | 4.73% | 2.11% |
| Insurance | 3.19% | 1.55% |
| Services | 2.48% | 10.81% |
| Materials | 1.24% | 0.97% |
| Diversified | NA | 2.36% |
| Consumer Discretionary | NA | 2.17% |
| Chemicals | NA | 1.69% |
| Communication | NA | 1.08% |
Analysis
- Energy and Metals & Mining: Quantity significantly outperforms Bandhan in Energy (18.84% vs 8.70%) and Metals & Mining (17.73% vs 6.09%).
- Financial Sector: Bandhan has a heavy allocation in Financials at 24.40%, compared to Quant’s 10.77%.
- Services Sector: Bandhan also focuses more on Services, with 10.81% compared to Quant’s 2.48%.
Key Takeaways
- Diversification: Quant is heavily invested in Energy, Metals, & Mining, which could provide high returns in these sectors.
- Financials and Services: Bandhan’s strong focus on Financials and Services indicates a different risk and growth strategy, potentially offering more Stability.
Fund Management Comparison
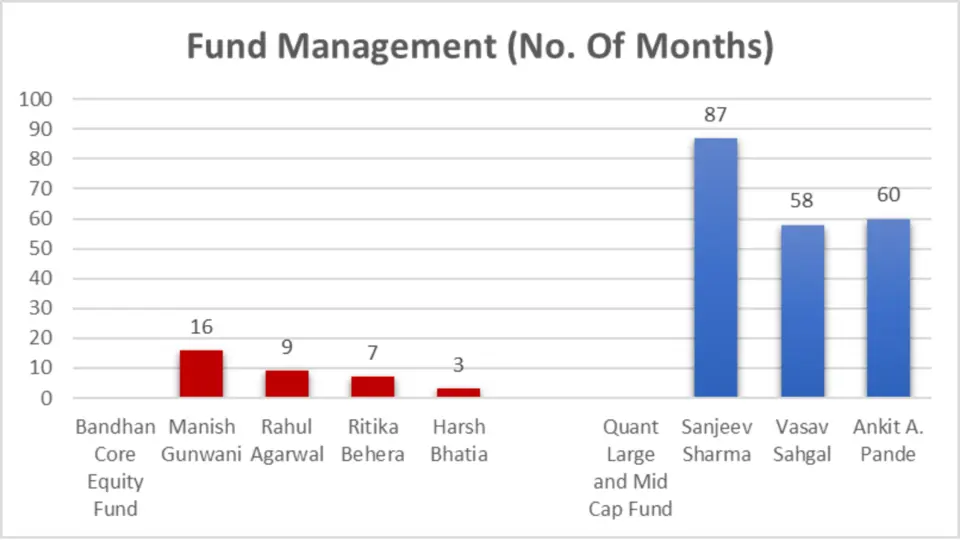
Fund Managers
Effective fund management can make or break investment performance. Here’s a look at the managers behind these funds:
| Fund | Fund Manager | No. Of Months |
| Bandhan Core Equity Fund | Manish Gunwani | 16 |
| Rahul Agarwal | 9 | |
| Ritika Behera | 7 | |
| Harsh Bhatia | 3 | |
| Quant Large and Mid Cap Fund | Sanjeev Sharma | 87 |
| Vasav Sahgal | 58 | |
| Ankit A. Pande | 60 |
Analysis
- Experience: Quant’s managers, particularly Sanjeev Sharma (87 months) and Ankit A. Pande (60 months), bring extensive experience.
- Diversity: Bandhan has a relatively newer team, which might bring fresh perspectives but with less tenure than Quant’s team.
Key Takeaways
- Experienced Team: Quant benefits from a highly skilled management team.
- Fresh Perspectives: Bandhan’s newer management might offer innovative strategies and adaptability.
Other Important Details

Key Metrics
Understanding the key metrics helps assess the fund’s Performance and cost-effectiveness.
| Metric | Quant Large and Mid Cap Fund | Bandhan Core Equity Fund |
| NAV | 123.21 | 127.79 |
| AUM (in Cr.) | 2110 | 4022 |
| Expense Ratio (%) | 0.75 | 0.74 |
| Turnover | 389.00% | 172% |
| Benchmark | NIFTY 100 | NIFTY 200 |
Minimum Investment Amount
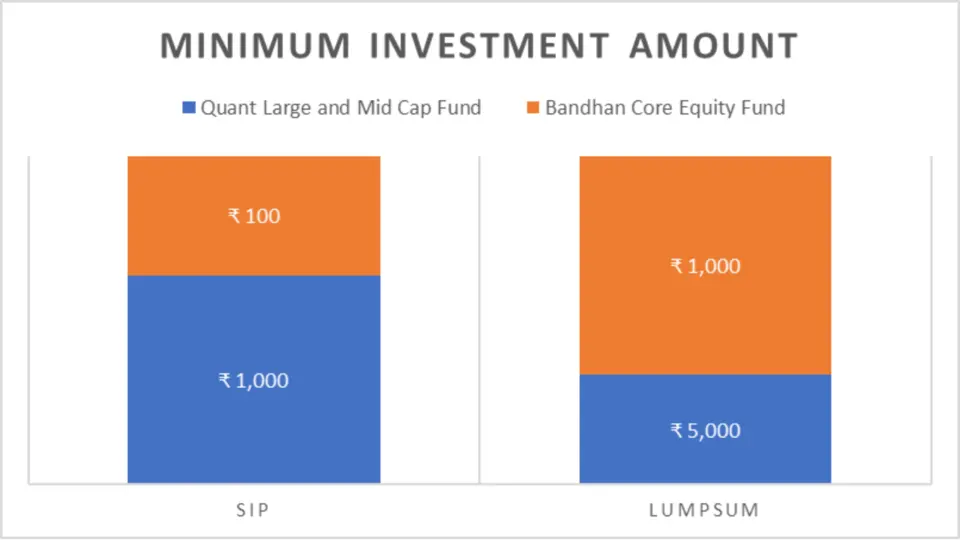
| Investment Type | Quant Large and Mid Cap Fund | Bandhan Core Equity Fund |
| SIP | ₹ 1,000 | ₹ 100 |
| Lumpsum | ₹ 5,000 | ₹ 1,000 |
Analysis
- Expense Ratio: Both funds have similar expense ratios, indicating comparable cost efficiency.
- Turnover: Quant has a higher turnover rate of 389%, suggesting a more active management strategy than Bandhan’s 172%.
- Investment Flexibility: Bandhan offers lower minimum investment amounts, making it more accessible for smaller investors.
Key Takeaways
- Active Management: Quant’s higher turnover indicates a more actively managed fund, which could provide higher returns.
- Accessibility: Bandhan’s lower minimum investment requirements make it easier for new investors to start.
Conclusion
The Quant Large and Mid Cap Fund generally outperforms the Bandhan Core Equity Fund across most parameters, including sector allocation, fund management experience, risk-adjusted returns, and active management strategy. This makes it a superior choice for investors seeking higher returns and are comfortable with a more active management approach.
However, for investors with a lower risk appetite who prefer a more diversified investment in financials and services and seek accessibility through lower minimum investment amounts, the Bandhan Core Equity Fund stands out as a more suitable option. Each fund provides different risk profiles and investment strategies, enabling investors to choose based on their financial goals and risk tolerance.

FAQs: Quant Large and Mid Cap Fund vs Bandhan Core Equity Fund
1. Which fund has better short-term Performance?
Quant Large and Mid Cap Fund outperform in the short-term, showing higher returns over 1 year compared to Bandhan Core Equity Fund. For example, the Quant fund delivered 63.99% returns compared to Bandhan’s 56.04% last year.
2. How do these funds perform over the mid-term (2-3 years)?
While Bandhan Core Equity Fund slightly leads in the 2 years with returns of 30.01% compared to Quant’s 29.92%, Quant Large and Mid Cap Fund takes the lead over 3 years, showing better overall mid-term Stability.
3. Which fund is better for long-term investments (5-10 years)?
Quant Large and Mid Cap Fund consistently outperforms Bandhan Core Equity Fund long-term. Over 5 years, Quant delivered 26.80% returns compared to Bandhan’s 21.18%, and over 10 years, Quant achieved 23.34% compared to Bandhan’s 18.07%.
4. What are the SIP returns for these funds?
Quant Large and Mid Cap Fund show strong Performance in SIP returns, outperforming Bandhan Core Equity Fund in all periods from 1 year to 10 years. For instance, the SIP return for Quant over 10 years is 22.58% compared to Bandhan’s 19.30%.
5. How do the funds compare in terms of lumpsum investment value?
Quant Large and Mid Cap Funds generally offer higher returns across various periods for lumpsum investments. For example, a 10-year lumpsum investment in Quant grows to ₹3,96,041.47, significantly higher than Bandhan’s ₹3,31,764.48.
6. Which fund has a higher Compound Annual Growth Rate (CAGR)?
Quant Large and Mid Cap Fund has a higher CAGR across all periods. For example, its 5-year CAGR is 26.00%, surpassing Bandhan’s 20.52%.
7. What are the rolling returns of these funds?
Quant Large and Mid Cap Fund demonstrates superior rolling returns over 1, 3, 5, and 9 years, indicating more consistent Performance than Bandhan Core Equity Fund.
8. How do the funds perform annually?
While Bandhan Core Equity Fund outperforms in specific years (e.g., 2023 with 37.83% returns), Quant Large and Mid Cap Fund shows better resilience and Performance during challenging periods, such as 2022 and 2020.
9. Which fund is more volatile?
Bandhan Core Equity Fund exhibits greater volatility and larger declines during significant market downturns. For instance, in Q1 2020, Bandhan declined by -30.13%, compared to Quant’s -19.29%.
10. What is the maximum drawdown for these funds?
Over 5 years, Quant Large and Mid Cap Fund have had a lower maximum drawdown of -21.82%, indicating better resilience than Bandhan’s -31.55%.
11. How do these funds perform quarterly?
Quant Large and Mid Cap Funds show more frequent and consistent outperformance across various quarters, making them attractive for investors seeking robust returns. For instance, in Q1 2024, Quant led with 12.33% compared to Bandhan’s 7.62%.
12. What are the risk-adjusted returns for these funds?
Quant Large and Mid Cap Funds have superior risk-adjusted returns, with higher Sharpe and Sortino ratios. Its Sharpe ratio for 3 years is 1.52, compared to Bandhan’s 1.44.
13. Which fund shows better alpha performance?
Quant Large and Mid Cap Funds consistently show higher alpha values, indicating better Performance relative to the market. For example, its 3-year alpha is 10.98 compared to Bandhan’s 7.27.
14. How do the funds’ beta values compare?
Quant Large and Mid Cap Funds generally have lower beta values, indicating less sensitivity to market volatility over more extended periods. For instance, its 10-year beta is 0.88 compared to Bandhan’s 1.00.
15. What are the sector allocations for these funds?
Quant Large and Mid Cap Funds are heavily invested in Energy (18.84%) and Metals & Mining (17.73%). In contrast, Bandhan Core Equity Fund focuses more on Financials (24.40%) and Services (10.81%).
16. Who manages these funds, and what is their experience?
Quant Large and Mid Cap Fund is handled by a highly experienced team, including Sanjeev Sharma (87 months) and Ankit A. Pande (60 months). Bandhan Core Equity Fund has a relatively newer team, including Manish Gunwani (16 months) and Rahul Agarwal (9 months).
17. What are these funds’ key metrics like NAV, AUM, and expense ratio?
Quant Large and Mid Cap Fund has a NAV of ₹123.21, AUM of ₹2110 Cr., and an expense ratio of 0.75%. Bandhan Core Equity Fund has a NAV of ₹127.79, AUM of ₹4022 Cr., and an expense ratio of 0.74%.
18. What is the minimum investment amount for these funds?
Quant Large and Mid Cap Fund requires ₹1,000 for SIP, whereas Bandhan Core Equity Fund requires ₹100. For lumpsum investments, Quant requires ₹5,000, and Bandhan requires ₹1,000
Disclaimer:
The information provided in this article is solely the author/advertisers’ opinion and not investment advice – it is provided for educational purposes only. Using this, you agree that the information does not constitute any investment or financial instructions by Ace Equity Research/Mutual Fund Focus/IPO First and the team. Anyone wishing to invest should seek their own independent financial or professional advice. Conduct your research with registered financial advisors before making any investment decisions. Ace Equity Research/ Mutual Fund Focus / IPO First and the team are not accountable for the investment views provided in the article.
Mutual Fund investments are subject to market risks. Read all scheme-related documents carefully.
Investments in the securities market are subject to market risks. Read all the related documents carefully before investing
