Investment Style
Both funds follow a growth-oriented investment style, which is laser-focused on identifying companies with solid growth potential in the mid-cap space. Mid-cap funds typically invest in companies that are not as big as large caps but have a higher growth potential than small caps. These funds are significant for long-term investors seeking to capitalize on companies that can become large caps.
| Fund Name | Investment Style |
| Quant Mid Cap Fund | Growth |
| Mahindra Manulife Mid Cap Fund | Growth |

Returns Analysis:
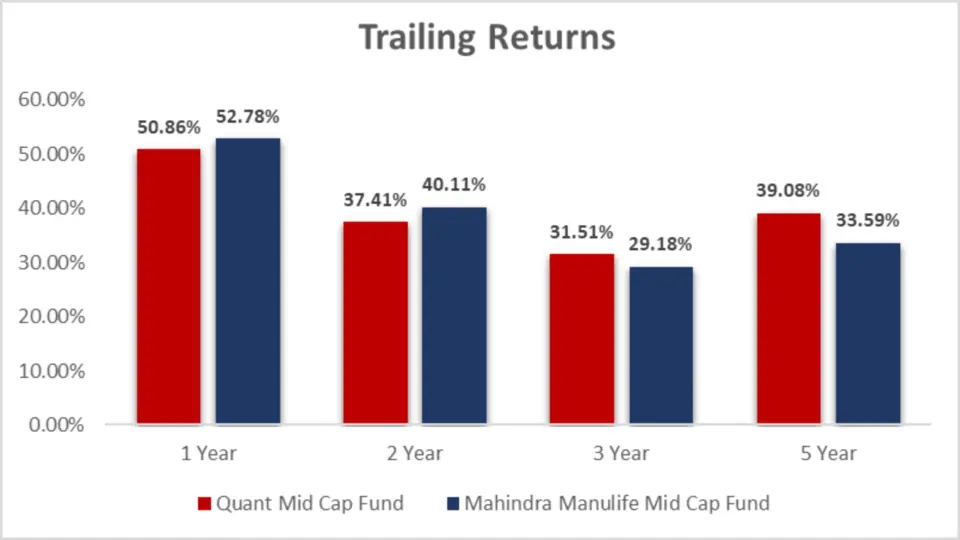
Trailing Returns
| Period Invested For | Quant Mid Cap Fund Returns | Mahindra Manulife Mid Cap Fund Returns |
| 1 Year | 50.86% | 52.78% |
| 2 Year | 37.41% | 40.11% |
| 3 Year | 31.51% | 29.18% |
| 5 Year | 39.08% | 33.59% |
| 10 Year | Not Available | Not Available |
Analysis
- 1-Year Returns: Mahindra Manulife takes the lead here with a 52.78% return, just nudging past Quant’s 50.86%. If you’re looking at short-term performance, Mahindra Manulife looks slightly better.
- 2-Year Returns: Mahindra Manulife shines with 40.11%, compared to Quant’s 37.41%.
- 3-Year Returns: Quant Mid Cap Fund grabs the win here with 31.51%, beating Mahindra Manulife’s 29.18%. For mid-term returns, Quant seems like a stronger contender.
- 5-Year Returns: Quant Mid Cap Fund takes a solid lead over the long run with 39.08%, compared to Mahindra’s 33.59%. If you’re in it for the long haul, Quant Mid Cap Fund seems more consistent.
Key Takeaways:
- Mahindra Manulife shines in the short-term (1-year, 2-year returns), but Quant Mid Cap Fund pulls ahead when looking at the mid-term (3-year) and long-term (5-year) horizons.
- This is where Quant Mid Cap Fund starts showing its strength, with 31.51% returns, beating
- Mahindra Manulife’s 29.18%. If you’re in for the mid-term, Quant is the better choice.
Lumpsum Investment Value:
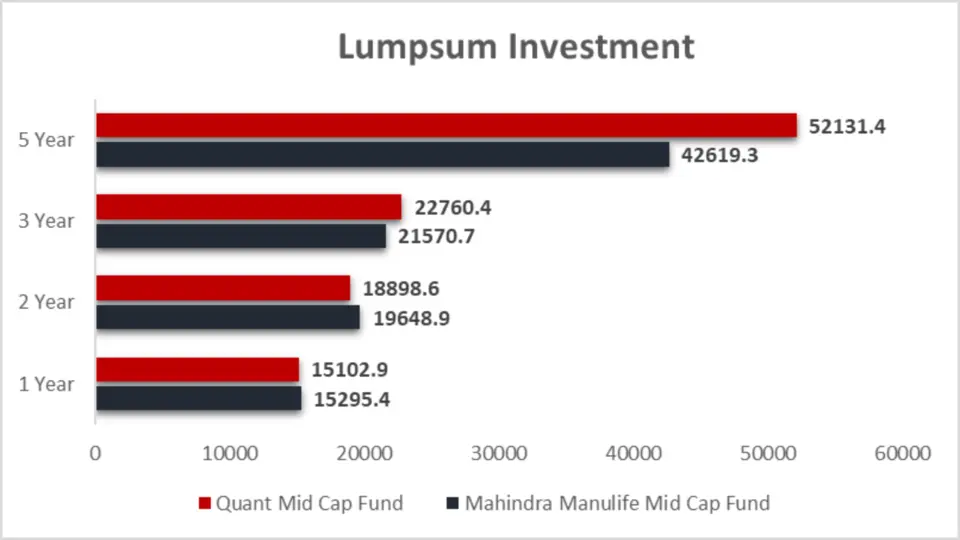
| Period Invested For | Quant Mid Cap Fund Value | Mahindra Manulife Mid Cap Fund Value |
| 1 Year | ₹15,102.9 | ₹15,295.4 |
| 2 Year | ₹18,898.6 | ₹19,648.9 |
| 3 Year | ₹22,760.4 | ₹21,570.7 |
| 5 Year | ₹52,131.4 | ₹42,619.3 |
Analysis
- 1-Year Investment: Mahindra Manulife wins here with your ₹10,000 growing to ₹15,295.4, compared to ₹15,102.9 for Quant. A slight edge for Mahindra Manulife, but not a huge difference.
- 2-Year Investment: Again, Mahindra Manulife shows slightly better growth, with ₹19,648.9, while Quant comes in at ₹18,898.6.
- 3-Year Investment: Quant Mid Cap Fund turns the tables with a total value of ₹22,760.4, beating Mahindra’s ₹21,570.7. For mid-term lumpsum investments, Quant performs better.
- 5-Year Investment: Quant Mid Cap Fund crushes it here with ₹52,131.4, compared to Mahindra Manulife’s ₹42,619.3. A significant difference of almost ₹10,000! If you’re a long-term investor, Quant clearly emerges as the winner.
Key Takeaways:
- Mahindra Manulife leads for short-term lumpsum investments (1-year, 2-year).
- Quant Mid Cap Fund dominates for mid-term (3-year) and long-term (5-year) investments, especially with a remarkable ₹10,000 difference over 5 years!
SIP Returns:
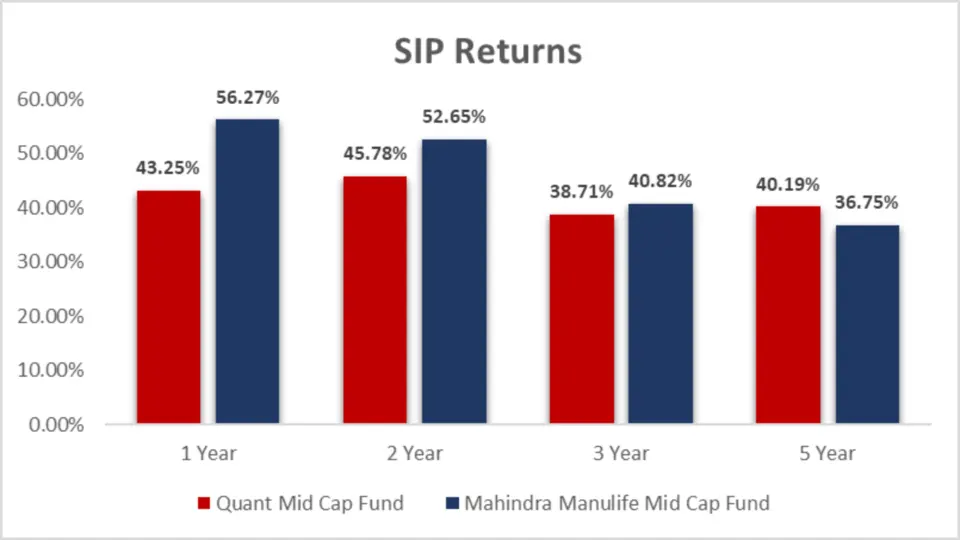
| Period Invested For | Quant Mid Cap Fund | Mahindra Manulife Mid Cap Fund |
| 1 Year | 43.25% | 56.27% |
| 2 Year | 45.78% | 52.65% |
| 3 Year | 38.71% | 40.82% |
| 5 Year | 40.19% | 36.75% |
Analysis
- 1-Year SIP Returns: Mahindra Manulife takes the lead with an impressive 56.27% return, compared to Quant’s 43.25%. If you’re looking for short-term returns, Mahindra Manulife has clearly outperformed Quant.
- 2-Year SIP Returns: Once again, Mahindra Manulife outperforms Quant, delivering 52.65% compared to Quant’s 45.78%.
- 3-Year SIP Returns: The gap closes as Mahindra Manulife delivers 40.82%, only slightly better than Quant’s 38.71%.
- 5-Year SIP Returns: This is where Quant Mid Cap Fund shines, with 40.19% returns compared to Mahindra Manulife’s 36.75%. Quant Mid Cap Fund offers more consistent returns if you’re investing for the long term.
Key Takeaways:
- Short-Term (1-2 years): Mahindra Manulife Mid Cap Fund dominates with higher returns in both 1-year and 2-year periods.
- Mid-Term (3 years): The difference between the two funds becomes more petite, with Mahindra Manulife maintaining a slight edge.
- Long-Term (5 years): Quant Mid Cap Fund takes the crown, offering more stable and consistent returns for long-term SIP investors.
SIP Investment Value:

| Period Invested For | Investments (₹) | Quant Mid Cap Fund | Mahindra Manulife Mid Cap Fund |
| 1 Year | 12,000 | 14,664.25 | 15,418 |
| 2 Year | 24,000 | 36,420.14 | 38,445.7 |
| 3 Year | 36,000 | 62,087.58 | 63,787.44 |
| 5 Year | 60,000 | 1,59,205.34 | 1,47,057.1 |
Analysis
- 1-Year SIP Investment: Your ₹12,000 investment in Mahindra Manulife would have grown to ₹15,418, compared to ₹14,664.25 in Quant Mid Cap Fund. A slight edge for Mahindra.
- 2-Year SIP Investment: With a ₹24,000 investment, Mahindra Manulife gives you ₹38,445.7, while Quant gives ₹36,420.14. Once again, Mahindra is ahead.
- 3-Year SIP Investment: The story is similar for 3-year investments—Mahindra Manulife takes the lead with ₹63,787.44, while Quant Mid Cap Fund provides ₹62,087.58.
- 5-Year SIP Investment: Over the long haul, Quant Mid Cap Fund clearly takes the crown, growing your ₹60,000 investment to ₹1,59,205.34, significantly more than Mahindra’s ₹1,47,057.1. Quant Mid Cap Fund is a solid choice if you play the long game.
key takeaways
- Short-Term (1-3 years): Mahindra Manulife Mid Cap Fund consistently provides better results for short-term SIPs.
- Long-Term (5 years): Quant Mid Cap Fund is the clear winner, with a significantly higher investment value over a 5-year horizon.
CAGR Comparison:
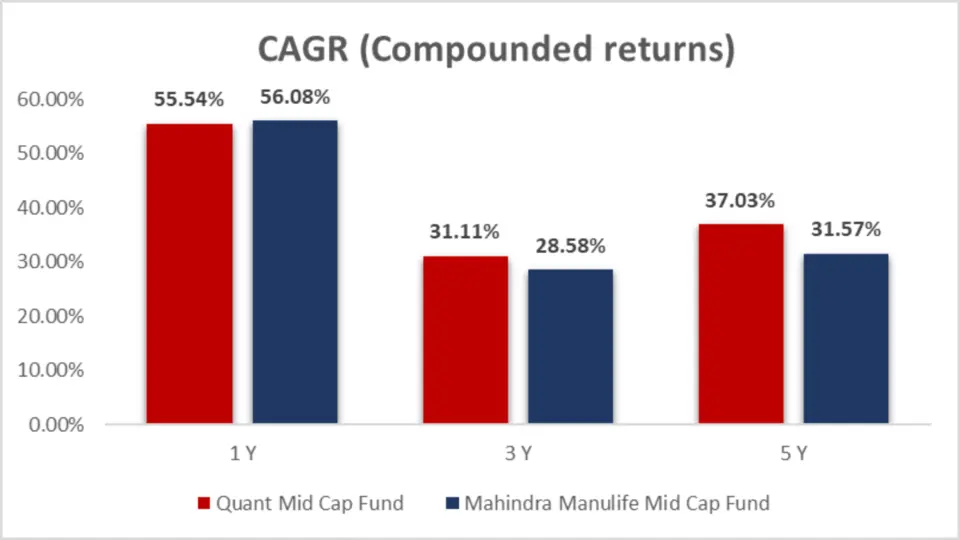
| Category | 1 Year CAGR | 3 Year CAGR | 5 Year CAGR |
| Quant Mid Cap Fund | 55.54% | 31.11% | 37.03% |
| Mahindra Manulife Mid Cap Fund | 56.08% | 28.58% | 31.57% |
Analysis
- 1-Year CAGR: Mahindra Manulife has a slight edge at 56.08% versus Quant at 55.54%. Both are solid performances for short-term growth, but Mahindra has a slight upper hand.
- 3-Year CAGR: Quant Mid Cap Fund pulls ahead with 31.11%, beating Mahindra’s 28.58%. This suggests that Quant has performed better in the medium term.
- 5-Year CAGR: Quant Mid Cap Fund is again the winner with 37.03%, outpacing Mahindra Manulife’s 31.57%. Over the long term, Quant Mid Cap Fund has consistently generated better returns, making it the superior choice for investors with a long horizon.
key takeaways:
CAGR: Mahindra Manulife has a slight advantage in the 1-year CAGR, meaning it has grown faster over the past year.
CAGR: For a 3-year CAGR, Quant Mid Cap Fund wins by a noticeable margin, showing more substantial growth over the medium term.
CAGR: Over 5 years, Quant Mid Cap Fund clearly outperforms with a 37.03% CAGR, compared to Mahindra’s 31.57%.
Rolling Returns
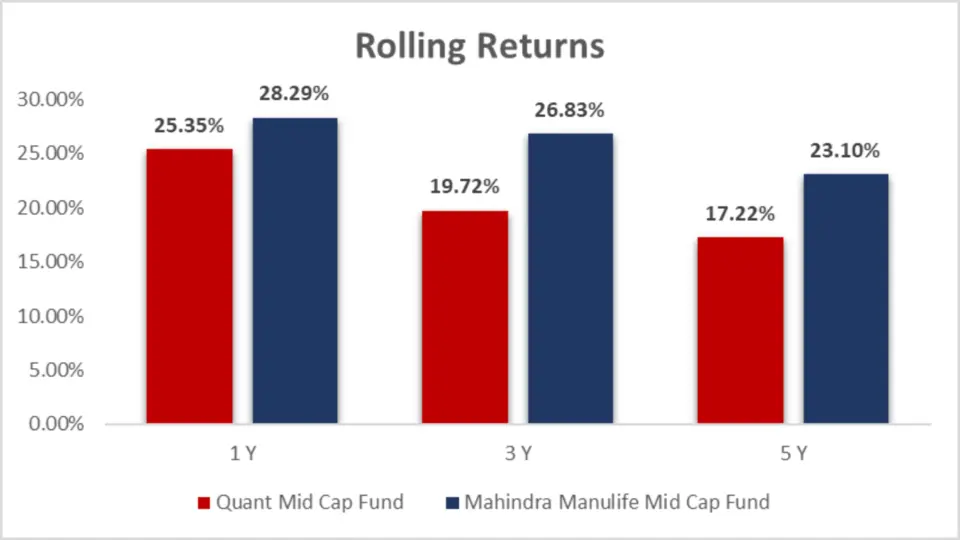
| Category | 1-Year Rolling Returns | 3 Year Rolling Returns | 5 Year Rolling Returns |
| Quant Mid Cap Fund | 25.35% | 19.72% | 17.22% |
| Mahindra Manulife Mid Cap Fund | 28.29% | 26.83% | 23.10% |
Analysis:
- 1-Year Rolling Returns: Mahindra Manulife comes out on top here, with 28.29% compared to Quant’s 25.35%. If you’re focusing on shorter periods, Mahindra has provided slightly better rolling returns.
- 3-Year Rolling Returns: The trend continues as Mahindra Manulife pulls ahead again with 26.83% versus Quant’s 19.72%. This indicates that Mahindra has delivered more stable returns over the medium term.
- 5-Year Rolling Returns: Over 5 years, Mahindra Manulife Mid Cap Fund remains the leader with 23.10%, outperforming Quant Mid Cap Fund’s 17.22%.
Annualized/Calendar Year Returns
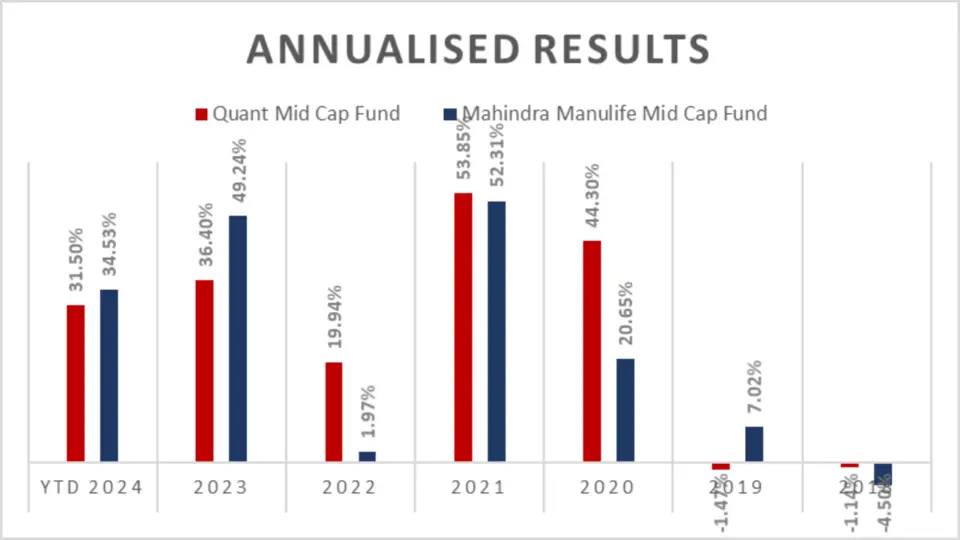
| Period | Quant Mid Cap Fund | Mahindra Manulife Mid Cap Fund |
| YTD 2024 | 31.50% | 34.53% |
| 2023 | 36.40% | 49.24% |
| 2022 | 19.94% | 1.97% |
| 2021 | 53.85% | 52.31% |
| 2020 | 44.30% | 20.65% |
| 2019 | -1.47% | 7.02% |
| 2018 | -1.14% | -4.50% |
Analysis
- YTD 2024: Mahindra Manulife leads with a 34.53% return, compared to Quant’s 31.50%. Short-term performance favours Mahindra.
- 2023: Mahindra Manulife outperforms significantly with 49.24% compared to Quant’s 36.40%. Mahindra’s growth in 2023 was solid.
- 2022: Quant Mid Cap Fund wins here with a 19.94% return, while Mahindra Manulife struggled, posting only 1.97%.
- 2021: Quant slightly edges ahead with 53.85%, just beating Mahindra Manulife’s 52.31%. Both funds had excellent performance this year.
- 2020: Quant shines again, delivering 44.30%, more than double Mahindra Manulife’s 20.65%. This year was clearly in favour of Quant.
- 2019: A rough year for Quant, posting a 1.47% return, while Mahindra Manulife saw a modest 7.02% return.
- 2018: Both funds faced declines, but Mahindra Manulife dropped more by 4.50% compared to Quant’s at 1.14%.
Quick Breakdown of Calendar Year Returns:
- YTD 2024:
- Quant Mid Cap Fund: 31.50%
- Mahindra Manulife Mid Cap Fund: 34.53%
- Winner: Mahindra Manulife, slightly outperforming Quant with 34.53% compared to 31.50%. Short-term investors would find Mahindra more appealing based on the year-to-date performance.
- 2023:
- Quant Mid Cap Fund: 36.40%
- Mahindra Manulife Mid Cap Fund: 49.24%
- Winner: Mahindra Manulife, significantly ahead with 49.24% versus Quant’s 36.40%. Mahindra showed more robust growth in 2023, making it the better performer that year.
- 2022:
- Quant Mid Cap Fund: 19.94%
- Mahindra Manulife Mid Cap Fund: 1.97%
- Winner: Quant Mid Cap Fund clearly outperformed Mahindra, which had a subdued year with just 1.97% returns compared to Quant’s 19.94%.
- 2021:
- Quant Mid Cap Fund: 53.85%
- Mahindra Manulife Mid Cap Fund: 52.31%
- Winner: Quant, edging out Mahindra with 53.85% vs. 52.31%. Both funds performed remarkably well, but Quant was slightly more potent.
- 2020:
- Quant Mid Cap Fund: 44.30%
- Mahindra Manulife Mid Cap Fund: 20.65%
- Winner: Quant, delivering more than double the Return of Mahindra Manulife in 2020, with a return of 44.30% compared to Mahindra’s 20.65%.
- 2019:
- Quant Mid Cap Fund: -1.47%
- Mahindra Manulife Mid Cap Fund: 7.02%
- Winner: Mahindra Manulife saw a positive return of 7.02%, while Quant posted a negative return of -1.47%.
- 2018:
- Quant Mid Cap Fund: -1.14%
- Mahindra Manulife Mid Cap Fund: -4.50%
- Winner: Quant, with a smaller decline of -1.14%, compared to Mahindra’s steeper decline of -4.50%.
key takeaways:
- Short-Term Performance (YTD 2024, 2023): Mahindra Manulife outperformed in the recent years, particularly in 2023 and YTD 2024, making it a better option for short-term investors.
- Medium-Term Performance (2021-2022): Quant Mid Cap Fund shines, delivering solid returns in both 2021 and 2022.
- Long-Term Stability (2018-2020): Quant Mid Cap Fund shows more resilience, especially during difficult years like 2018 and 2020, where it performed significantly better than Mahindra Manulife.
Maximum Drawdown

| Period | Quant Mid Cap Fund | Mahindra Manulife Mid Cap Fund |
| 3-Year Drawdown | -11.57% | -12.13% |
| 5-Year Drawdown | -25.63% | -24.43% |
Analysis
- 3-Year Drawdown: Quant Mid Cap Fund had a slightly lower drawdown of -11.57% compared to Mahindra’s -12.13%, meaning Quant experienced less of a drop during market declines over the last 3 years.
- 5-Year Drawdown: While both funds experienced significant drawdowns, Quant saw a larger -25.63% drawdown compared to Mahindra’s -24.43% over the 5 years. This suggests that Quant faced greater long-term volatility.
key takeaways:
- 3-Year Perspective: Quant Mid Cap Fund experienced a smaller drawdown in the last 3 years, implying it was slightly less volatile during short-term market corrections.
- 5-Year Perspective: Mahindra Manulife Mid Cap Fund had a lower drawdown over the long term, suggesting it handled longer-term volatility better than Quant.
Quarterly Results
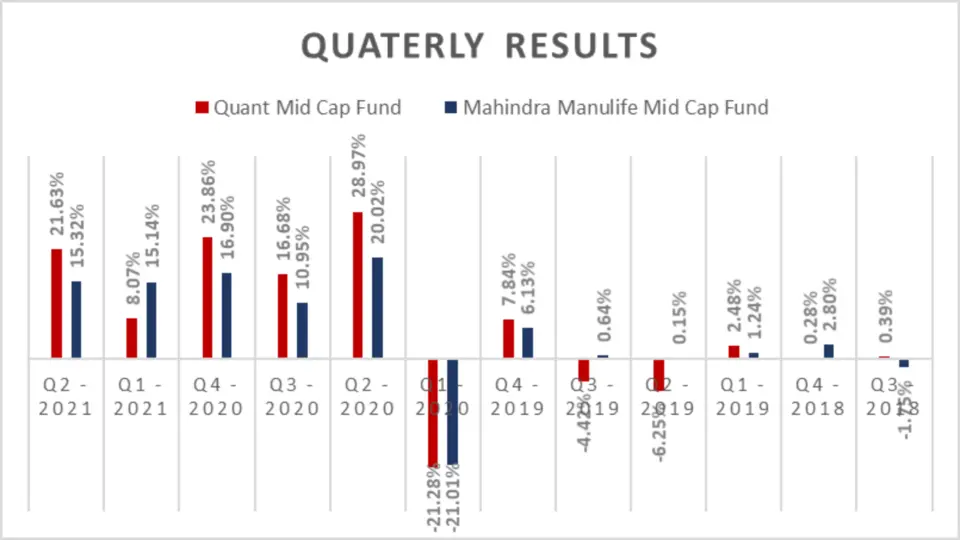

| Period | Quant Mid Cap Fund | Mahindra Manulife Mid Cap Fund |
| Q2 – 2024 | 14.07% | 16.49% |
| Q1 – 2024 | 13.27% | 6.23% |
| Q4 – 2023 | 12.41% | 12.93% |
| Q3 – 2023 | 16.22% | 14.54% |
| Q2 – 2023 | 12.70% | 16.96% |
| Q1 – 2023 | -7.36% | -1.31% |
| Q4 – 2022 | 6.79% | 0.82% |
| Q3 – 2022 | 16.91% | 14.15% |
| Q2 – 2022 | -12.53% | -12.24% |
| Q1 – 2022 | 8.30% | -0.45% |
| Q4 – 2021 | 4.74% | 2.78% |
| Q3 – 2021 | 8.42% | 9.54% |
| Q2 – 2021 | 21.63% | 15.32% |
| Q1 – 2021 | 8.07% | 15.14% |
| Q4 – 2020 | 23.86% | 16.90% |
| Q3 – 2020 | 16.68% | 10.95% |
| Q2 – 2020 | 28.97% | 20.02% |
| Q1 – 2020 | -21.28% | -21.01% |
| Q4 – 2019 | 7.84% | 6.13% |
| Q3 – 2019 | -4.42% | 0.64% |
| Q2 – 2019 | -6.25% | 0.15% |
| Q1 – 2019 | 2.48% | 1.24% |
| Q4 – 2018 | 0.28% | 2.80% |
| Q3 – 2018 | 0.39% | -1.75% |
Analysis
- Q2 2024: Mahindra Manulife outperforms with a return of 16.49% compared to Quant’s 14.07%. Short-term gains show Mahindra’s strength.
- Q1 2024: Quant Mid Cap Fund pulls ahead with a significant 13.27% return versus Mahindra’s 6.23%.
- Q4 2023: Both funds show similar performance, with Mahindra Manulife slightly leading at 12.93% vs. Quant’s 12.41%.
- Q3 2023: Quant Mid Cap Fund takes the lead with 16.22%, edging out Mahindra’s 14.54%.
- 2023 Overall: Mahindra Manulife Mid Cap Fund had a more robust overall year, notably performing better in Q2 and Q1.
- 2022: Quant Mid Cap Fund was more consistent in 2022, outperforming Mahindra in Q4 (6.79%) and Q3 (16.91%). However, both funds faced significant losses in Q2 2022, with Quant posting -12.53% and Mahindra posting -12.24%.
- 2021: Quant Mid Cap Fund dominates this year, especially in Q2 (21.63%) and Q4 (23.86%), showing excellent recovery and performance through volatile periods.
- 2020: A year of recovery from the pandemic, Quant Mid Cap Fund shines with a 28.97% return in Q2, compared to Mahindra’s 20.02%.
Total and Average Return Comparison
| Metric | Quant Mid Cap Fund | Mahindra Manulife Mid Cap Fund |
| Total Return | 172.19% | 146.97% |
| Average Return | 7.17% | 6.12% |
Analysis
- Total Return: Over the period, Quant Mid Cap Fund provides a higher total return of 172.19%, compared to Mahindra Manulife’s 146.97%.
- Average Return: Quant also leads in average Return with 7.17%, while Mahindra Manulife posts 6.12%. For long-term investors, Quant shows a more consistent ability to generate returns.
Outperformance Comparison
| Category | Quant Mid Cap Fund | Mahindra Manulife Mid Cap Fund |
| Total Outperformance | 13 | 11 |
| Outperformance in the Next 11 Quarters | 6 | 6 |
| Outperformance in First 11 Quarters | 7 | 5 |
Analysis:
- Total Outperformance: Quant Mid Cap Fund has outperformed 13 times compared to Mahindra Manulife’s 11 times during the given period. This shows that Quant has a slight edge in overall quarterly performance.
- Even Split in Next 11 Quarters: Both funds were tied for outperformance in the most recent 11 quarters, showing that Mahindra Manulife has closed the gap recently.
- Quant’s Dominance in Early Quarters: In the first 11 quarters, Quant Mid Cap Fund led more frequently, with 7 outperformances compared to Mahindra’s 5.
Key Takeaways:
Short-Term Performance (Q1-Q2 2024): Mahindra Manulife Mid Cap Fund outshined in Q2 2024. Quant Mid Cap Fund performed much better in Q1 2024, making both strong contenders for recent performance.
Long-Term Performance: Quant Mid Cap Fund is the clear winner regarding total and average returns, providing more muscular long-term gains for investors.
Outperformance Consistency: Quant Mid Cap Fund has consistently outperformed Mahindra, especially in earlier quarters, indicating better adaptability to market conditions during the start of the measured period.
Risk Analysis


| Metric | Quant Mid Cap Fund | Mahindra Manulife Mid Cap Fund |
| Mean Return (%) | 30.19% | 27.92% |
| Sortino Ratio | 2.45 | 2.50 |
Analysis:
- Mean Return:
- Quant Mid Cap Fund leads with a Mean Return of 30.19%, compared to Mahindra Manulife Mid Cap Fund’s 27.92%. This suggests that Quant has delivered slightly better returns on average.
- Sortino Ratio:
- While Quant has higher mean returns, Mahindra Manulife Mid Cap Fund has a marginally better Sortino Ratio (2.50 vs 2.45). This indicates that Mahindra has been slightly better at managing downside risk, providing more stable risk-adjusted returns.
Key Takeaways:
- Quant Mid Cap Fund: Quant offers better performance on a pure return basis if you’re chasing higher average returns and can tolerate a bit more risk.
- Mahindra Manulife Mid Cap Fund: On the other hand, Mahindra provides better downside risk management, making it more stable during market downturns.
Standard Deviation:
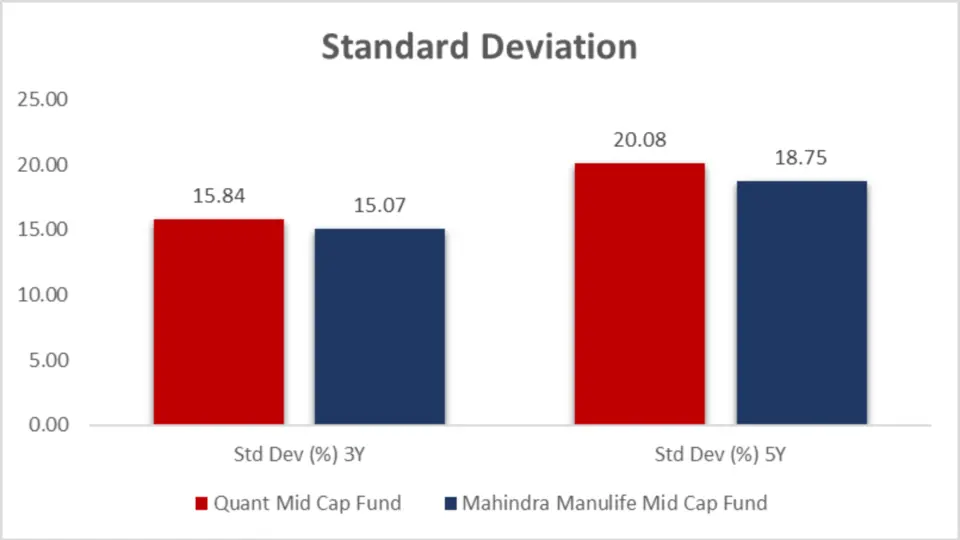
| Metric | Quant Mid Cap Fund | Mahindra Manulife Mid Cap Fund |
| Standard Deviation (%) 3Y | 15.84% | 15.07% |
| Standard Deviation (%) 5Y | 20.08% | 18.75% |
Analysis:
- 3-Year Standard Deviation:
- Mahindra Manulife Mid Cap Fund has a lower Standard Deviation (15.07%) over 3 years than Quant’s 15.84%. This indicates that Mahindra has been less volatile and more stable in the recent short-to-mid-term period.
- 5-Year Standard Deviation:
- Over a longer 5-year period, Mahindra Manulife Mid Cap Fund again shows lower volatility with an 18.75% Standard Deviation, compared to Quant Mid Cap Fund’s 20.08%.
Key Takeaways:
- Mahindra Manulife Mid Cap Fund shows lower volatility both over the short term (3 years) and long term (5 years). This makes Mahindra a better choice for investors who prefer Stability and want to avoid the highs and lows of a more volatile fund.
- While delivering higher mean returns, Quant Mid Cap Fund comes with higher volatility. Suppose you’re an investor with a higher risk tolerance and looking for higher potential returns. In that case, Quant may still appeal to you despite its slightly higher risk.
Sharpe Ratio

| Period | Quant Mid Cap Fund | Mahindra Manulife Mid Cap Fund |
| Sharpe Ratio (3Y) | 1.55 | 1.48 |
| Sharpe Ratio (5Y) | 1.52 | 1.39 |
Analysis
- 3-Year Sharpe Ratio: Quant Mid Cap Fund comes out on top with a 1.55 Sharpe ratio, compared to Mahindra’s 1.48. This shows that Quant has provided better returns relative to risk over the past 3 years.
- 5-Year Sharpe Ratio: Over the more extended 5-year period, Quant Mid Cap Fund maintains its lead with a 1.52 Sharpe ratio, outperforming Mahindra Manulife’s 1.39. This confirms that Quant has consistently delivered higher risk-adjusted returns over time.
Key Takeaways:
- Quant Mid Cap Fund consistently offers better risk-adjusted returns, with a higher Sharpe Ratio over both 3 and 5 years. This makes it an appealing option for investors who are looking for higher returns without taking on excessive risk.
Beta
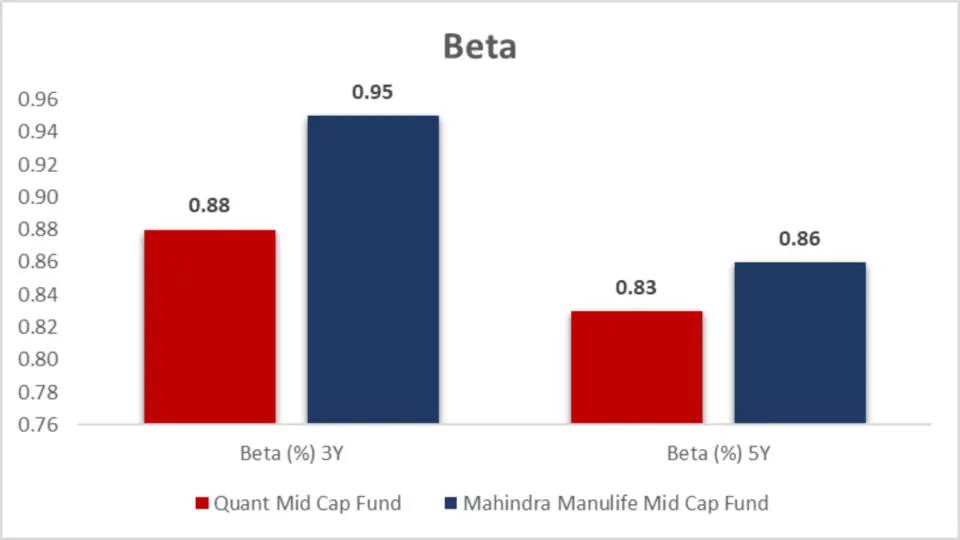
| Period | Quant Mid Cap Fund | Mahindra Manulife Mid Cap Fund |
| Beta (3Y) | 0.88 | 0.95 |
| Beta (5Y) | 0.83 | 0.86 |
Analysis
- 3-Year Beta: Quant Mid Cap Fund has a lower Beta (0.88) than Mahindra’s 0.95. This means that Quant has been less volatile than Mahindra over the past 3 years, showing lower sensitivity to market fluctuations.
- 5-Year Beta: Over the more extended 5-year period, Quant Mid Cap Fund maintains a lower Beta of 0.83, compared to Mahindra Manulife’s 0.86. Again, this shows that Quant tends to experience less price movement than the market.
Key Takeaways:
- Quant Mid Cap Fund has been less volatile than Mahindra Manulife Mid Cap Fund over both 3-year and 5-year periods, as evidenced by its lower Beta. If you prefer a fund with lower sensitivity to market movements, Quant is the better choice.
Alpha

| Period | Quant Mid Cap Fund | Mahindra Manulife Mid Cap Fund |
| Alpha (3Y) | 6.13% | 2.37% |
| Alpha (5Y) | 10.24% | 5.05% |
Analysis
- 3-Year Alpha: Quant Mid Cap Fund significantly outperforms Mahindra with an Alpha of 6.13%, compared to Mahindra Manulife’s 2.37%. This means that Quant has consistently delivered higher returns than its benchmark over the past 3 years.
- 5-Year Alpha: Over 5 years, Quant Mid Cap Fund continues to dominate with a 10.24% Alpha, while Mahindra Manulife lags behind with 5.05%. This further establishes Quant’s ability to outperform its benchmark over the long term.
Key Takeaways:
- Quant Mid Cap Fund has significantly outperformed its benchmark, especially with a stellar 10.24% Alpha over 5 years, compared to Mahindra’s 5.05%. This makes Quant the more attractive option for investors seeking a fund that consistently beats the market.
Ratings

| Rating Agency | Quant Mid Cap Fund | Mahindra Manulife Mid Cap Fund |
| CRISIL (30th Jun 2024) | 3 | 5 |
| CRISIL (31st Mar 2024) | 5 | 5 |
| CRISIL (31st December 2023) | 4 | 5 |
| CRISIL (30th Sep 2023) | 4 | 4 |
| CRISIL (30th Jun 2023) | 4 | 4 |
| Value Research Ratings | 5 | 4 |
| Morning Star Ratings | 5 | 5 |
Analysis
- Crisil Ratings: Over the last year, Mahindra Manulife Mid Cap Fund consistently received higher CRISIL ratings, with 5-star ratings as of June 2024, compared to Quant’s 3-star rating. However, both funds showed similar ratings in September and June 2023.
- Value Research Ratings: Quant Mid Cap Fund receives a 5-star rating, outperforming Mahindra’s 4-star rating, indicating Quant performs slightly better regarding risk-adjusted returns and consistency.
- Morningstar Ratings: Both funds have received 5-star ratings from Morningstar, showing that both are solid options based on broader market performance and fund management
Key Takeaways:
- Mahindra Manulife Mid Cap Fund has a more consistent 5-star CRISIL rating, making it a strong contender for investors prioritizing risk-adjusted performance rankings.
- Quant Mid Cap Fund boasts 5-star ratings from both Value Research and Morningstar, showcasing its strong performance potential for investors looking for highly rated funds.
Portfolio Analysis:
Portfolio Overlap Comparison
| Metric | Quant Mid Cap Fund | Mahindra Manulife Mid Cap Fund |
| Portfolio Overlap (%) | 32.80% | 10.13% |
Analysis:
- Portfolio Overlap: Quant Mid Cap Fund has a much higher 32.80% portfolio overlap than Mahindra’s 10.13%. This means Quant‘s holdings tend to overlap more with other funds in the same category, potentially leading to less diversification within your portfolio.
- Mahindra Manulife Mid Cap Fund, with a lower portfolio overlap of 10.13%, offers more distinctive holdings, making it a better choice for investors seeking diversification across their mid-cap allocations.
Key Takeaways:
- With its lower portfolio overlap of 10.13%, Mahindra Manulife Mid Cap Fund offers better diversification across mid-cap holdings, ideal for investors who avoid heavy cross-over between their funds.
- Quant Mid Cap Fund‘s higher 32.80% overlap suggests its holdings are more similar to other funds, which might limit diversification.
Portfolio Turnover Ratio

| Metric | Quant Mid Cap Fund | Mahindra Manulife Mid Cap Fund |
| Portfolio Turnover Ratio | 342.00% | 87.00% |
Analysis
- Quant Mid Cap Fund has a strikingly high turnover ratio of 342%, indicating that the fund manager trades aggressively and frequently changes the portfolio’s composition. While this might lead to short-term gains, it could also result in higher transaction costs and tax liabilities for investors.
- On the other hand, Mahindra Manulife Mid Cap Fund has a far lower turnover ratio of 87%, suggesting a more long-term buy-and-hold strategy, which could be more tax-efficient for investors.
Key Takeaways:
- Quant Mid Cap Fund’s high turnover ratio of 342% suggests an aggressive management style, which could appeal to investors seeking active fund management with frequent adjustments.
- Mahindra Manulife Mid Cap Fund takes a more conservative approach with an 87% turnover ratio, making it more suitable for long-term investors who prefer a steady portfolio with fewer trades.
Portfolio Comparison

| Metric | Quant Mid Cap Fund | Mahindra Manulife Mid Cap Fund |
| Equity | 86.59% | 97.02% |
| Debt | 4.54% | 0.00% |
| Cash & Cash Equivalents | 8.91% | 2.98% |
Analysis:
- Equity Exposure: Mahindra Manulife Mid Cap Fund has a higher equity allocation of 97.02%, compared to Quant Mid Cap Fund’s 86.59%. This suggests that Mahindra is more focused on growth through equity investments, which could offer higher returns and increase volatility during market downturns.
- Debt Allocation: Quant Mid Cap Fund has 4.54% of its portfolio in debt, offering a slightly more conservative approach by including fixed-income securities. Mahindra Manulife, however, has no debt allocation, making it a fully equity-focused fund.
- Cash & Cash Equivalents: Quant Mid Cap Fund holds 8.91% in cash or cash equivalents, giving it more liquidity to react to market conditions. Mahindra Manulife only has 2.98% in cash, reflecting a more aggressive investment strategy with less liquidity on hand.
Key Takeaway:
- Mahindra Manulife Mid Cap Fund is more aggressive, with a higher allocation to equities and virtually no debt or cash holdings. With its slightly more diversified allocation to debt and higher cash reserves, Quant Mid Cap Fund might appeal to investors looking for a fund with more flexibility and Stability.
Market Cap Allocation
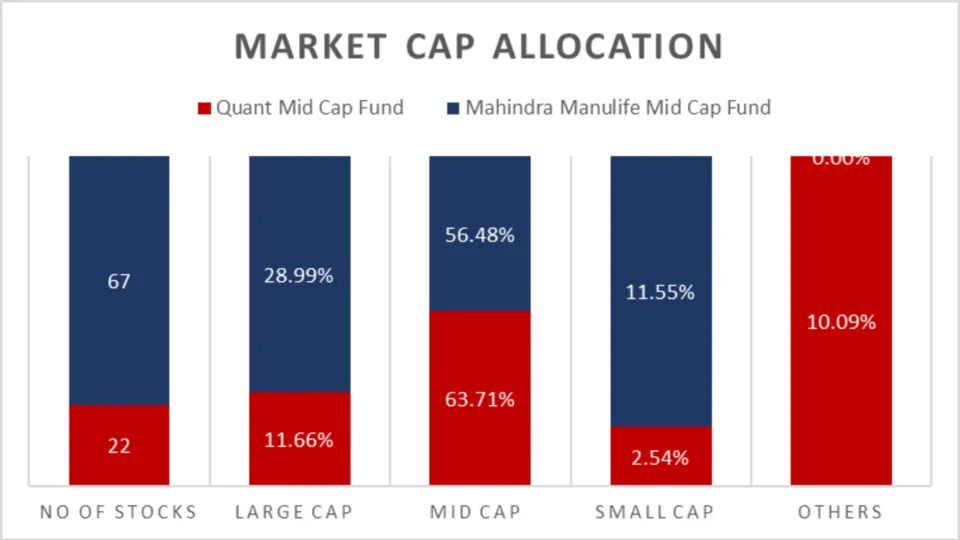
| Metric | Quant Mid Cap Fund | Mahindra Manulife Mid Cap Fund |
| Number of Stocks | 22 | 67 |
| Large Cap Allocation | 11.66% | 28.99% |
| Mid Cap Allocation | 63.71% | 56.48% |
| Small Cap Allocation | 2.54% | 11.55% |
| Others | 10.09% | 0.00% |
Analysis
- Number of Stocks: Mahindra Manulife Mid Cap Fund holds a significantly higher number of stocks (67) than Quant Mid Cap Fund’s 22. This suggests that Mahindra is more diversified across different companies, potentially spreading risk more effectively.
- Significant Cap Exposure: Mahindra Manulife Mid Cap Fund allocates 28.99% of its portfolio to large-cap stocks, compared to Quant’s 11.66%. This means that Mahindra offers more exposure to well-established, stable companies, providing a safety net during volatile market conditions.
- Mid Cap Exposure: As expected from a mid-cap fund, both funds heavily allocate to mid-cap stocks, but Quant Mid Cap Fund leads with 63.71% of its portfolio invested in mid-cap companies, compared to Mahindra’s 56.48%.
- Small Cap Exposure: Mahindra Manulife Mid Cap Fund has more exposure to small-cap stocks (11.55%), which are generally more volatile but offer higher growth potential. Quant Mid Cap Fund has only 2.54% invested in small-cap companies.
- Other Holdings: Quant Mid Cap Fund allocates 10.09% of its portfolio to other investments. At the same time, Mahindra Manulife Mid Cap Fund has no allocation to different asset classes. This category could include alternative assets or sectors outside traditional stock allocations.
Key Takeaways
- Mahindra Manulife Mid Cap Fund is heavily skewed towards equity, making it a high-growth potential fund and subject to higher volatility. Its more significant number of stocks (67) compared to Quant’s 22 provides greater diversification, which can help reduce risk.
- Quant Mid Cap Fund’s allocation to debt (4.54%) and cash (8.91%) makes it a more conservative and flexible option, ideal for those who prefer a liquidity cushion. This could be beneficial during market downturns or times of volatility.
Sector Allocation

| Sector | Quant Mid Cap Fund | Mahindra Manulife Mid Cap Fund |
| Industrials | 19.85% | 12.16% |
| Materials | 14.53% | 14.57% |
| Healthcare | 12.43% | 10.56% |
| Energy & Utilities | 11.22% | 6.77% |
| Consumer Staples | 10.81% | 4.29% |
| Technology | 8.25% | 14.28% |
| Consumer Discretionary | 5.57% | 12.46% |
| Financial | 3.86% | 17.47% |
| Diversified | N/A | 3.29% |
| Real Estate | N/A | 1.17% |
Analysis
- Industrials: Quant Mid Cap Fund has a significantly higher allocation to the Industrials sector (19.85%) than Mahindra Manulife’s 12.16%. This suggests Quant is more exposed to industrial growth, potentially benefiting from infrastructure expansion and manufacturing.
- Technology: Mahindra Manulife Mid Cap Fund shines in the Technology sector with an allocation of 14.28%, compared to Quant’s 8.25%. This could give Mahindra an edge, especially as tech continues to grow as a significant sector globally.
- Financials: Mahindra Manulife Mid Cap Fund is heavily invested in Financials (17.47%). Quant Mid Cap Fund only allocates 3.86% to this sector. If financial growth is on your radar, Mahindra Manulife has a higher stake in this sector.
- Consumer Discretionary: Mahindra Manulife Mid Cap Fund also allocates a substantial 12.46% to Consumer Discretionary, compared to Quant’s 5.57%. This indicates a strong focus on sectors such as retail, luxury goods, and entertainment, which may thrive in times of economic growth.
- Energy & Utilities: On the flip side, Quant Mid Cap Fund has higher exposure to Energy & Utilities (11.22%) compared to Mahindra’s 6.77%, making Quant more attuned to sectors with long-term infrastructure growth potential.
Key Takeaway:
- Mahindra Manulife Mid Cap Fund offers more significant exposure to high-growth sectors like Technology, Financials, and Consumer Discretionary. It makes it appealing to investors looking for growth in rapidly expanding industries.
- Quant Mid Cap Fund stands out with its higher exposure to Industrials and Energy & Utilities, sectors that may benefit from infrastructure growth and economic revival.
Fund Management

| Fund Manager | Quant Mid Cap Fund (Months) | Mahindra Manulife Mid Cap Fund (Months) |
| Sanjeev Sharma | 91 | N/A |
| Vasav Sahgal | 62 | N/A |
| Ankit A. Pande | 51 | N/A |
| Manish Lodha | N/A | 44 |
| Abhinav Khandelwal | N/A | 31 |
Analysis:
- Quant Mid Cap Fund: Managed by a more experienced team, Sanjeev Sharma leads with 91 months of experience, followed by Vasav Sahgal (62 months) and Ankit A. Pande (51 months). The longer tenure of fund managers could be seen as a sign of Stability and deeper market insight.
- Mahindra Manulife Mid Cap Fund: The management team at Mahindra Manulife is led by Manish Lodha (44 months) and Abhinav Khandelwal (31 months). While they bring solid experience, their tenure is shorter compared to Quant’s fund managers, which could mean a fresher approach but with slightly less market history to rely on.
Key Takeaway:
- Quant Mid Cap Fund boasts more seasoned fund managers with a longer tenure, which can provide a sense of Stability and deep market knowledge.
- With its relatively newer management team, Mahindra Manulife Mid Cap Fund might offer a more dynamic approach but could lack the longer-term experience than Quant.
General Details

| Metric | Quant Mid Cap Fund | Mahindra Manulife Mid Cap Fund |
| NAV (₹) | 269.51 | 38.45 |
| AUM (in ₹ Crores) | 9367 | 3292 |
| Expense Ratio (%) | 0.58 | 0.43 |
| Benchmark | Nifty Midcap 150 – TRI | Nifty Midcap 150 – TRI |
Analysis:
- NAV: The Quant Mid Cap Fund has a significantly higher NAV (₹269.51) compared to Mahindra Manulife Mid Cap Fund’s ₹38.45. While a higher NAV doesn’t necessarily mean a better fund, it reflects that Quant has grown substantially since its inception. Investors looking for more affordable entry prices might prefer Mahindra due to its lower NAV.
- AUM: With an AUM of ₹9367 crores, Quant Mid Cap Fund manages more assets than Mahindra Manulife Mid Cap Fund’s ₹3292 crores. A larger AUM often indicates that more investors trust the fund, though smaller AUMs like Mahindra’s could reveal more room for growth.
- Expense Ratio: Mahindra Manulife Mid Cap Fund has a lower expense ratio of 0.43% compared to Quant’s 0.58%. This suggests that Mahindra may be a more cost-efficient option for investors seeking to minimize management fees and maximize net returns.
Key Takeaway:
- Quant Mid Cap Fund has a larger AUM and higher NAV, reflecting its established position and growth. In contrast, Mahindra Manulife Mid Cap Fund has a lower expense ratio, making it a more cost-effective option for budget-conscious investors.
Minimum Investment Comparison

| Investment Option | Quant Mid Cap Fund | Mahindra Manulife Mid Cap Fund |
| SIP (Systematic Investment Plan) | ₹1,000 | ₹500 |
| Lumpsum | ₹5,000 | ₹1,000 |
Analysis
- SIP: Mahindra Manulife Mid Cap Fund has a more accessible minimum SIP investment amount (₹500), making it attractive to investors who prefer starting with smaller amounts. Quant Mid Cap Fund requires a minimum SIP of ₹1,000, which is still relatively affordable but slightly higher.
- Lumpsum: For lumpsum investments, Mahindra Manulife allows entry with as little as ₹1,000, whereas Quant Mid Cap Fund requires a higher initial investment of ₹5,000. This makes Mahindra the more flexible choice for investors looking to start with lower amounts.
Key Takeaway:
- Suppose you’re looking for lower minimum investment amounts, especially for SIP or lumpsum. In that case, Mahindra Manulife Mid Cap Fund is the more affordable and flexible option, with entry amounts starting at just ₹500 for SIP and ₹1,000 for lumpsum.
In summary
Quant Mid Cap Fund is the superior choice for long-term investors, delivering higher total and average returns, better risk-adjusted performance (as evidenced by the Sharpe Ratio and Alpha), and a more experienced fund management team. It also performs better over mid-to-long-term periods, particularly in 3-year and 5-year CAGR and SIP returns. On the other hand,
Mahindra Manulife Mid Cap Fund excels in short-term performance, offering lower volatility with a smaller expense ratio and lower minimum investment requirements. For investors with a higher risk appetite seeking long-term growth, Quant Mid Cap Fund is the better choice. In contrast, those with a lower risk appetite or focusing on cost efficiency and short-term gains might find Mahindra Manulife Mid Cap Fund more suitable.

FAQs: Quant Mid Cap Fund vs Mahindra Manulife Mid Cap Fund
Which fund is better for short-term investments: Quant Mid Cap Fund or Mahindra Manulife Mid Cap Fund?
Mahindra Manulife Mid Cap Fund outperforms Quant Mid Cap Fund for short-term investments. It has delivered higher returns in 1-year and 2-year periods, with 52.78% and 40.11%, respectively, compared to Quant’s 50.86% and 37.41%.
How does the SIP performance compare between Quant Mid Cap Fund and Mahindra Manulife Mid Cap Fund?
Mahindra Manulife Mid Cap Fund leads in short-term SIP returns, with a 1-year SIP return of 56.27%, while Quant Mid Cap Fund shows better consistency in the long term with a 5-year SIP return of 40.19%.
Which fund has the lower expense ratio?
Mahindra Manulife Mid Cap Fund has a lower expense ratio of 0.43% compared to Quant Mid Cap Fund’s 0.58%, making it a cost-effective choice for fee-conscious investors.
are the portfolio turnover ratios for both funds?
Quant Mid Cap Fund has a significantly higher turnover ratio of 342%, indicating an aggressive trading strategy. In comparison, Mahindra Manulife Mid Cap Fund has a more conservative turnover ratio of 87%, reflecting a buy-and-hold approach.
Which fund is more suitable for long-term investments?
Quant Mid Cap Fund is the clear winner for long-term investments with a 5-year return of 39.08% and a higher total return over the long term. It is ideal for investors with a higher risk appetite looking for sustained growth.
Which fund offers better diversification?
Mahindra Manulife Mid Cap Fund holds more stocks (67 vs. Quant’s 22), offering better diversification. It also has a lower portfolio overlap of 10.13%, making it a better option for investors seeking diversified mid-cap exposure.
How does the risk compare between the two funds?
In terms of volatility, Mahindra Manulife Mid Cap Fund is less volatile with a Standard Deviation of 15.07% (3-year) and 18.75% (5-year), compared to Quant’s 15.84% (3-year) and 20.08% (5-year). If you prefer lower volatility, Mahindra Manulife is a safer bet.
What is the minimum investment required for both funds?
The minimum SIP amount for Mahindra Manulife Mid Cap Fund is just ₹500. In contrast, Quant Mid Cap Fund requires a higher minimum SIP of ₹1,000. Mahindra allows entry with ₹1,000 for lumpsum investments, compared to Quant’s ₹5,000.
Which fund has a better performance against the benchmark?
Quant Mid Cap Fund consistently outperforms its benchmark with a 5-year Alpha of 10.24%, compared to Mahindra Manulife’s 5.05%, making it a stronger performer in terms of beating the market.
Which sectors do the funds invest in heavily?
Quant Mid Cap Fund has a higher allocation to Industrials (19.85%) and Energy & Utilities (11.22%). In comparison, Mahindra Manulife Mid Cap Fund focuses more on Technology (14.28%), Financials (17.47%), and Consumer Discretionary (12.46%), making them distinct in sector allocations.
Disclaimer:
The information provided in this article is solely the author/advertisers’ opinion and not investment advice – it is provided for educational purposes only. Using this, you agree that the information does not constitute any investment or financial instructions by Ace Equity Research/Mutual Fund Focus/IPO First and the team. Anyone wishing to invest should seek their own independent financial or professional advice. Conduct your research with registered financial advisors before making any investment decisions. Ace Equity Research/ Mutual Fund Focus / IPO First and the team are not accountable for the investment views provided in the article.
Mutual Fund investments are subject to market risks. Read all scheme-related documents carefully.
Investments in the securities market are subject to market risks. Read all the related documents carefully before investing
