Investing in midcap funds can be a game-changer for your financial portfolio. If you’re contemplating investing in Quant Mid Cap Fund vs SBI Magnum Midcap Fund, this blog clarifies your doubts. We’ll dive deep into a comprehensive five-step comparative analysis of these two midcap mutual funds, focusing on crucial parameters to help you make an informed decision. Let’s get started!
Investment Style
Understanding a fund’s investment style is vital as it determines its approach to selecting securities and managing risk.
| Fund | Investment Style |
| Quant Mid Cap Fund | Blend |
| SBI Magnum Midcap Fund | Growth |
Key Takeaway
- Quant Mid Cap Fund: This fund follows a blend style, meaning it invests in value and growth stocks. It aims to provide a balanced approach with moderate risk and returns.
- SBI Magnum Midcap Fund follows a growth style, focusing on stocks with high growth potential. It might be more volatile, but it offers higher growth opportunities.

Returns Analysis
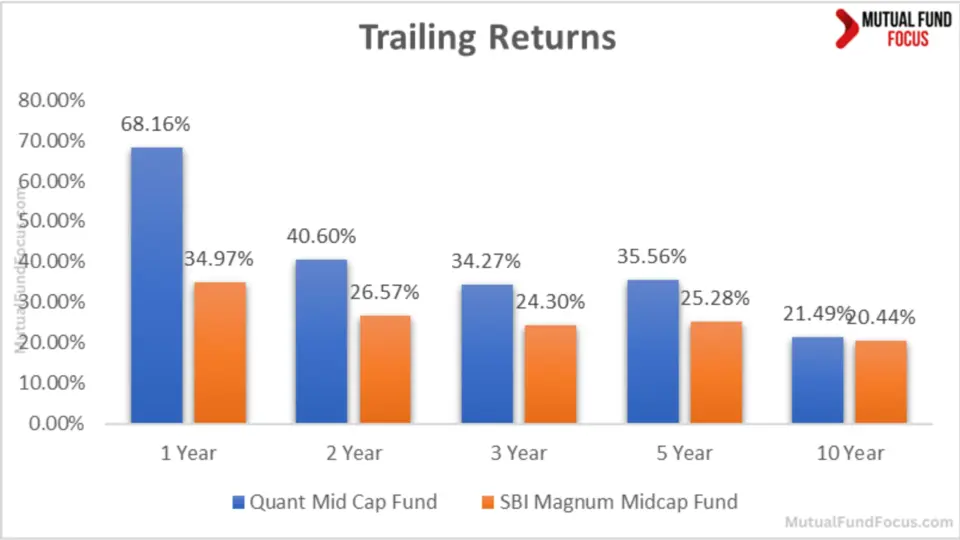
Analyzing a mutual fund’s historical returns can provide insight into its performance and consistency over time. Below is the trailing returns analysis based on NAV as of 9th May 2024.
Trailing Returns
| Period Invested for | Quant Mid Cap Fund | SBI Magnum Midcap Fund |
| 1 Year | 68.16% | 34.97% |
| 2 Year | 40.60% | 26.57% |
| 3 Year | 34.27% | 24.30% |
| 5 Year | 35.56% | 25.28% |
| 10 Year | 21.49% | 20.44% |
Analysis
1 Year: Quant Mid Cap Fund outperformed with a staggering 68.16% return compared to 34.97% by SBI Magnum Midcap Fund.
2 Year: Quant leads with a 40.60% return, while SBI Magnum trails at 26.57%.
3 Year: The trend remains with Quant at 34.27% and SBI Magnum at 24.30%.
5 Year: Quant Mid Cap shows a 35.56% return versus 25.28% for SBI Magnum.
10 Year: Both funds perform closely, but Quant Mid Cap still has a slight edge with 21.49% over SBI Magnum’s 20.44%.Lumpsum Investment Value
Key Takeaway
- Quant Mid Cap Fund: Consistently outperforms SBI Magnum Midcap Fund across all timeframes, making it a strong contender for those looking for higher returns.
- SBI Magnum Midcap Fund: Although it shows decent returns, it lags behind Quant Mid Cap Fund, particularly in the 1, 2, and 3-year periods.
SIP Investment Value

| Period Invested for | Investments (₹) | Quant Mid Cap Fund (₹) | SBI Magnum Midcap Fund (₹) |
| 1 Year | 12000 | 15927.22 | 13738.88 |
| 2 Years | 24000 | 37194.66 | 31280.80 |
| 3 Years | 36000 | 61743.58 | 50582.30 |
| 5 Years | 60000 | 159777.78 | 120909.73 |
| 10 Years | 120000 | 469280.14 | 332689.51 |
1 Year SIP
- Investment: ₹12,000
- Quant Mid Cap Fund: ₹15,927.22 (32.73% Return)
- SBI Magnum Midcap Fund: ₹13,738.88 (14.49% Return)
In just one year, Quant Mid Cap Fund outshines with an impressive return of 32.73%, significantly higher than SBI Magnum Midcap Fund’s 14.49%.
2 Years SIP
- Investment: ₹24,000
- Quant Mid Cap Fund: ₹37,194.66 (54.98% Return)
- SBI Magnum Midcap Fund: ₹31,280.80 (30.34% Return)
Over two years, Quant Mid Cap Fund maintained its lead, delivering a substantial 54.98% return, compared to SBI Magnum Midcap Fund’s 30.34%.
3 Years SIP
- Investment: ₹36,000
- Quant Mid Cap Fund: ₹61,743.58 (71.51% Return)
- SBI Magnum Midcap Fund: ₹50,582.30 (40.51% Return)
Three years in, the gap widens. Quant Mid Cap Fund returns 71.51%, while SBI Magnum Midcap Fund offers 40.51%.
5 Years SIP
- Investment: ₹60,000
- Quant Mid Cap Fund: ₹159,777.78 (166.30% Return)
- SBI Magnum Midcap Fund: ₹120,909.73 (101.52% Return)
With a five-year horizon, Quant Mid Cap Fund skyrockets to a 166.30% return, leaving SBI Magnum Midcap Fund’s 101.52% far behind.
10 Years SIP
- Investment: ₹120,000
- Quant Mid Cap Fund: ₹469,280.14 (291.07% Return)
- SBI Magnum Midcap Fund: ₹332,689.51 (177.24% Return)
Key Takeaway
- Quant Mid Cap Fund: Offers significantly higher growth in investment value compared to SBI Magnum Midcap Fund, particularly noticeable in the long-term (5 and 10-year periods).
- SBI Magnum Midcap Fund: Although it provides substantial growth, it doesn’t match the investment value growth of Quant Mid Cap Fund
SIP Returns
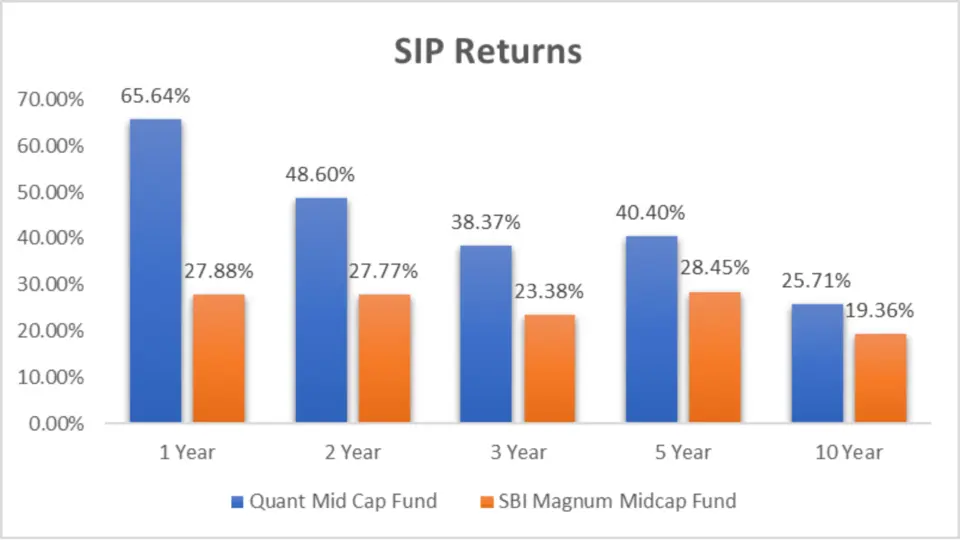
| Period Invested for | Quant Mid Cap Fund | SBI Magnum Midcap Fund |
| 1 Year | 65.64% | 27.88% |
| 2 Year | 48.60% | 27.77% |
| 3 Year | 38.37% | 23.38% |
| 5 Year | 40.40% | 28.45% |
| 10 Year | 25.71% | 19.36% |
Analysis
- 1 Year: Quant Mid Cap Fund shows 65.64% returns from SIP investments, far outpacing SBI Magnum’s 27.88%.
- 2 Year: SIP returns in Quant are 48.60%, compared to SBI Magnum’s 27.77%.
- 3 Year: Quant continues to lead with 38.37% vs. 23.38% in SBI Magnum.
- 5 Year: Quant’s SIP returns are 40.40%, while SBI Magnum is 28.45%.
- 10 Year: Quant still performs better over the long term with 25.71% returns against SBI Magnum’s 19.36%.
Key Takeaway
- Quant Mid Cap Fund shines in SIP returns, offering higher growth across all time frames.
- SBI Magnum Midcap Fund delivers respectable SIP returns but lags behind Quant Mid Cap Fund.
CAGR

| Category | 1 Year | 3 Year | 5 Year | 9 Year |
| Quant Mid Cap Fund | 70.74% | 36.14% | 32.62% | 19.52% |
| SBI Magnum Midcap Fund | 40.55% | 24.46% | 23.78% | 15.90% |
Analysis
- 1 Year: Quant Mid Cap Fund’s CAGR is 70.74%, significantly higher than SBI Magnum’s 40.55%.
- 3 Year: Quant maintains its lead with 36.14% CAGR compared to 24.46%.
- 5 Year: Quant shows 32.62%, whereas SBI Magnum stands at 23.78%.
- 9 Year: Quant’s CAGR is 19.52%, ahead of SBI Magnum’s 15.90%.
Key Takeaway
- Quant Mid Cap Fund has a higher CAGR across all periods, indicating more substantial growth potential.
- SBI Magnum Midcap Fund shows a stable CAGR but lags behind Quant Mid Cap Fund.
Rolling Returns: Consistency Over Time
Rolling returns help evaluate the fund’s performance consistency over different periods. Here’s how they stack up.

| Category | 1 Year | 3 Year | 5 Year | 9 Year |
| Quant Mid Cap Fund | 23.62% | 19.05% | 16.13% | 18.23% |
| SBI Magnum Midcap Fund | 23.92% | 19.93% | 15.54% | 19.68% |
Data Analysis
- 1 Year: SBI Magnum shows a slight edge with 23.92% compared to Quant’s 23.62%.
- 3 Year: SBI Magnum leads with 19.93% over Quant’s 19.05%.
- 5 Year: Quant Mid Cap shows 16.13% while SBI Magnum is 15.54%.
- 9 Year: SBI Magnum leads with 19.68%, whereas Quant shows 18.23%.
Key Takeaway
- Quant Mid Cap Fund shows strong consistency but slightly trails behind SBI Magnum Midcap Fund in rolling returns for 1 and 9-year periods.
- SBI Magnum Midcap Fund performs better in rolling returns for 1 and 9-year periods, suggesting steadiness over these times
Annualized/Calendar Year Returns
Year-on-year returns can show how a fund performed in specific market conditions. Let’s look at the annualized returns.
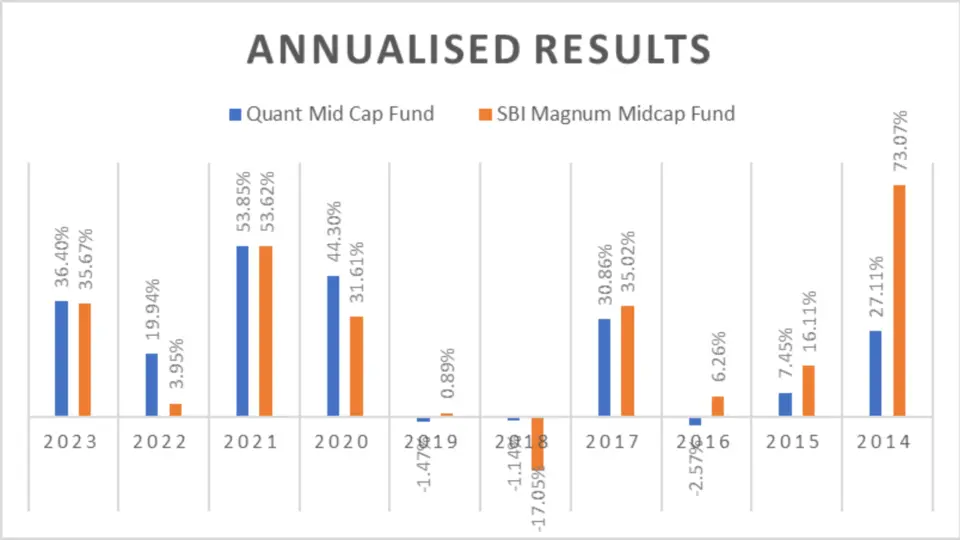
| Period | Quant Mid Cap Fund | SBI Magnum Midcap Fund |
| 2023 | 36.40% | 35.67% |
| 2022 | 19.94% | 3.95% |
| 2021 | 53.85% | 53.62% |
| 2020 | 44.30% | 31.61% |
| 2019 | -1.47% | 0.89% |
| 2018 | -1.14% | -17.05% |
| 2017 | 30.86% | 35.02% |
| 2016 | -2.57% | 6.26% |
| 2015 | 7.45% | 16.11% |
| 2014 | 27.11% | 73.07% |
Data Analysis
- 2023: Quant Mid Cap at 36.40% edges out SBI Magnum at 35.67%.
- 2022: Quant shows 19.94% compared to SBI Magnum’s 3.95%.
- 2021: Both funds perform similarly, with Quant at 53.85% and SBI Magnum at 53.62%.
- 2020: Quant leads with 44.30%, while SBI Magnum is 31.61%.
- 2019: SBI Magnum shows a positive return of 0.89%, while Quant is at -1.47%.
- 2018: Quant’s -1.14% beats SBI Magnum’s -17.05%.
- 2017: SBI Magnum leads with 35.02% compared to Quant’s 30.86%.
- 2016: SBI Magnum shows a positive return of 6.26% over Quant’s -2.57%.
- 2015: SBI Magnum at 16.11% leads Quant at 7.45%.
- 2014: SBI Magnum significantly outperforms Quant, with 73.07%, compared to Quant’s 27.11%.
Key Takeaway
- Quant Mid Cap Fund and SBI Magnum Midcap Fund each outperformed the other in five different years, showcasing a competitive performance over the long term.
- SBI Magnum Midcap Fund had an extreme performance in 2014, significantly outpacing Quant Mid Cap Fund.
Best and Worst Quarters
Analyzing the best and worst quarters provides insight into the funds’ performance during varying market conditions.
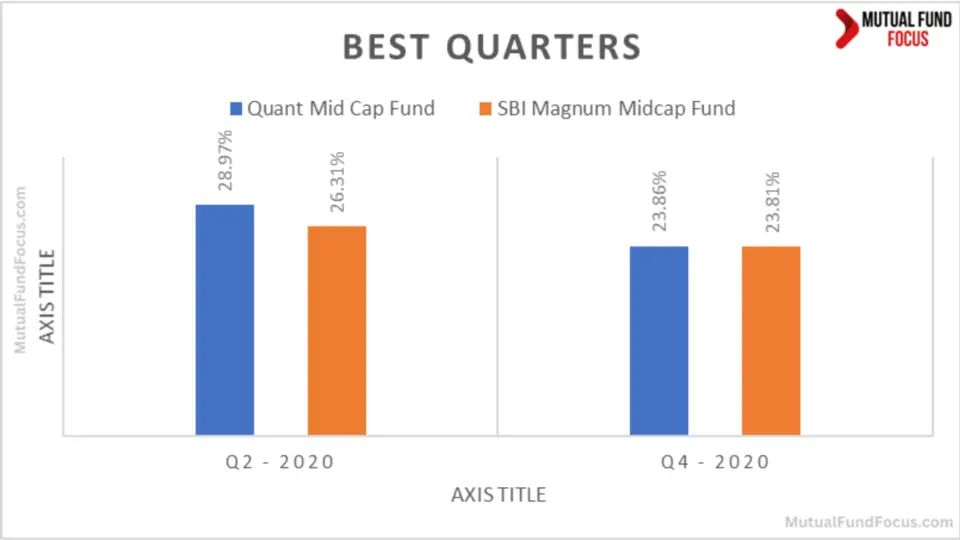
Best Quarters
| Period | Quant Mid Cap Fund | SBI Magnum Midcap Fund |
| Q2 – 2020 | 28.97% | 26.31% |
| Q4 – 2020 | 23.86% | 23.81% |
Analysis
- Q2 – 2020: Both funds had a stellar performance, but Quant Mid Cap Fund edged out with a slightly higher return of 28.97% compared to SBI Magnum Midcap Fund’s 26.31%. This period marked a significant recovery phase after the initial COVID-19 market crash, showing resilience in mid-cap stocks.
- Q4 – 2020: Both funds were neck-and-neck, with returns of around 23%. It’s interesting to note how closely they tracked each other during this quarter, indicating a sectoral solid performance.
Worst Quarters
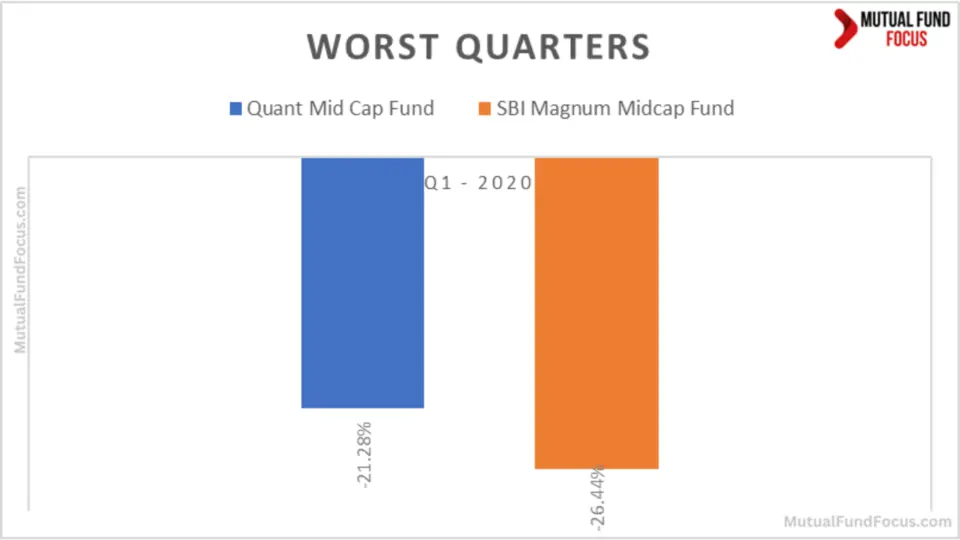
| Period | Quant Mid Cap Fund | SBI Magnum Midcap Fund |
| Q1 – 2020 | -21.28% | -26.44% |
Analysis
- Q1 – 2020: The market turmoil caused by the pandemic hit both funds hard. Quant Mid Cap Fund saw a dip of -21.28%, while SBI Magnum Midcap Fund suffered a more enormous loss at -26.44%. This significant decline reflects the broader market panic and the vulnerability of mid-cap stocks during crises.
Key Takeaway
- Quant Mid Cap Fund performed better in the best quarters, showing resilience during positive market phases.
- SBI Magnum Midcap Fund experienced a more significant drop during the worst quarter, indicating higher volatility.
Quarterly Results
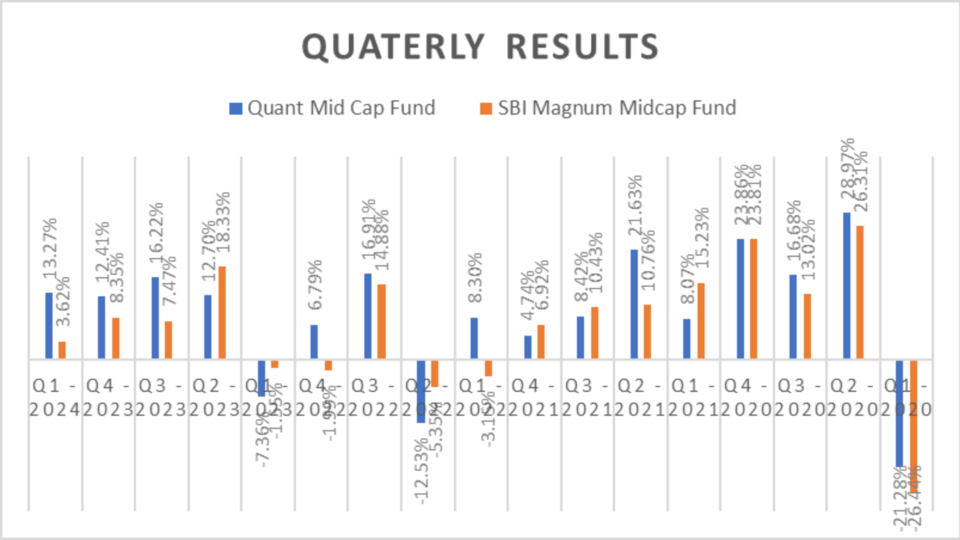
| Period | Quant Mid Cap Fund | SBI Magnum Midcap Fund |
| Q1 – 2024 | 13.27% | 3.62% |
| Q4 – 2023 | 12.41% | 8.35% |
| Q3 – 2023 | 16.22% | 7.47% |
| Q2 – 2023 | 12.70% | 18.33% |
| Q1 – 2023 | -7.36% | -1.55% |
| Q4 – 2022 | 6.79% | -1.99% |
| Q3 – 2022 | 16.91% | 14.88% |
| Q2 – 2022 | -12.53% | -5.35% |
| Q1 – 2022 | 8.30% | -3.15% |
| Q4 – 2021 | 4.74% | 6.92% |
| Q3 – 2021 | 8.42% | 10.43% |
| Q2 – 2021 | 21.63% | 10.76% |
| Q1 – 2021 | 8.07% | 15.23% |
| Q4 – 2020 | 23.86% | 23.81% |
| Q3 – 2020 | 16.68% | 13.02% |
| Q2 – 2020 | 28.97% | 26.31% |
| Q1 – 2020 | -21.28% | -26.44% |
Analysis
- Q1 – 2024: Quant Mid Cap Fund outperformed SBI Magnum Midcap Fund by a significant margin, achieving 13.27% compared to 3.62%.
- Q2 – 2023: SBI Magnum Midcap Fund excelled with an 18.33% return, surpassing Quant Mid Cap Fund’s 12.70%.
- Q1 – 2023 and Q4 – 2022: These quarters were challenging, especially for SBI Magnum Midcap Fund, which saw negative returns. Despite not being immune to losses, Quant Mid Cap Fund performed relatively better.
Key Takeaway
- Quant Mid Cap Fund shows quarterly solid performance, outperforming SBI Magnum Midcap Fund in 11 quarters.
- SBI Magnum Midcap Fund performed better in 6 quarters, showcasing periods of solid returns.


Risk Analysis
Understanding risk is crucial for making an informed investment decision. Let’s delve into some key risk metrics.
Maximum Drawdown
Maximum drawdown measures the most significant peak-to-trough decline, providing an understanding of the risk associated with the fund.
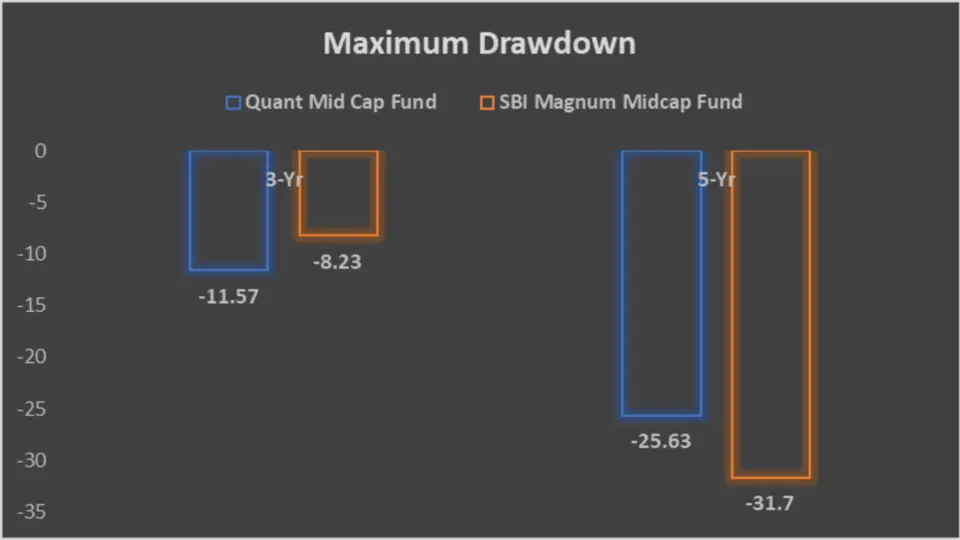
| Category | 3-Year | 5-Year |
| Quant Mid Cap Fund | -11.57 | -25.63 |
| SBI Magnum Midcap Fund | -8.23 | -31.7 |
Analysis
- Over the last 3 years, Quant Mid Cap Fund had a maximum drawdown of -11.57%, significantly lower than SBI Magnum Midcap Fund’s -25.63%. Over 5 years, this trend continues with Quant Mid Cap Fund showing better resilience with an -8.23% drawdown compared to SBI Magnum Midcap Fund’s -31.7%.
Key Takeaway
- Quant Mid Cap Fund had a higher drawdown in the 3 years but fared better in the 5 years.
- SBI Magnum Midcap Fund experienced a lower drawdown in the 3 years but a significantly higher drawdown over 5 years
Mean, Sortino Ratio and Treynor’s Ratio
The Quant Mid Cap Fund and the SBI Magnum Midcap Fund. These metrics are critical for evaluating the efficiency and effectiveness of these funds in generating returns relative to the risk taken.
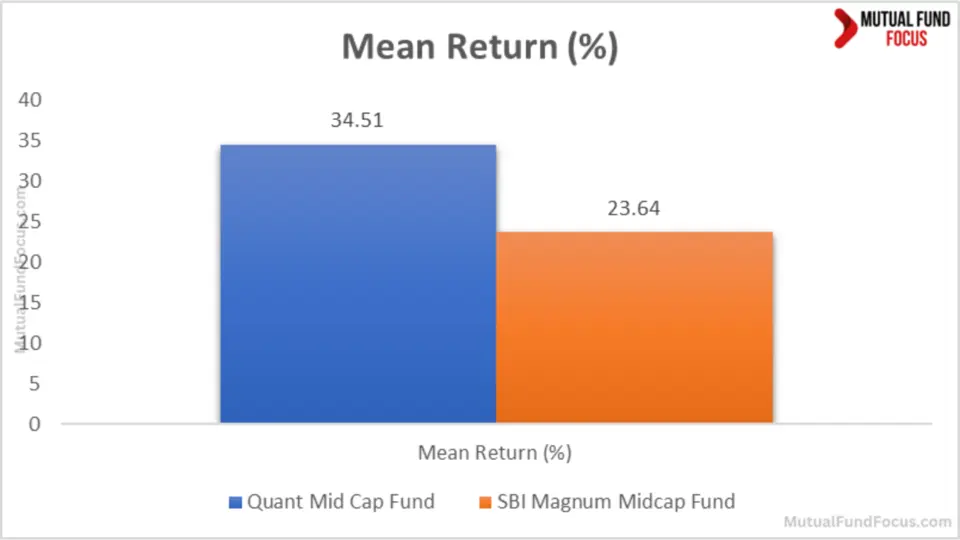
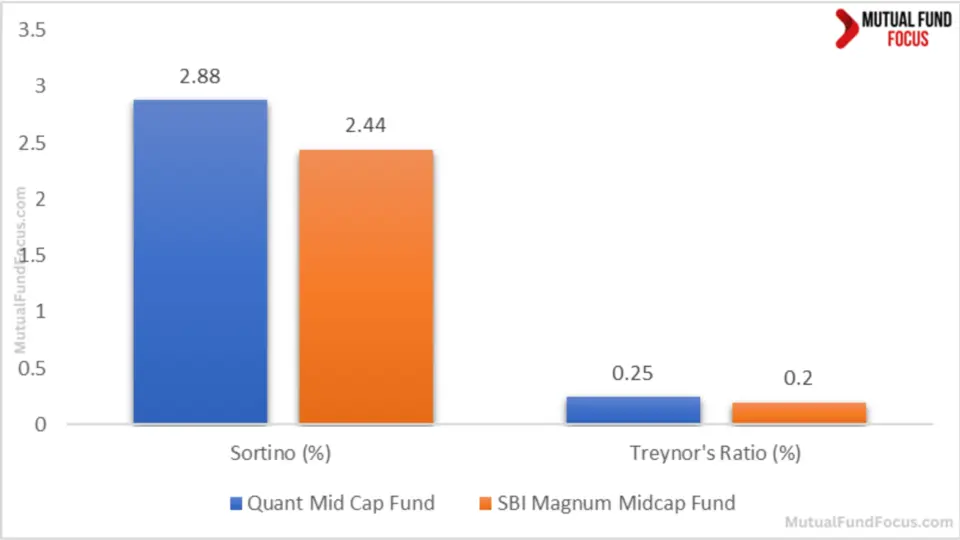
| Metric | Quant Mid Cap Fund | SBI Magnum Midcap Fund |
| Mean Return (%) | 34.51 | 23.64 |
| Sortino Ratio | 2.88 | 2.44 |
| Treynor’s Ratio (%) | 0.25 | 0.20 |
Analysis
- Mean Return: Quant Mid Cap Fund boasts a mean return of 34.51%, substantially higher than SBI Magnum Midcap Fund’s 23.64%. This suggests that Quant Mid Cap Fund has generated better average returns for its investors.
- Sortino Ratio: Quant Mid Cap Fund has a higher Sortino Ratio of 2.88 compared to 2.44 for SBI Magnum Midcap Fund, indicating better risk-adjusted returns.
Standard Deviation
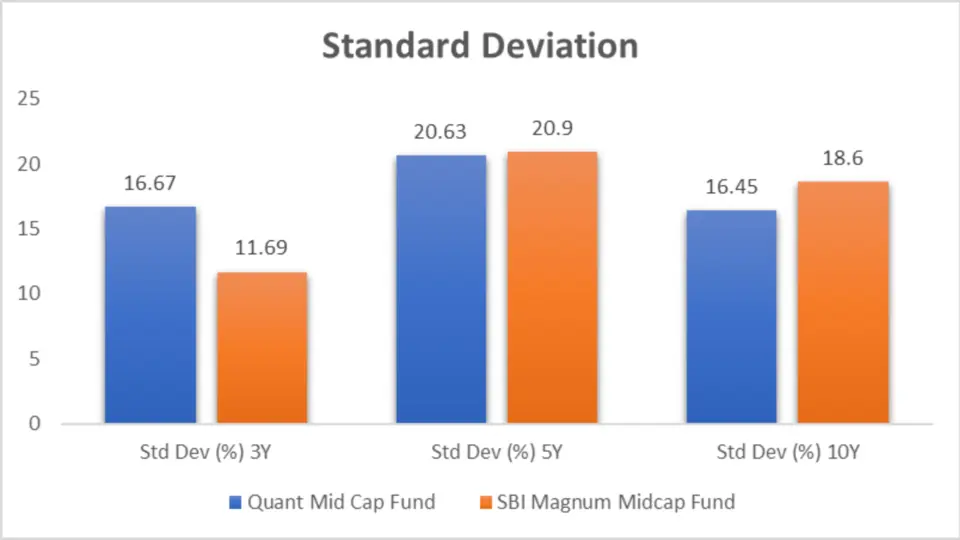
| Metric | Quant Mid Cap Fund | SBI Magnum Midcap Fund |
| Std Dev (%) 3Y | 16.67 | 11.69 |
| Std Dev (%) 5Y | 20.63 | 20.9 |
| Std Dev (%) 10Y | 16.45 | 18.6 |
Analysis
- Standard Deviation (3Y): Quant Mid Cap Fund has a higher 3-year standard deviation at 16.67%, compared to 11.69% for SBI Magnum Midcap Fund, indicating higher volatility in recent years.
- Standard Deviation (5Y and 10Y): Both funds exhibit similar volatility over more extended periods, though Quant Mid Cap Fund shows slightly lower volatility over 10 years.
Sharpe Ratio

| Metric | Quant Mid Cap Fund | SBI Magnum Midcap Fund |
| Sharpe Ratio (%) 3Y | 1.75 | 1.56 |
| Sharpe Ratio (%) 5Y | 1.33 | 0.94 |
| Sharpe Ratio (%) 10Y | 0.93 | 0.81 |
Analysis
- Sharpe Ratio: Across all periods, Quant Mid Cap Fund consistently posts higher Sharpe Ratios, indicating better risk-adjusted returns compared to SBI Magnum Midcap Fund.
Key Takeaways
- Consistent Outperformance: Quant Mid Cap Fund has outperformed SBI Magnum Midcap Fund in more quarters, showcasing better consistency and reliability.
- Higher Returns: With a higher mean return and better performance in best quarters, Quant Mid Cap Fund offers higher potential returns for investors.
- Risk Metrics: Quant Mid Cap Fund demonstrates superior risk-adjusted returns as evidenced by higher Sortino and Sharpe Ratios despite higher short-term volatility.
- Drawdown Resilience: Quant Mid Cap Fund has shown better resilience in drawdowns, recovering faster and protecting investor capital more effectively during downturns.
Beta
Beta measures the fund’s volatility compared to the market, while Alpha indicates performance relative to the market benchmark.
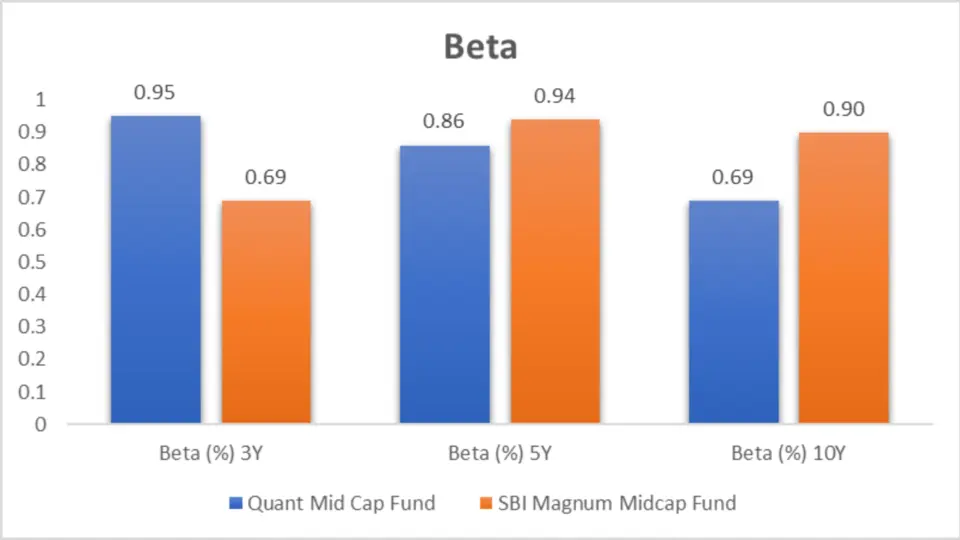
| Fund Name | Beta (%) 3Y | Beta (%) 5Y | Beta (%) 10Y |
| Quant Mid Cap Fund | 0.95 | 0.86 | 0.69 |
| SBI Magnum Midcap Fund | 0.69 | 0.94 | 0.90 |
Analysis
- Beta (%) 3Y: The SBI Magnum Midcap Fund has a lower Beta (0.69) compared to the Quant Mid Cap Fund (0.95), indicating lower volatility over the last three years.
- Beta (%) 5Y: Quant Mid Cap Fund leads with a Beta of 0.86, suggesting better stability over five years.
- Beta (%) 10Y: The Quant Mid Cap Fund again performs better with a Beta of 0.69, indicating lesser risk over the long term.
Key takeway
Quant Mid Cap Fund has a higher beta over 3 years and slightly lower beta over 5 years, indicating more volatility in the shorter term but stabilizing over the long term.
Alpha

| Index/Fund Name | Alpha (%) 3Y | Alpha (%) 5Y | Alpha (%) 10Y |
| NIFTY 500 | |||
| Quant Mid Cap Fund | 8.87 | 10.79 | 5.04 |
| SBI Magnum Midcap Fund | 3.48 | 1.4 | 1.78 |
Analysis
- Alpha (%) 3Y: Quant Mid Cap Fund has a significantly higher Alpha (8.87) than SBI Magnum Midcap Fund (3.48), indicating better excess returns over three years.
- Alpha (%) 5Y: Quant Mid Cap Fund maintains its lead with an Alpha of 10.79.
- Alpha (%) 10Y: The Quant Mid Cap Fund’s Alpha is higher (5.04) compared to the SBI Magnum Midcap Fund (1.78).
Key Takeaway
- Quant Mid Cap Fund shows significantly higher Alpha, suggesting superior performance compared to the benchmark.
Portfolio Analysis
Portfolio Overlap
Portfolio overlap measures the percentage of the same holdings in both funds.
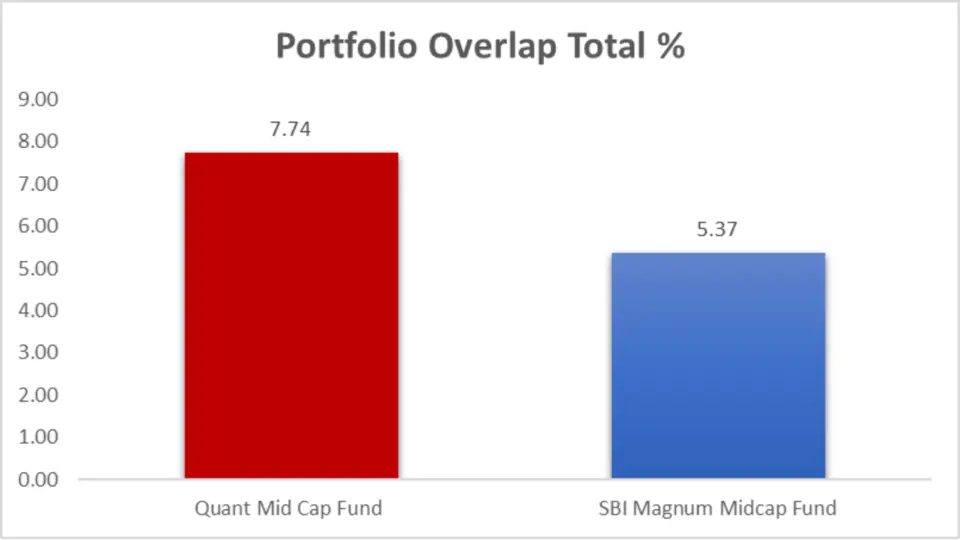
| Metric | Quant Mid Cap Fund | SBI Magnum Midcap Fund |
| Portfolio Overlap Total % | 7.74 | 5.37 |
Analysis
- The Quant Mid Cap Fund has a higher portfolio overlap (7.74%) than the SBI Magnum Midcap Fund (5.37%).
Key Takeaway
- There is a low overlap between the two funds, indicating they invest in different stocks, providing diversification if you choose to invest in both.
Portfolio Composition

| Metric | Quant Mid Cap Fund | SBI Magnum Midcap Fund |
| Equity | 97.41% | 94.60% |
| Debt | 3.95% | 0.28% |
| Cash & Cash Eq. | -1.36% | 5.12% |
Analysis
- Equity Allocation: Quant Mid Cap Fund has a slightly higher equity allocation (97.41%) than SBI Magnum Midcap Fund (94.60%).
- Debt Allocation: Quant Mid Cap Fund holds more debt (3.95%) than SBI Magnum Midcap Fund (0.28%).
- Cash & Cash Equivalents: SBI Magnum Midcap Fund maintains a higher cash position (5.12%) than Quant Mid Cap Fund (-1.36%).
Key Takeaway
- Quant Mid Cap Fund has a higher equity allocation and a small allocation to debt. In contrast, the SBI Magnum Midcap Fund holds more cash equivalents.
Market Cap Allocation
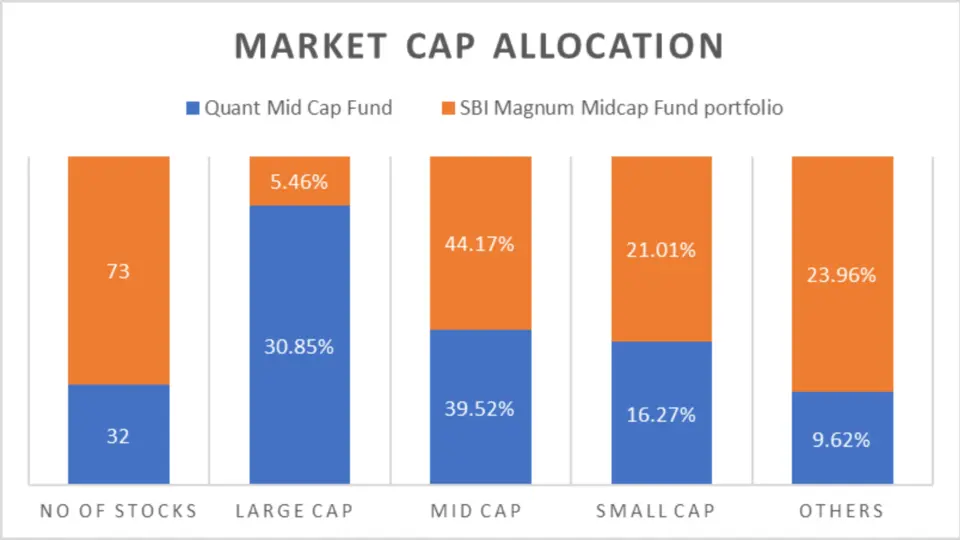
| Metric | Quant Mid Cap Fund | SBI Magnum Midcap Fund |
| No. of Stocks | 32 | 73 |
| Large Cap | 30.85% | 5.46% |
| Mid Cap | 39.52% | 44.17% |
| Small Cap | 16.27% | 21.01% |
| Others | 9.62% | 23.96% |
| Foreign Equity Holdings | – | – |
Analysis
- Stock Count: SBI Magnum Midcap Fund holds more stocks (73) than Quant Mid Cap Fund (32).
- Large Cap Allocation: Quant Mid Cap Fund has a higher large-cap allocation (30.85%) than SBI Magnum Midcap Fund (5.46%).
- Mid-Cap Allocation: SBI Magnum Midcap Fund leads in mid-cap allocation (44.17%).
- Small Cap Allocation: SBI Magnum Midcap Fund also leads small-cap allocation (21.01%).
- Others: SBI Magnum Midcap Fund has a higher allocation in other categories (23.96%).
Key Takeaway
- Quant Mid Cap Fund has a more concentrated portfolio with fewer stocks and a higher allocation to large caps.
- SBI Magnum Midcap Fund has a broader portfolio with more stocks and a higher allocation to mid and small caps.
Sector Allocation
Understanding sector allocation helps identify the focus areas of the funds.

| Sector | Quant Mid Cap Fund | SBI Magnum Midcap Fund |
| Industrials | 22.77% | 18.29% |
| Materials | 17.61% | 12.82% |
| Energy & Utilities | 16.15% | 4.33% |
| Financial | 12.51% | 13.94% |
| Healthcare | 10.56% | 8.16% |
| Technology | 9.29% | 2.63% |
| Consumer Discretionary | 8.52% | 26.77% |
| Real Estate | – | 4.72% |
| Consumer Staples | – | 2.94% |
Analysis
- Industrials: Quant Mid Cap Fund has a higher allocation (22.77%) than SBI Magnum Midcap Fund (18.29%).
- Materials: Quant Mid Cap Fund also leads in materials allocation (17.61%).
- Energy & Utilities: Quant Mid Cap Fund significantly outperforms this sector (16.15% vs. 4.33%).
- Financial: SBI Magnum Midcap Fund has a slightly higher allocation (13.94%).
- Healthcare: Quant Mid Cap Fund leads with a 10.56% allocation.
- Technology: Quant Mid Cap Fund has a higher allocation in technology (9.29%).
- Consumer Discretionary: SBI Magnum Midcap Fund dominates this sector (26.77%).
Key Takeaway
- Quant Mid Cap Fund has higher allocations in the Industrials, Materials, Energy & Utilities, and Technology sectors.
- SBI Magnum Midcap Fund focuses more on consumer discretion and has a more diversified sector allocation.
Star Ratings Comparison
| Ratings Source | Quant Mid Cap Fund | SBI Magnum Midcap Fund |
| CRISIL Ratings (as on 31st Mar 2024) | ⭐⭐⭐⭐⭐ | ⭐⭐⭐☆☆ |
| CRISIL Ratings (as on 31st Dec 2023) | ⭐⭐⭐⭐☆ | ⭐⭐⭐☆☆ |
| CRISIL Ratings (as on 30th Sep 2023) | ⭐⭐⭐⭐☆ | ⭐⭐⭐⭐☆ |
| CRISIL Ratings (as on 30th Jun 2023) | ⭐⭐⭐⭐☆ | ⭐⭐⭐⭐☆ |
| CRISIL Ratings (as on 31st Mar 2023) | ⭐⭐⭐⭐⭐ | ⭐⭐⭐⭐☆ |
| Value Research Ratings | ⭐⭐⭐⭐⭐ | ⭐⭐⭐⭐☆ |
| Economic Times Ratings | ⭐⭐⭐⭐⭐ | ⭐⭐⭐⭐☆ |
| Morning Star Ratings | ⭐⭐⭐⭐⭐ | ⭐⭐⭐⭐☆ |
| Groww Ratings | ⭐⭐⭐⭐⭐ | ⭐⭐⭐☆☆ |
| AngelOne AQR Ratings | ⭐⭐⭐⭐☆ | ⭐⭐⭐⭐⭐ |
| 5Paisa Ratings | ⭐⭐⭐⭐⭐ | ⭐⭐⭐☆☆ |
| KUVERA ratings | ⭐⭐⭐⭐⭐ | ⭐⭐⭐⭐☆ |
| Average Ratings | ⭐⭐⭐⭐⭐ | ⭐⭐⭐⭐☆ |
Analysis
Quant Mid Cap Fund: The High Performer
Quant Mid Cap Fund consistently receives high ratings across various platforms, with an average rating of 4.7 stars. It’s like the star student in class, excelling in all subjects.
SBI Magnum Midcap Fund: The Steady Performer
SBI Magnum Midcap Fund shows decent performance with ratings ranging from 3 to 5 stars, averaging 3.8 stars. This fund is like a reliable workhorse, steadily delivering good returns.
Fund Management Comparison
The experience and expertise of fund managers play a crucial role in a fund’s performance.

| Fund | Fund Manager | No. Of Months |
| SBI Magnum Midcap Fund | Bhavin Vithlani | 1 |
| Pradeep Kesavan | 1 | |
| Quant Mid Cap Fund | Sanjeev Sharma | 88 |
| Vasav Sahgal | 59 | |
| Ankit A. Pande | 49 |
Analysis
Experienced Management Team: The Quant Mid Cap Fund has a more experienced team of fund managers:
- Sanjeev Sharma: 88 months
- Vasav Sahgal: 59 months
- Ankit A. Pande: 49 months
New Management Team: The SBI Magnum Midcap Fund has relatively new managers:
- Bhavin Vithlani: 1 month
- Pradeep Kesavan: 1 month
Key Takeaway
- Quant Mid Cap Fund and SBI Magnum Midcap Fund each outperformed the other in five different years, showcasing a competitive performance over the long term.
- SBI Magnum Midcap Fund had a solid performance in 2014, significantly outpacing Quant Mid Cap Fund.
Other Important General Details

NAV and AUM
| Fund | NAV | AUM (in Cr.) |
| Quant Mid Cap Fund | 246.44 | 6920 |
| SBI Magnum Midcap Fund | 229.41 | 17910 |
Analysis
- NAV (Net Asset Value): Quant Mid Cap Fund has a slightly higher NAV at 246.44 compared to SBI Magnum’s 229.41. A higher NAV can indicate better historical performance but isn’t the sole factor for making investment decisions.
- AUM (Assets Under Management): SBI Magnum Midcap Fund manages a significantly larger corpus (₹17,910 crore) compared to Quant Mid Cap Fund (₹6,920 crore). A larger AUM can indicate investor trust and fund stability but also present challenges in maintaining high returns.
- Expense Ratio: Quant Mid Cap Fund offers a lower expense ratio of 0.62%, making it a more cost-effective option than SBI Magnum Midcap Fund’s 0.83%.
- Turnover Ratio: This is where Quant Mid Cap Fund stands out, with a high turnover of 342%, indicating more active management. SBI Magnum Midcap Fund has a much lower turnover at 13%, reflecting a more passive management approach.
- Benchmark: Both funds use the Nifty Midcap 150 – TRI as their Benchmark, ensuring a fair performance comparison.
Minimum Investment Amount

| Fund | SIP | Lumpsum |
| Quant Mid Cap Fund | ₹ 1,000 | ₹ 5,000 |
| SBI Magnum Midcap Fund | ₹ 500 | ₹ 5,000 |
Analysis
- SIP (Systematic Investment Plan): SBI Magnum Midcap Fund offers a lower entry barrier with a minimum SIP amount of ₹500, making it more accessible for small investors than Quant Mid Cap Fund’s ₹1,000.
Lumpsum Investment: Both funds require a minimum investment of ₹5,000, providing a level playing field for one-time investors
Key Takeaway
- SBI Magnum Midcap Fund has a larger AUM, indicating a higher scale of operations.
- Quant Mid Cap Fund has a higher NAV, suggesting better historical performance.
- SBI Magnum Midcap Fund has a lower minimum SIP investment amount, making it more accessible for small investors.
Conclusion
Quant Mid Cap Fund is the superior choice across most parameters when investing in midcap funds, offering higher returns, better risk-adjusted performance, and more experienced fund management. For investors seeking robust growth and willing to accept a moderate level of risk, Quant Mid Cap Fund is the better option.
However, for those with a lower risk appetite who prefer a larger fund with potentially more stable performance over specific periods, the SBI Magnum Midcap Fund might be more suitable. Ultimately, your choice should line up with your financial goals, risk tolerance, and investment horizon.

We hope you found this guide on mutual funds helpful.
If you have any mutual fund-related queries, feel free to comment below—we’re here to help! S.K. Singh, a registered professional with the Association of Mutual Funds in India (AMFI), will answer your queries and holds the ARN-251149.
Invest wisely!
FAQs: Quant Mid Cap Fund vs SBI Magnum Midcap Fund
1. What are the critical differences in the investment styles of Quant Mid Cap Fund and SBI Magnum Midcap Fund?
Quant Mid Cap Fund follows a blended style. It invests in value and growth stocks, providing a balanced approach with moderate risk and returns. On the other hand, SBI Magnum Midcap Fund follows a growth style, focusing on stocks with high growth potential, which may be more volatile but offer higher growth opportunities.
2. Which fund has shown better historical returns?
Quant Mid Cap Fund has consistently outperformed SBI Magnum Midcap Fund across all timeframes, including 1, 2, 3, 5, and 10-year periods. This makes it a strong contender for investors looking for higher returns.
3. How do the funds compare in terms of SIP returns?
Quant Mid Cap Fund shines in SIP returns, offering higher growth across all timeframes than SBI Magnum Midcap Fund, which delivers respectable returns but lags behind Quant Mid Cap Fund.
4. What is the performance of these funds in terms of lump sum investment growth?
Quant Mid Cap Fund shows superior growth in lump sum investments, especially over the long term (5 and 10-year periods). While SBI Magnum Midcap Fund provides good growth, it is overshadowed by the performance of Quant Mid Cap Fund.
5. How do the funds fare regarding the Compound Annual Growth Rate (CAGR)?
Quant Mid Cap Fund has a higher CAGR across all periods, indicating more substantial growth potential than SBI Magnum Midcap Fund, which shows a stable but lower CAGR.
6. Which fund offers better rolling returns?
Quant Mid Cap Fund shows strong consistency but slightly trails behind SBI Magnum Midcap Fund in rolling returns for 1 and 9-year periods. However, it remains strong overall.
7. How do these funds perform in the best and worst quarters?
Quant Mid Cap Fund performed better during the best quarters, showing resilience in positive market phases. Conversely, SBI Magnum Midcap Fund experienced a more significant drop during the worst quarter, indicating higher volatility.
8. What does the maximum drawdown indicate about these funds?
Quant Mid Cap Fund had a higher drawdown in the 3 years but fared better in the 5 years than SBI Magnum Midcap Fund, which experienced a lower drawdown in the 3 years but significantly higher over 5 years.
9. Which fund has better risk-adjusted returns?
Quant Mid Cap Fund exhibits better risk-adjusted returns with higher mean Return, Sortino Ratio, and Treynor’s Ratio. SBI Magnum Midcap Fund has a lower standard deviation over 3 years but higher over 5 and 10 years.
10. How do Beta and Alpha values compare for these funds?
Quant Mid Cap Fund has a higher beta over 3 years and a slightly lower Beta over 5 years, indicating more short-term volatility but stabilizing over the long term. It also shows a significantly higher Alpha, suggesting superior performance compared to the benchmark.
11. What are the critical differences in portfolio composition between the funds?
Quant Mid Cap Fund has a higher equity allocation and a small allocation to debt. At the same time, SBI Magnum Midcap Fund holds more cash equivalents. Quant Mid Cap Fund has a more concentrated portfolio with fewer stocks and a higher allocation to large caps. In contrast, SBI Magnum Midcap Fund offers broader diversification with more stocks and a higher allocation to mid and small caps.
12. How do the sector allocations differ between these funds?
Quant Mid Cap Fund has higher allocations in the Industrials, Materials, Energy & Utilities, and Technology sectors. In contrast, SBI Magnum Midcap Fund focuses more on consumer discretion and has a more diversified sector allocation.
13. Which fund has more experienced fund managers?
Quant Mid Cap Fund benefits from more experienced fund managers with longer tenure than SBI Magnum Midcap Fund, which has newly appointed fund managers.
14. What are the NAV and AUM details for these funds?
As of the latest data, Quant Mid Cap Fund has an NAV of ₹246.44 and an AUM of ₹6920 crore, while SBI Magnum Midcap Fund has an NAV of ₹229.41 and an AUM of ₹17910 crore.
15. What is the minimum investment amount required for these funds?
Quant Mid Cap Fund requires a minimum SIP investment of ₹1,000 and a lumpsum investment of ₹5,000. SBI Magnum Midcap Fund requires a lower minimum SIP investment of ₹500 and the same lumpsum investment of ₹5,000.
16. Which fund is better suited for different risk appetites?
Quant Mid Cap Fund is better for investors seeking higher returns and willing to accept moderate risk. SBI Magnum Midcap Fund might be more suitable for those with a lower risk appetite who prefer a larger fund with potentially more stable performance over specific periods.
.
Disclaimer:
The information provided in this article is solely the author/advertisers’ opinion and not investment advice – it is provided for educational purposes only. Using this, you agree that the information does not constitute any investment or financial instructions by Ace Equity Research/Mutual Fund Focus/IPO First and the team. Anyone wishing to invest should seek their own independent financial or professional advice. Conduct your research with registered financial advisors before making any investment decisions. Ace Equity Research/ Mutual Fund Focus / IPO First and the team are not accountable for the investment views provided in the article.
Mutual Fund investments are subject to market risks. Read all scheme-related documents carefully.
Investments in the securities market are subject to market risks. Read all the related documents carefully before investing.
I