
You’re in the right place if you’re planning to invest in PSU funds and are torn between the SBI PSU Fund vs Invesco India PSU Equity Fund. This blog will dive deep into a comprehensive five-step comparative analysis of these two PSU mutual funds, helping you make an informed decision. We’ll explore their investment styles, returns, and overall Performance to determine which fund stands out for long-term Investment. So, let’s get started!
Investment Style
The SBI PSU Fund and the Invesco India PSU Equity Fund adopt a Blend investment style. This means they invest in a mix of large, medium, and small-cap stocks, offering a balanced approach to growth and stability.
| Fund | Investment Style |
| SBI PSU Fund | Blend |
| Invesco India PSU Equity Fund | Blend |

Returns Analysis
Trailing Returns
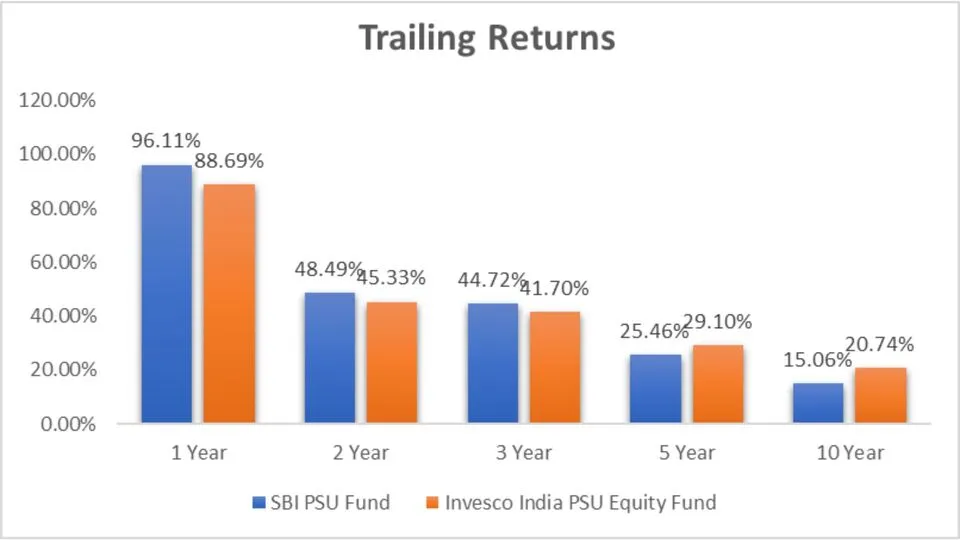
When comparing the trailing returns, it’s crucial to analyse the Performance over different periods. Here’s a breakdown:
Analysis
1-Year Performance
In the last year, the SBI PSU Fund outperformed the Invesco India PSU Equity Fund, delivering an impressive 96.11% return compared to 88.69%. If you’re looking for short-term gains, the SBI PSU Fund seems more lucrative.
2-Year Performance
Over two years, both funds showed strong Performance, but the SBI PSU Fund slightly edged out, with 48.49%, against Invesco’s 45.33%.
3-Year Performance
For three-year returns, SBI PSU Fund still maintains a slight lead with 44.72%, compared to Invesco’s 41.70%.
5-Year Performance
However, the scenario flips when we look at the five-year returns. Here, the Invesco India PSU Equity Fund takes the lead with 29.10% against the SBI PSU Fund’s 25.46%.
10-Year Performance
For a long-term horizon, Invesco shines brighter with a 20.74% return over ten years, compared to SBI’s 15.06%.
Lumpsum Investment Value
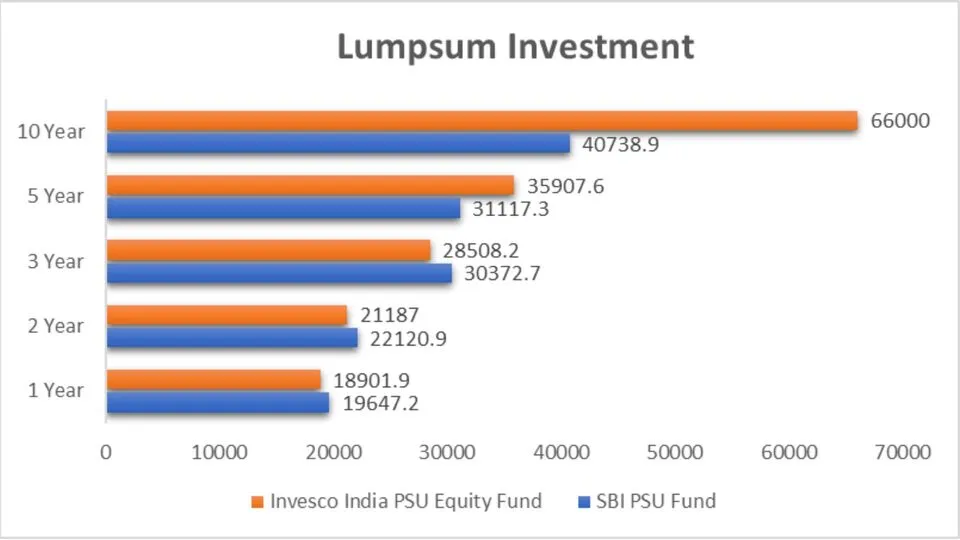
Here’s how much your lumpsum Investment would have grown over different periods:
Analysis
1-Year Investment
A ₹10,000 investment in the SBI PSU Fund a year ago would now be worth ₹19,647.2, slightly more than Invesco’s ₹18,901.9.
2-Year Investment
Over two years, your Investment in SBI would grow to ₹22,120.9, while Invesco would yield ₹21,187.
3-Year Investment
For a three-year horizon, SBI again leads with ₹30,372.7, compared to Invesco’s ₹28,508.2.
5-Year Investment
However, a five-year investment turns the tables, with Invesco growing your ₹10,000 to ₹35,907.6, significantly more than SBI’s ₹31,117.3.
10-Year Investment
For a decade-long investment, Invesco dominates with an impressive ₹66,000 return, far surpassing SBI’s ₹40,738.9.
Key Takeaways
- Short-Term Gains: For short-term investors (1-3 years), SBI PSU Fund has shown slightly better returns than Invesco India PSU Equity Fund.
- Long-Term Investment: For those with a long-term perspective (5-10 years), Invesco India PSU Equity Fund stands out with significantly higher returns.
- Investment Style: Both funds follow a blend style, making them suitable for investors looking for a balanced approach.
- Lumpsum Growth: Over a decade, investments in Invesco India PSU Equity Fund would have grown substantially more than in SBI PSU Fund.
- Consistency: While the SBI PSU Fund performs better in the short term, the Invesco India PSU Equity Fund is more consistent and rewarding in the long run.
SIP Returns
Analysis
1-Year Performance
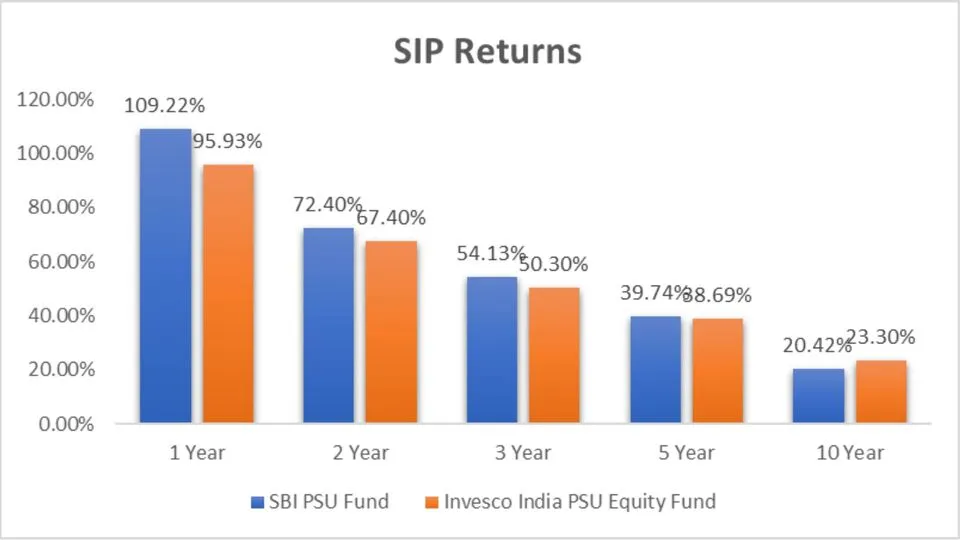
For a 1-year SIP, the SBI PSU Fund has delivered a staggering return of 109.22%, clearly outperforming Invesco India PSU Equity Fund’s 95.93%. If short-term gains are your goal, SBI is the front-runner here.
2-Year Performance
Over 2 years, the SBI PSU Fund continues to lead with a return of 72.40%, while the Invesco India PSU Equity Fund follows closely with 67.40%.
3-Year Performance
In the 3 years, the SBI PSU Fund again takes the upper hand with a return of 54.13% compared to Invesco’s 50.30%.
5-Year Performance
For a medium-term investment of 5 years, SBI PSU Fund shows a slight edge with a return of 39.74%. In contrast, Invesco India PSU Equity Fund yields 38.69%.
10-Year Performance
Regarding long-term Investment, Invesco India PSU Equity Fund shines with a return of 23.30%, outperforming SBI PSU Fund’s 20.42%.
SIP Investment Value
Analysis
1-Year SIP Investment Value
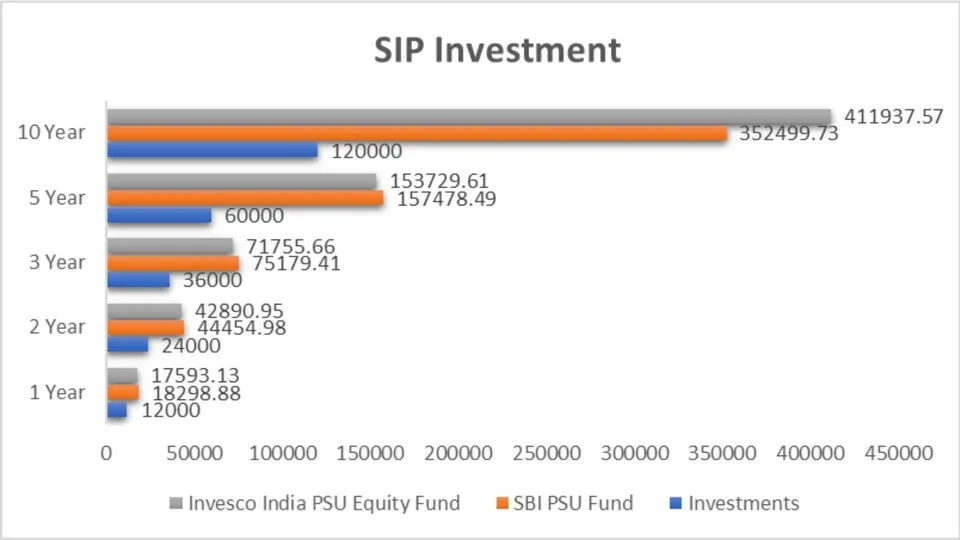
Investing ₹12,000 over a year in SBI PSU Fund would have grown to ₹18,298.88, slightly more than Invesco’s ₹17,593.13.
2-Year SIP Investment Value
For a 2-year period, a ₹24,000 investment in SBI PSU Fund would now be worth ₹44,454.98, compared to Invesco’s ₹42,890.95.
3-Year SIP Investment Value
In a 3-year timeframe, a ₹36,000 investment in SBI PSU Fund grows to ₹75,179.41, while Invesco yields ₹71,755.66.
5-Year SIP Investment Value
Over 5 years, a ₹60,000 investment in SBI PSU Fund would be worth ₹1,57,478.49, narrowly edging out Invesco’s ₹1,53,729.61.
10-Year SIP Investment Value
For a decade-long SIP, Invesco India PSU Equity Fund takes the lead with a significant growth to ₹4,11,937.57 from a ₹1,20,000 investment, compared to SBI’s ₹3,52,499.73.
Key Takeaways
- Short-Term Gains: For a short-term SIP (1-3 years), SBI PSU Fund has shown better returns compared to Invesco India PSU Equity Fund. For instance, a 1-year SIP in SBI grows to ₹18,298.88 from ₹12,000, while Invesco reaches ₹17,593.13.
- Medium-Term Performance: Over a 5-year period, both funds perform closely, but SBI PSU Fund has a slight edge with a return of 39.74%, leading to a value of ₹1,57,478.49 from ₹60,000.
- Long-Term Investment: For long-term SIPs (10 years), Invesco India PSU Equity Fund outperforms with a return of 23.30%, turning a ₹1,20,000 investment into ₹4,11,937.57, compared to SBI’s ₹3,52,499.73.
- Consistency and Growth: While SBI PSU Fund delivers better short-term returns, Invesco India PSU Equity Fund is more consistent in the long term, providing higher growth and better returns over a decade.
- Investment Strategy: Depending on your investment horizon and goals, you can choose the fund that aligns with your financial strategy. For quick gains, the SBI PSU Fund is preferable. However, Invesco India PSU Equity Fund stands out for building substantial wealth over extended periods.
CAGR Analysis
CAGR (Compound Annual Growth Rate) is a crucial metric for understanding the growth of an investment over time. Let’s compare the CAGR of both funds over different periods.
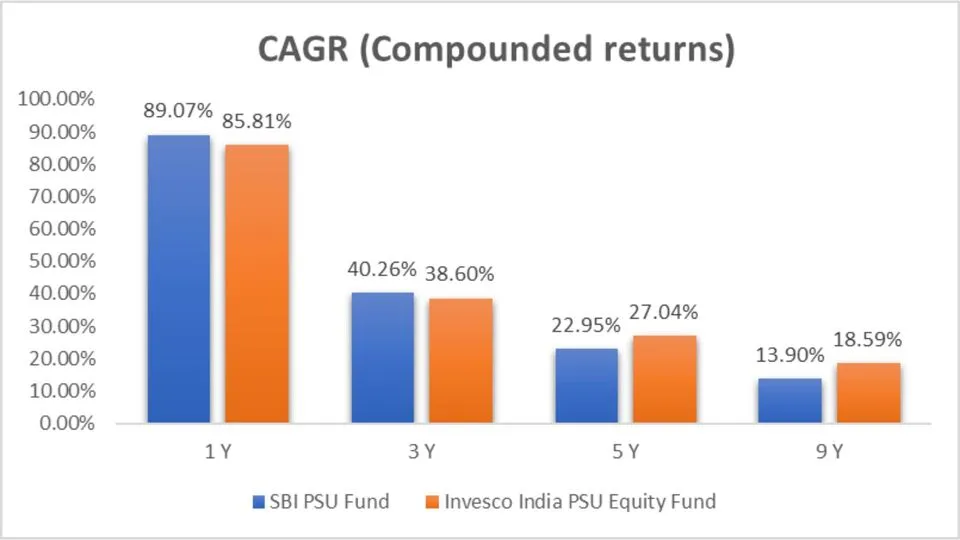
Analysis
- 1-Year CAGR: SBI PSU Fund leads with 89.07% compared to Invesco’s 85.81%.
- 3-Year CAGR: SBI continues to edge out Invesco, achieving 40.26% versus 38.60%.
- 5-Year CAGR: The performance gap narrows, with SBI at 22.95% and Invesco at 27.04%.
- 9-Year CAGR: Invesco surpasses SBI, showing 18.59% against SBI’s 13.90%.
Rolling Returns
Rolling returns provide a better perspective on the consistency of a fund’s Performance. Here’s how both funds stack up over different periods.
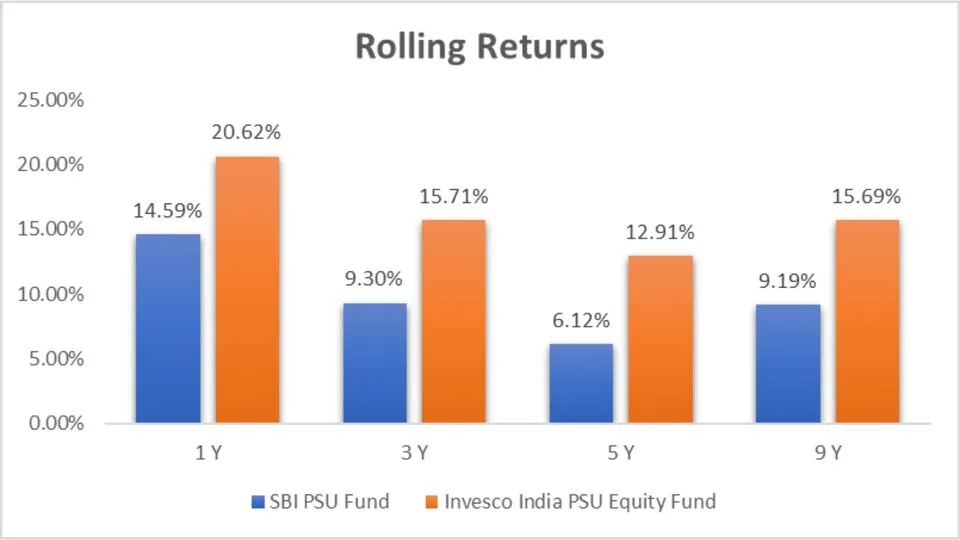
Analysis
- 1-Year Rolling Returns: Invesco outperforms with 20.62%, whereas SBI shows 14.59%.
- 3-Year Rolling Returns: Invesco maintains the lead with 15.71%, and SBI follows with 9.30%.
- 5-Year Rolling Returns: Invesco remains ahead at 12.91%, compared to SBI’s 6.12%.
- 9-Year Rolling Returns: Invesco continues to outperform with 15.69%, while SBI delivers 9.19%.
Annualized/Calendar Year Returns
Analyzing annualized returns provides insights into how each fund has performed year over year.
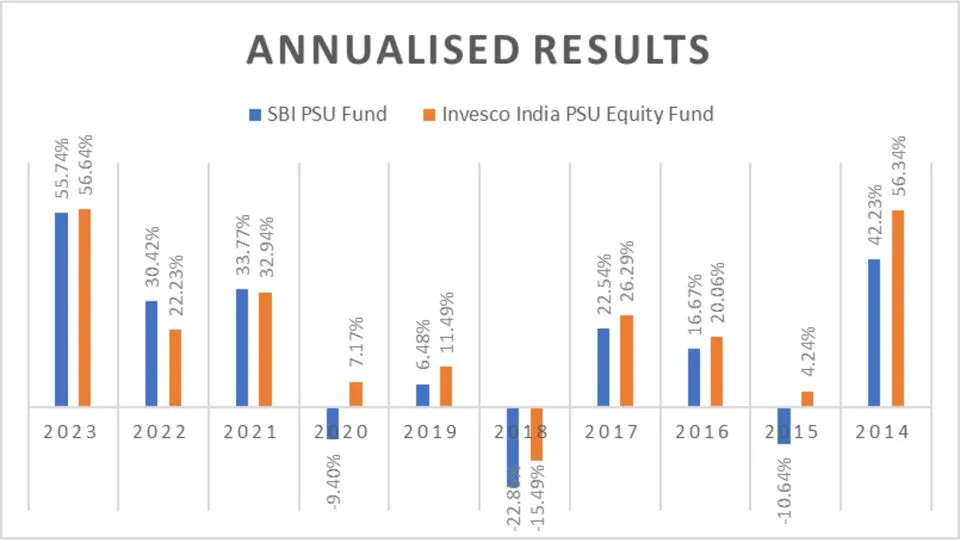
Analysis
- 2023: Invesco slightly outperformed SBI with returns of 56.64% against 55.74%.
- 2022: SBI led with 30.42%, while Invesco achieved 22.23%.
- 2021: Both funds performed similarly, with SBI at 33.77% and Invesco at 32.94%.
- 2020: Invesco showed resilience with 7.17%, while SBI had a negative return of -9.40%.
- 2019: Invesco outperformed with 11.49%, compared to SBI’s 6.48%.
- 2018: Both funds faced a downturn, but Invesco managed better at -15.49% against SBI’s -22.86%.
- 2017: Invesco led with 26.29%, while SBI followed with 22.54%.
- 2016: Invesco outperformed SBI by 20.06% versus SBI by 16.67%.
- 2015: Invesco showed positive returns at 4.24%, while SBI had -10.64%.
- 2014: Invesco significantly outperformed SBI by 56.34%, compared to SBI’s 42.23%.
Overall Outperformance
| Fund | No. of times Outperformance |
| SBI PSU Fund | 2 |
| Invesco India PSU Equity Fund | 8 |
Key Takeaways
- CAGR Insights:
- For the short term (1-3 years), the SBI PSU Fund has a slightly higher CAGR.
- Invesco India PSU Equity Fund outshines for longer terms (5-9 years).
- Rolling Returns:
- Invesco leads in rolling returns across all periods (1-9 years), indicating better consistency and stability.
- Annualized Returns:
- Over the past decade, Invesco India PSU Equity Fund has outperformed SBI PSU Fund in 8 out of 10 years.
Quarterly Results
Quarterly Performance can reveal how funds react to market volatility. Here’s the quarterly performance comparison:
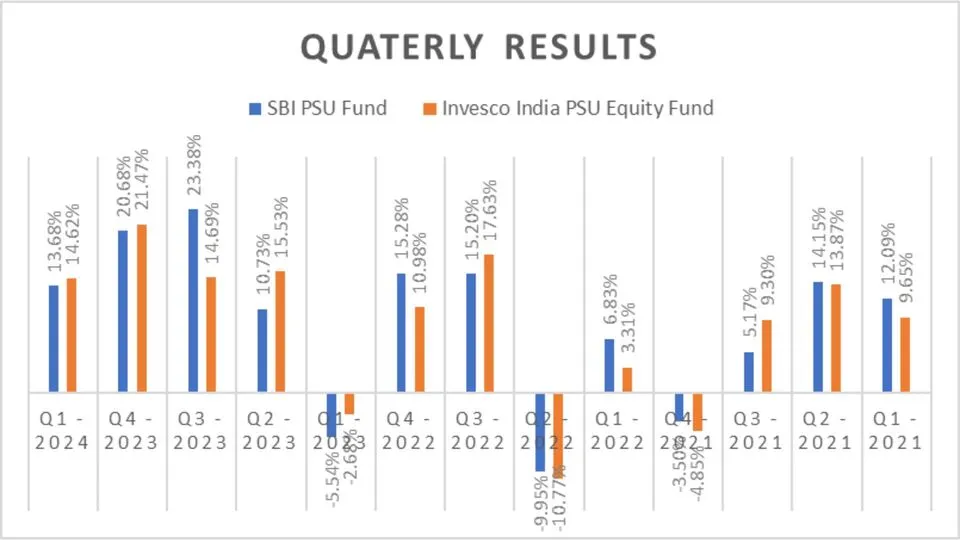
Outperformance Analysis
| Fund | No. of times Outperformance |
| SBI PSU Fund | 7 |
| Invesco India PSU Equity Fund | 6 |
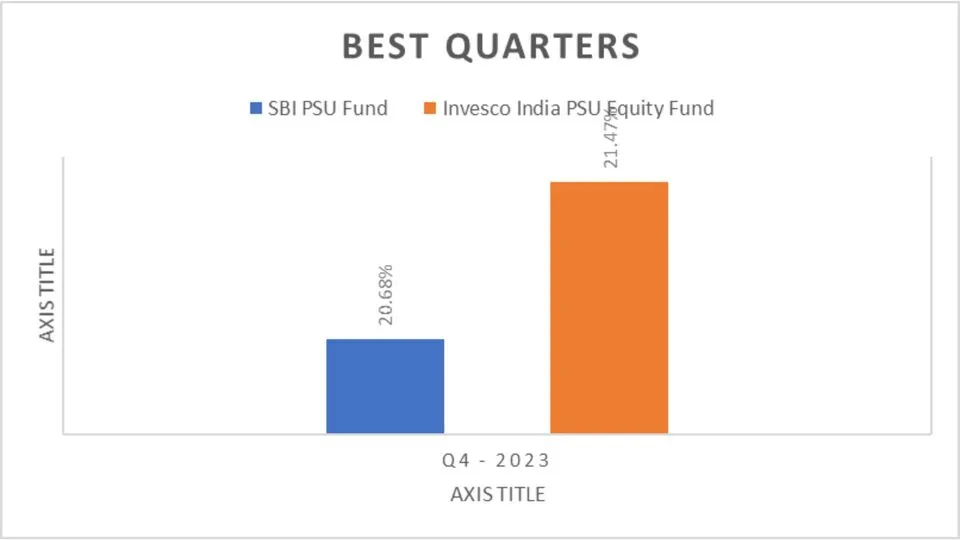
Best Quarters
Identifying the best quarters can highlight the periods of maximum Performance

Worst Quarters
Knowing the worst quarters can prepare you for potential downsides.

Key Takeaways
- CAGR Insights:
- Short-Term (1-3 years): SBI PSU Fund has a slightly higher CAGR.
- Long-Term (5-9 years): Invesco India PSU Equity Fund outshines SBI.
- Rolling Returns:
- Invesco leads in rolling returns across all periods (1-9 years), indicating better consistency and stability.
- Quarterly Performance:
- Both funds have shown strong quarterly Performance, with SBI leading in 7 out of the last 13 quarters.
- Best and Worst Quarters:
- Best Quarter: In Q4 2023, Invesco slightly outperformed SBI.
- Worst Quarters: Invesco has shown better resilience during downturns.


Risk Analysis
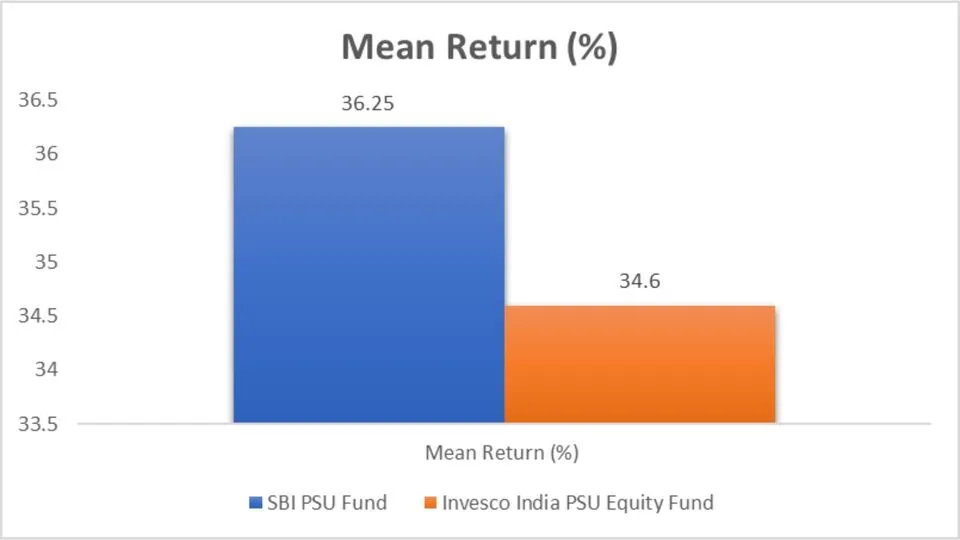
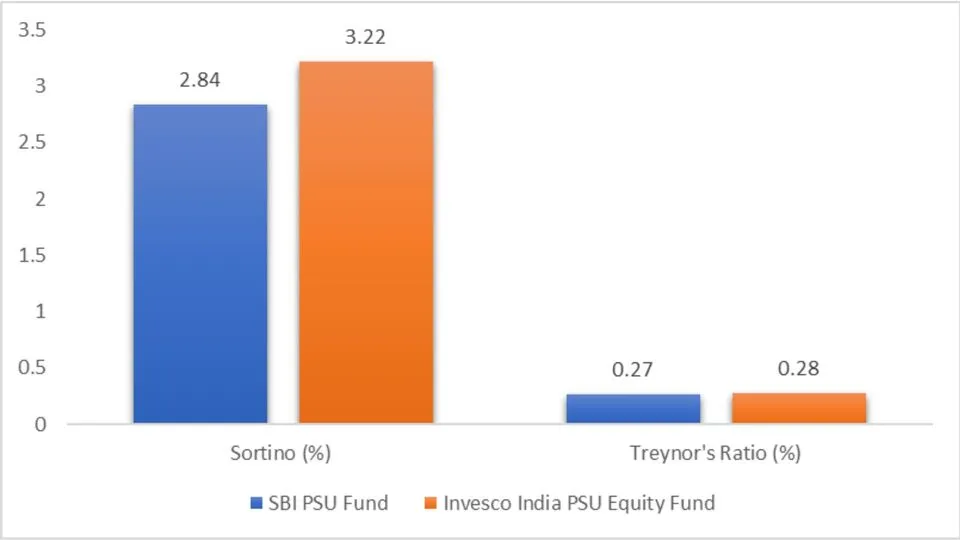
Mean Return, Sortino Ratio, and Treynor’s Ratio
Analysis
- Mean Return: SBI PSU Fund leads with a mean return of 36.25% compared to Invesco’s 34.6%.
- Sortino Ratio: Invesco India PSU Equity Fund outperforms with a Sortino ratio 3.22, indicating better risk-adjusted returns.
- Treynor’s Ratio: Invesco also edges out SBI with a Treynor’s Ratio of 0.28 versus SBI’s 0.27.
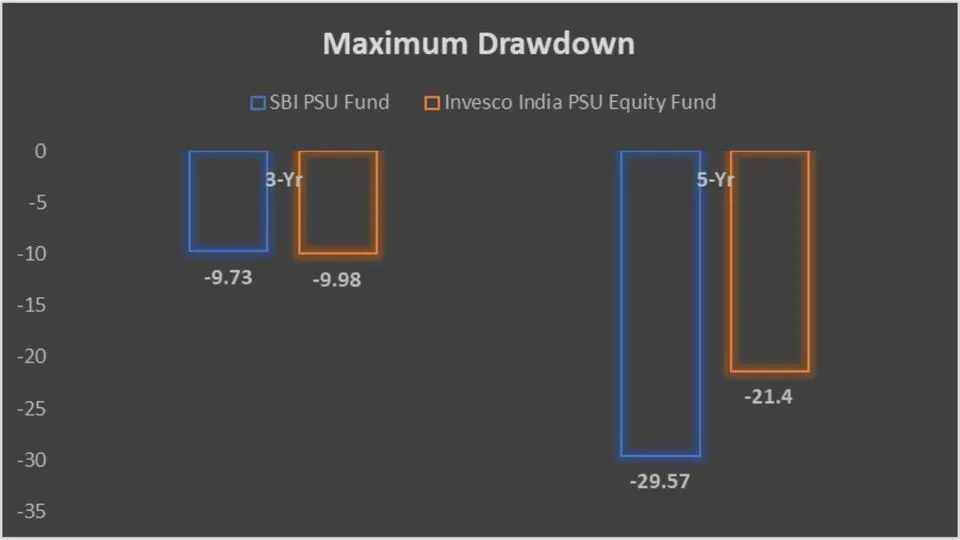
Maximum Drawdown
Analysis
- 3-Year Drawdown: SBI PSU Fund has a slightly better maximum drawdown at -9.73% than Invesco’s -9.98%.
- 5-Year Drawdown: Invesco significantly outperforms with a drawdown of -21.4% against SBI’s -29.57%.
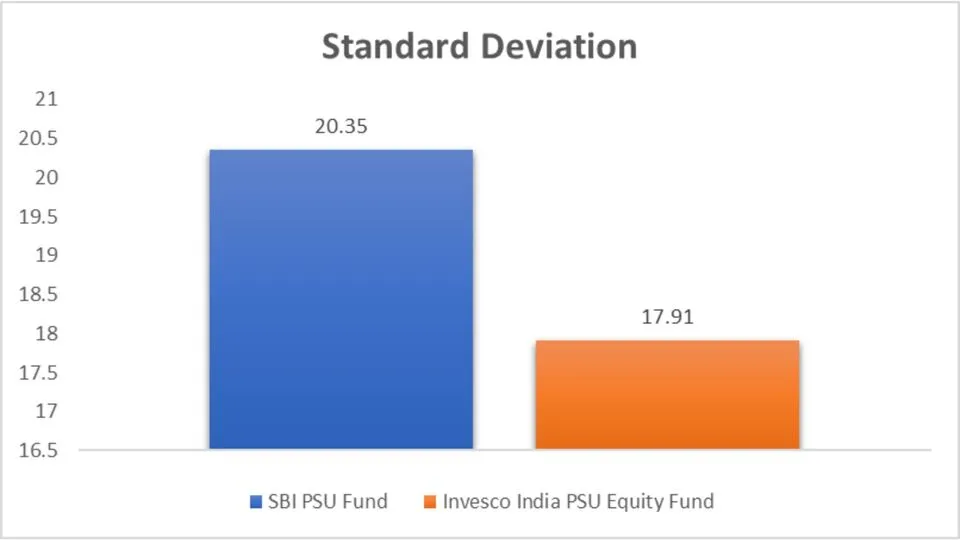
Standard Deviation
Analysis
- Standard Deviation: Invesco India PSU Equity Fund has a lower standard deviation of 17.91%, indicating less volatility than SBI’s 20.35%.
Sharpe Ratio
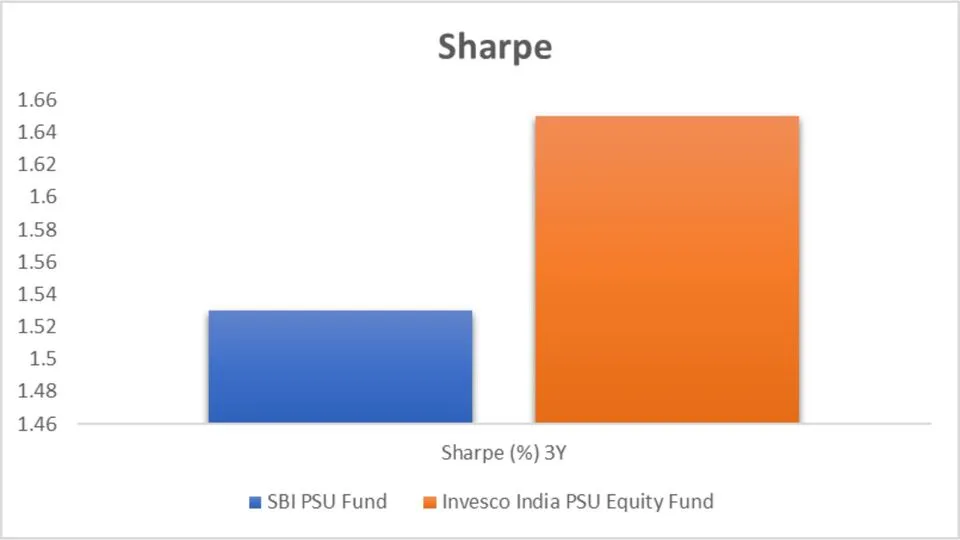
Analysis
- Sharpe Ratio: Invesco leads with a Sharpe ratio of 1.65, suggesting better risk-adjusted returns compared to SBI’s 1.53.
Beta
Analysis
- Beta: Invesco India PSU Equity Fund has a lower beta at 0.83, indicating lower market risk than SBI’s 0.95.
Alpha
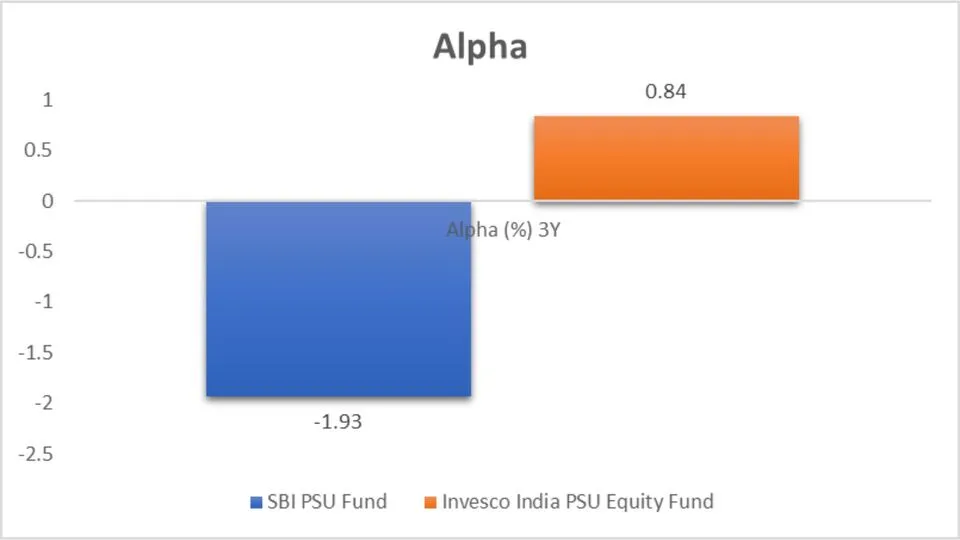
Analysis
- Alpha: Invesco outperforms with a positive alpha of 0.84%, whereas SBI has a negative alpha of -1.93%, indicating that Invesco has delivered returns above the benchmark.
Key Takeaways
- Mean Return:
- SBI PSU Fund has a higher mean return at 36.25% compared to Invesco’s 34.6%.
- Risk-Adjusted Returns:
- Invesco India PSU Equity Fund outshines in terms of Sortino ratio (3.22), Treynor’s Ratio (0.28), and Sharpe ratio (1.65).
- Volatility and Market Risk:
- Invesco has a lower standard deviation (17.91%) and beta (0.83), indicating less volatility and lower market risk than SBI.
- Maximum Drawdown:
- Over the 5 years, Invesco shows a better maximum drawdown (-21.4%) than SBI (-29.57%).
- Alpha:
- Invesco has a positive alpha (0.84%), indicating better Performance above the benchmark, whereas SBI has a negative alpha (-1.93%).
Based on the risk metrics, Invesco India PSU Equity Fund offers better risk-adjusted returns with lower volatility and market risk. SBI PSU Fund might appeal to investors seeking higher mean returns but should be cautious of its higher volatility and lower risk-adjusted Performance.
Portfolio Analysis
We’ll dive deep into a comprehensive portfolio analysis of the SBI PSU Fund and the Invesco India PSU Equity Fund. We’ll explore portfolio overlap, comparison, market cap allocation, and sector allocation to clearly show where your money might perform best.
Portfolio Overlapping Comparison
Understanding the overlap in portfolios can provide insights into how similar or different two funds are in their investment approaches. Here’s the portfolio overlap between the SBI PSU Fund and the Invesco India PSU Equity Fund.

Analysis
- Overlap: The Invesco India PSU Equity Fund has a higher portfolio overlap at 56.36% compared to SBI’s 48.37%, indicating a slightly more concentrated investment approach.
Portfolio Comparison
Let’s break down the portfolio composition of each fund to see where their investments are allocated.

Analysis
- Equity Allocation: Invesco leads with 96.94% of its portfolio in equities, compared to SBI’s 91.05%.
- Cash & Cash Equivalents: SBI holds more cash and cash equivalents at 8.95% versus Invesco’s 3.06%.
Market Cap Allocation
Market cap allocation shows how the funds distribute their investments across different sizes of companies.
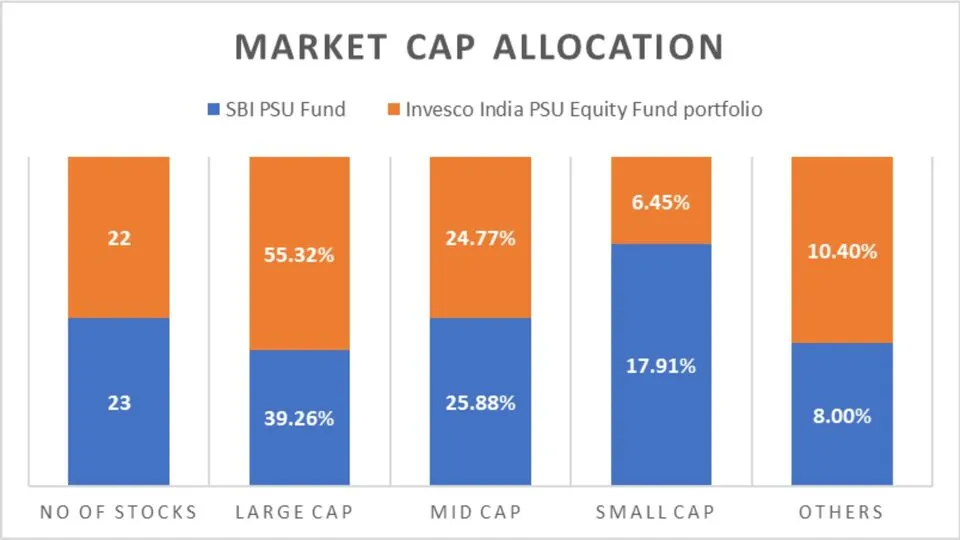
Analysis
- Number of Stocks: SBI holds a slightly higher number of stocks (23) than Invesco (22).
- Large Cap Allocation: Invesco has a significantly higher large-cap allocation at 55.32%, whereas SBI allocates 39.26%.
- Mid-Cap Allocation: Both funds have similar mid-cap allocations, with SBI at 25.88% and Invesco at 24.77%.
- Small Cap Allocation: SBI invests more in small caps at 17.91% compared to Invesco’s 6.45%.
Sector Allocation
Sector allocation reveals the distribution of investments across various industry sectors.
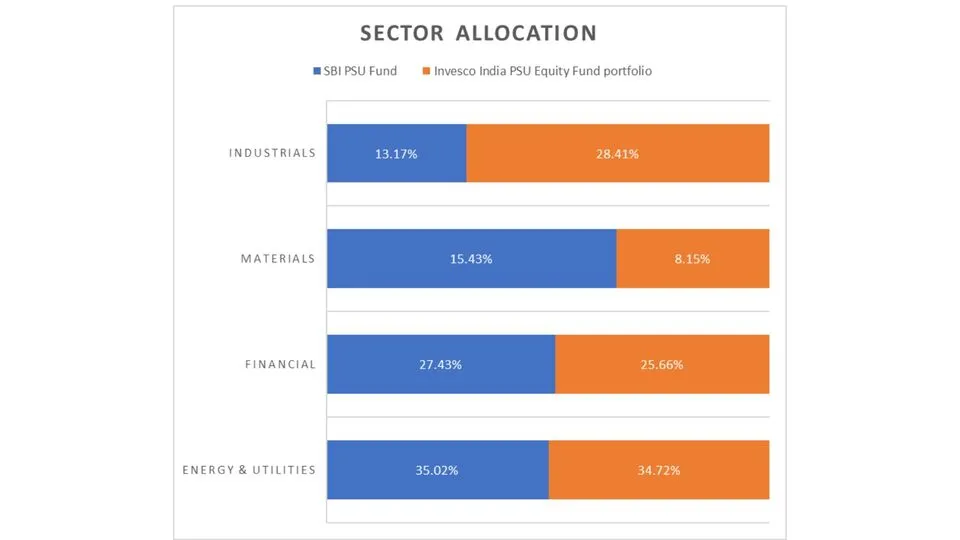
Analysis
- Energy & Utilities: Both funds have similar allocations, with SBI at 35.02% and Invesco at 34.72%.
- Financial: SBI has a higher allocation in the financial sector at 27.43% compared to Invesco’s 25.66%.
- Materials: SBI leads with 15.43% in materials, while Invesco allocates only 8.15%.
- Industrials: Invesco significantly outperforms SBI by 28.41% in industrials, compared to SBI’s 13.17%.
Key Takeaways
- Portfolio Overlap: Invesco India PSU Equity Fund shows a higher portfolio overlap, indicating a more concentrated approach.
- Equity Exposure: Invesco has a higher equity exposure, which might appeal to investors seeking aggressive growth.
- Market Cap Allocation: Invesco invests more in large-cap stocks, suggesting stability and blue-chip focus, while SBI has a balanced approach across large, mid, and small caps.
- Sector Allocation: SBI has a diversified sector allocation with significant investments in materials, while Invesco strongly focuses on industrials.
Fund Management Comparison
The experience and tenure of fund managers can significantly influence the Performance of a mutual fund. Here’s a look at the fund management of both funds.
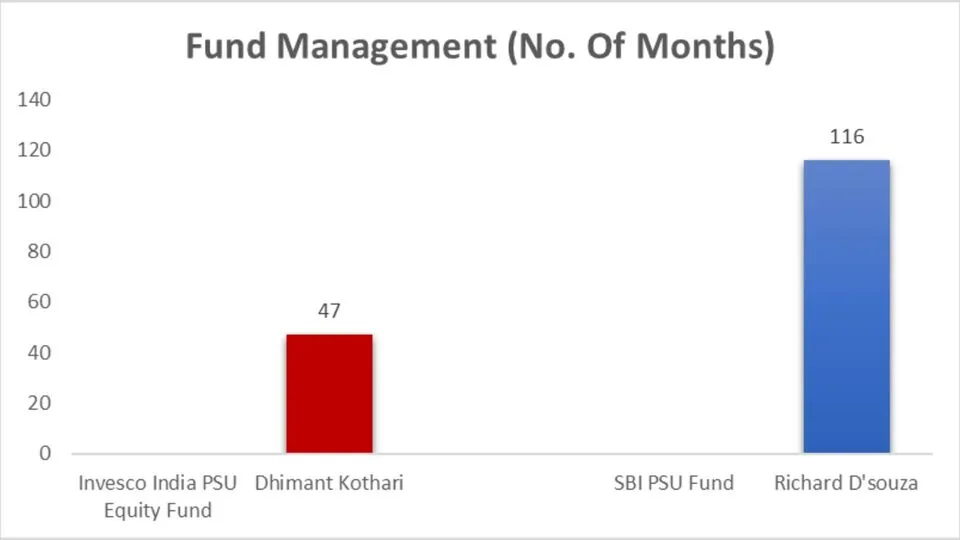
Analysis
- Dhimant Kothari has managed the Invesco India PSU Equity Fund for 47 months since May 2020.
- Richard D’souza has been at the helm of the SBI PSU Fund for 116 months since August 2014, providing a longer track record of fund management.
Other Important General Details
Understanding the fundamental details of each fund can provide insights into their operational efficiency and financial health.

Analysis
- NAV (Net Asset Value): Invesco’s NAV stands at 67.65, higher than SBI’s 33.01.
- AUM (Assets Under Management): SBI PSU Fund manages ₹1875 crore, significantly more than Invesco’s ₹858 crore.
- Expense Ratio: Invesco has a slightly lower expense ratio (0.93%) than SBI’s 0.96%.
- Turnover: Both funds have the same turnover rate at 45%.
Minimum Investment Amount
Here are both funds’ minimum investment requirements for SIP and lump sum investments.
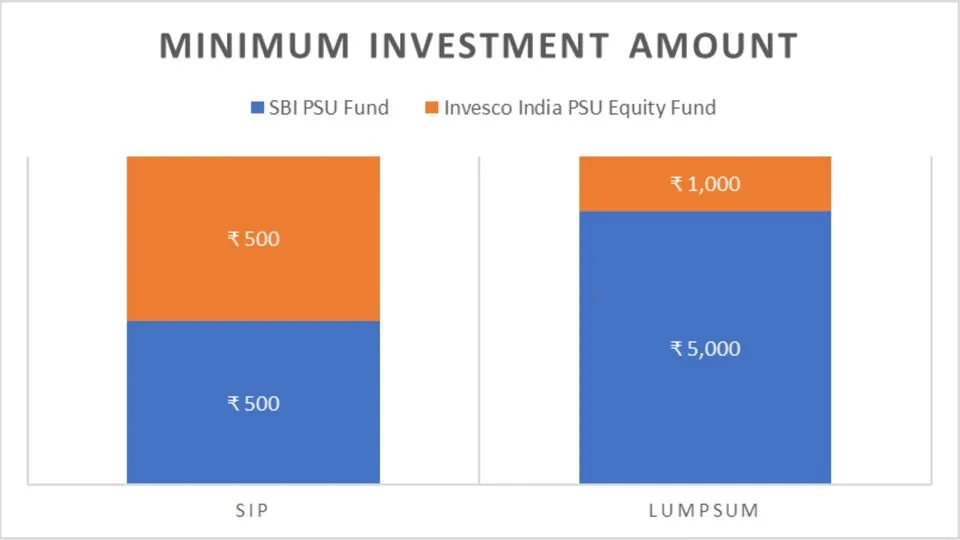
Analysis
- Both funds require a minimum SIP investment of ₹500.
- The minimum lump sum investment for SBI is ₹5,000. In contrast, for Invesco, it is only ₹1,000, making Invesco more accessible for lump sum investors.
Conclusion:
In conclusion, the Invesco India PSU Equity Fund is the better performer in most parameters, including risk-adjusted returns, lower volatility, and higher large-cap exposure, making it a solid choice for long-term, stable growth. However, the SBI PSU Fund excels in short-term Performance and offers higher mean returns, making it suitable for investors with a higher risk looking for short-term gains.
Investors seeking consistent and less volatile returns should consider the Invesco India PSU Equity Fund. At the same time, those with a higher risk tolerance and a preference for aggressive growth might find the SBI PSU Fund more appealing.

We hope you found this guide on mutual funds helpful.
If you have any mutual fund-related queries, feel free to comment below—we’re here to help! S.K. Singh, a registered professional with the Association of Mutual Funds in India (AMFI), will answer your queries and holds the ARN-251149.
Invest wisely!
FAQs – SBI PSU Fund vs Invesco India PSU Equity Fund
Which fund has a better long-term performance, SBI PSU Fund or Invesco India PSU Equity Fund?
Based on long-term performance metrics such as CAGR and rolling returns, the Invesco India PSU Equity Fund outperforms the SBI PSU Fund. Invesco offers higher risk-adjusted returns and lower volatility, making it a better choice for long-term investors seeking stable growth.
What is the minimum investment amount for the SBI PSU Fund and Invesco India PSU Equity Fund?
Both funds require a minimum SIP investment of ₹500. For lump sum investments, the SBI PSU Fund requires ₹5,000. In contrast, the Invesco India PSU Equity Fund is more accessible with a minimum of ₹1,000.
How do the expense ratios of the SBI PSU Fund and Invesco India PSU Equity Fund compare?
The expense ratio for the SBI PSU Fund is 0.96%, while the Invesco India PSU Equity Fund has a slightly lower expense ratio of 0.93%, making Invesco marginally more cost-effective.
Which fund manager has more experience, the manager of the SBI PSU Fund or the Invesco India PSU Equity Fund?
Richard D’souza, the fund manager for the SBI PSU Fund, has a longer tenure of 116 months since August 2014. Dhimant Kothari has been managing the Invesco India PSU Equity Fund for 47 months since May 2020.
What are the primary sector allocations for the SBI PSU Fund and Invesco India PSU Equity Fund?
The SBI PSU Fund has significant allocations in Energy & Utilities (35.02%), Financial (27.43%), and Materials (15.43%). The Invesco India PSU Equity Fund focuses heavily on Industrials (28.41%) and Energy & Utilities (34.72%).
Which fund is more suitable for investors with a high-risk appetite?
Investors with a high-risk appetite seeking aggressive growth might prefer the SBI PSU Fund due to its higher mean returns and significant short-term Performance.
Which fund offers better risk-adjusted returns?
The Invesco India PSU Equity Fund offers better risk-adjusted returns, as indicated by its higher Sortino ratio, Sharpe ratio, and positive alpha, making it ideal for investors looking for stable and consistent returns.
What is the portfolio overlap percentage between SBI PSU Fund and Invesco India PSU Equity Fund?
The portfolio overlap between the SBI PSU Fund and the Invesco India PSU Equity Fund is 48.37% for SBI and 56.36% for Invesco, indicating a higher concentration in Invesco’s portfolio.
Which fund is better for conservative investors?
Conservative investors seeking consistent and less volatile returns should consider the Invesco India PSU Equity Fund, which provides better risk-adjusted returns and lower volatility.
Disclaimer:
The information provided in this article is solely the author/advertisers’ opinion and not investment advice – it is provided for educational purposes only. Using this, you agree that the information does not constitute any investment or financial instructions by Ace Equity Research/Mutual Fund Focus/IPO First and the team. Anyone wishing to invest should seek their own independent financial or professional advice. Conduct your research with registered financial advisors before making any investment decisions. Ace Equity Research/ Mutual Fund Focus / IPO First and the team are not accountable for the investment views provided in the article.
Mutual Fund investments are subject to market risks. Read all scheme-related documents carefully.
Investments in the securities market are subject to market risks. Read all the related documents carefully before investing.