If you’re planning to invest in small-cap funds and are stuck between SBI Small Cap vs Tata Small Cap, you’ve landed in the right place. Both funds are designed for investors looking for growth opportunities in the small-cap space, but which one is the better performer?
Investment Style
| Mutual Fund | Investment Style |
| SBI Small Cap Fund | Growth |
| Tata Small Cap Fund | Growth |

Returns Analysis
Trailing Returns
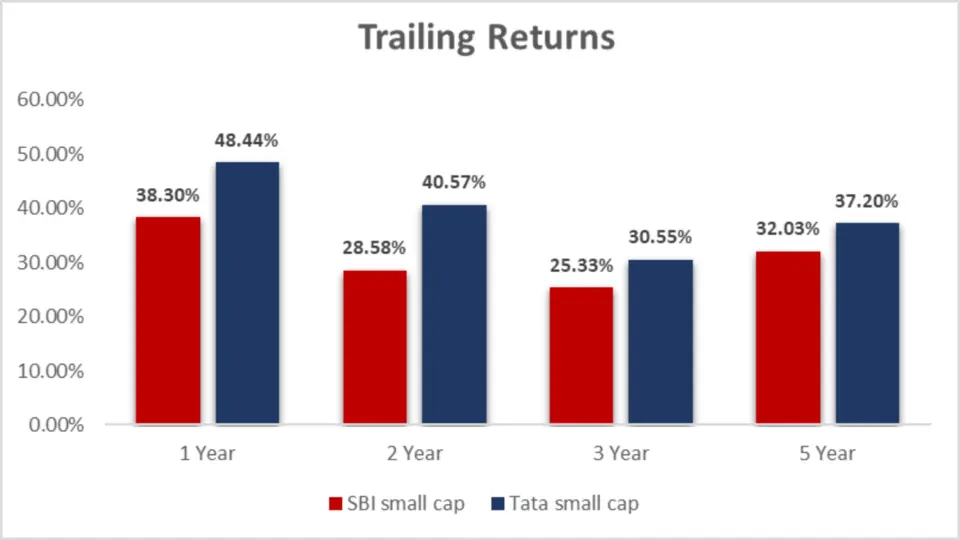
| Period Invested | SBI Small Cap Fund | Tata Small Cap Fund |
| 1 Year | 38.30% | 48.44% |
| 2 Year | 28.58% | 40.57% |
| 3 Year | 25.33% | 30.55% |
| 5 Year | 32.03% | 37.20% |
| 10 Year | Data Unavailable | Data Unavailable |
Analysis
- Over 1 year, Tata Small Cap Fund stands out with a significantly higher return (48.44%) than the SBI Small Cap Fund (38.30%).
- The pattern is similar for 2 years and 3 years, where Tata continues outperforming SBI, boasting returns of 40.57% and 30.55%, respectively.
- For the 5-year horizon, Tata still holds the lead, delivering a return of 37.20%, whereas SBI stands at 32.03%.
Key Takeaway:
Tata Small Cap Fund has consistently delivered higher returns than SBI Small Cap Fund across all periods, making it a strong contender if you’re looking for a high-growth mutual fund in the small-cap category.
Lumpsum Investment Value

| Period Invested | SBI Small Cap Fund | Tata Small Cap Fund |
| 1 Year | ₹13,842.60 | ₹14,860.40 |
| 2 Year | ₹16,543.50 | ₹19,778.10 |
| 3 Year | ₹19,723.00 | ₹22,300.40 |
| 5 Year | ₹40,185.60 | ₹48,691.90 |
| 10 Year | Data Unavailable | NA |
Analysis
- If you had invested a lumpsum in SBI Small Cap Fund for 1 year, your investment would have grown to ₹13,842.60. Meanwhile, in Tata Small Cap Fund, the same investment would have increased to ₹14,860.40.
- Over 5 years, your initial investment in SBI would grow to ₹40,185.60, while in Tata, it would grow to a whopping ₹48,691.90!
Key Takeaway:
The lumpsum investment values show Tata Small Cap consistently yielding higher returns over all periods, making it a superior choice for mutual fund investors looking for long-term growth.
SIP Returns
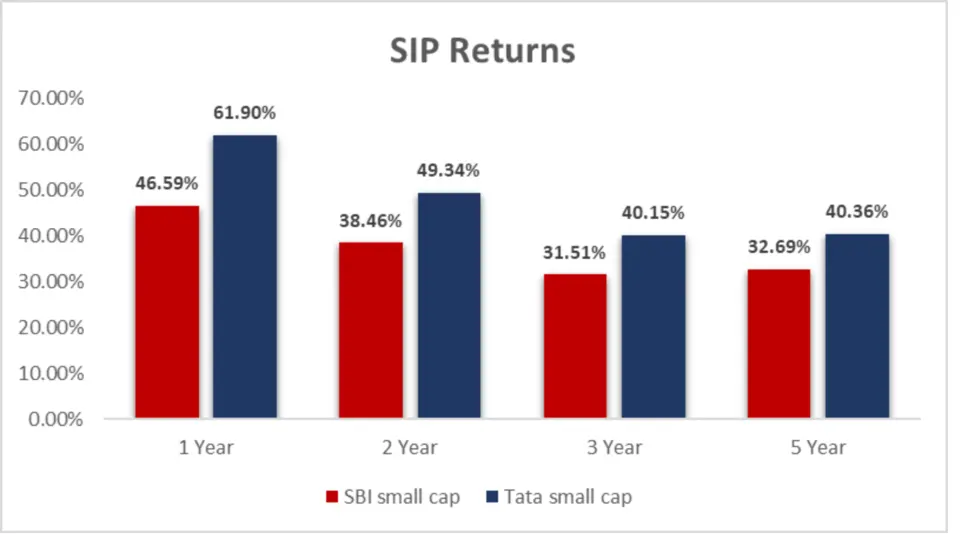
| Period Invested | SBI Small Cap Fund | Tata Small Cap Fund |
| 1 Year | 46.59% | 61.90% |
| 2 Year | 38.46% | 49.34% |
| 3 Year | 31.51% | 40.15% |
| 5 Year | 32.69% | 40.36% |
Analysis
- 1-Year SIP Return: Tata Small Cap Fund wins with an impressive 61.90%, leaving SBI Small Cap Fund behind at 46.59%. That’s a significant gap if you consider a short-term SIP investment.
- 2 Years SIP Return: Tata Small Cap Fund continues its dominance with 49.34%, compared to SBI Small Cap’s 38.46%.
- 3-Year SIP Return: Tata again takes the lead with 40.15%, while SBI shows 31.51%.
- 5-Year SIP Return: Over the longer term, Tata Small Cap delivers 40.36%, while SBI Small Cap shows 32.69%.
Key Takeaway:
Tata Small Cap consistently outperforms SBI Small Cap across all SIP durations. The margin is vast in the shorter durations, making Tata Small Cap an ideal choice if you’re looking for quicker gains. However, Tata Small Cap provides a more attractive return even in the long term.
SIP Investment Value
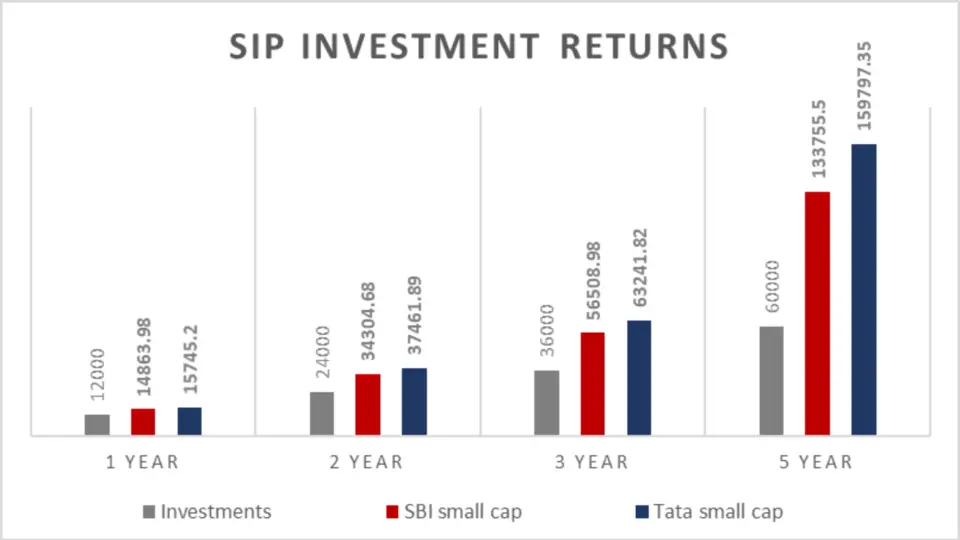
| Period Invested | Investments (₹) | SBI Small Cap Fund | Tata Small Cap Fund |
| 1 Year | 12,000 | ₹14,863.98 | ₹15,745.20 |
| 2 Year | 24,000 | ₹34,304.68 | ₹37,461.89 |
| 3 Year | 36,000 | ₹56,508.98 | ₹63,241.82 |
| 5 Year | 60,000 | ₹1,33,755.50 | ₹1,59,797.35 |
Analysis
- 1 Year: With an investment of ₹12,000 over 1 year, your investment in Tata Small Cap would be valued at ₹15,745.20, compared to ₹14,863.98 in SBI Small Cap.
- 2 Years: For a 2-year investment of ₹24,000, Tata leads again with a value of ₹37,461.89, while SBI is behind with ₹34,304.68.
- 3 Years: Tata continues its outperformance with ₹63,241.82 for a 3-year investment of ₹36,000, while SBI is at ₹56,508.98.
- 5 Years: A 5-year SIP investment of ₹60,000 in Tata would have grown to ₹1,59,797.35, whereas SBI would give you ₹1,33,755.50.
Key Takeaway:
Tata Small Cap clearly offers a higher growth trajectory in SIP investments. Over 5 years, the gap between Tata and SBI becomes even more substantial, with Tata giving you an extra ₹26,000+ compared to SBI.
CAGR (Compound Annual Growth Rate)

CAGR is an essential metric that helps you understand how well a fund has grown annually, considering all the ups and downs.
CAGR Table
| Category | 1 Year | 3 Year | 5 Year |
| SBI Small Cap Fund | 37.41% | 24.16% | 30.41% |
| Tata Small Cap Fund | 45.35% | 26.10% | 33.64% |
Analysis
- 1-Year CAGR: Tata Small Cap Fund shows a better growth rate of 45.35%, while SBI Small Cap comes in at 37.41%.
- 3-Year CAGR: Tata leads again with a 26.10% growth rate compared to 24.16% for SBI.
- 5-Year CAGR: Tata’s CAGR of 33.64% outpaces SBI’s 30.41%.
Key Takeaway:
The CAGR data mirrors the SIP and lumpsum return performance, with Tata Small Cap outperforming SBI across all durations.
Rolling Returns
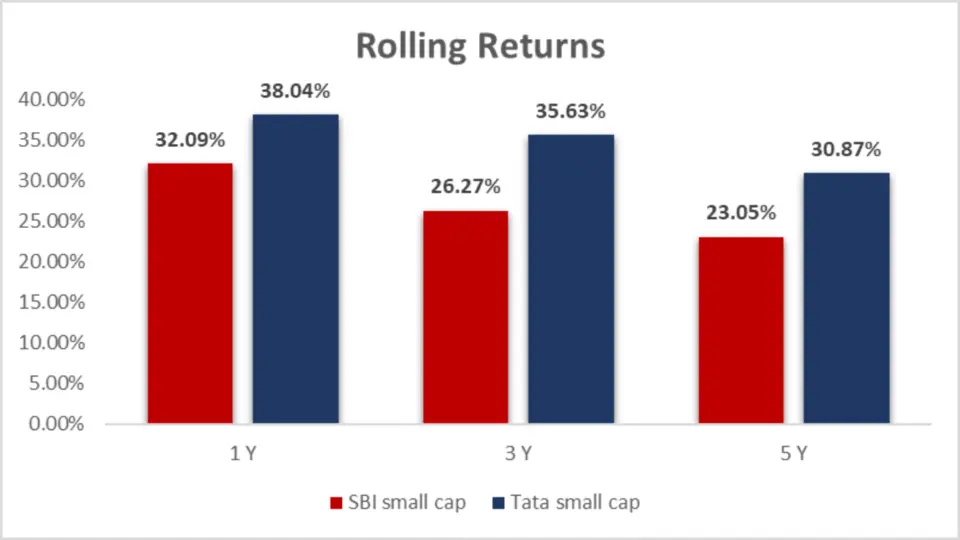
| Category | 1 Year | 3 Year | 5 Year |
| SBI Small Cap Fund | 32.09% | 26.27% | 23.05% |
| Tata Small Cap Fund | 38.04% | 35.63% | 30.87% |
Analysis
- 1-Year Rolling Returns: Tata Small Cap Fund outshines SBI Small Cap Fund with a rolling return of 38.04%, compared to SBI’s 32.09%.
- 3-Year Rolling Returns: Tata remains the leader, offering 35.63% compared to SBI’s 26.27%.
- 5-Year Rolling Returns: Tata Small Cap again leads, giving you 30.87% vs SBI’s 23.05%.
Key Takeaway:
Tata Small Cap has demonstrated greater consistency across different time frames. If consistency is what you’re after, Tata may be the better choice.
Annualized/Calendar Year Returns:
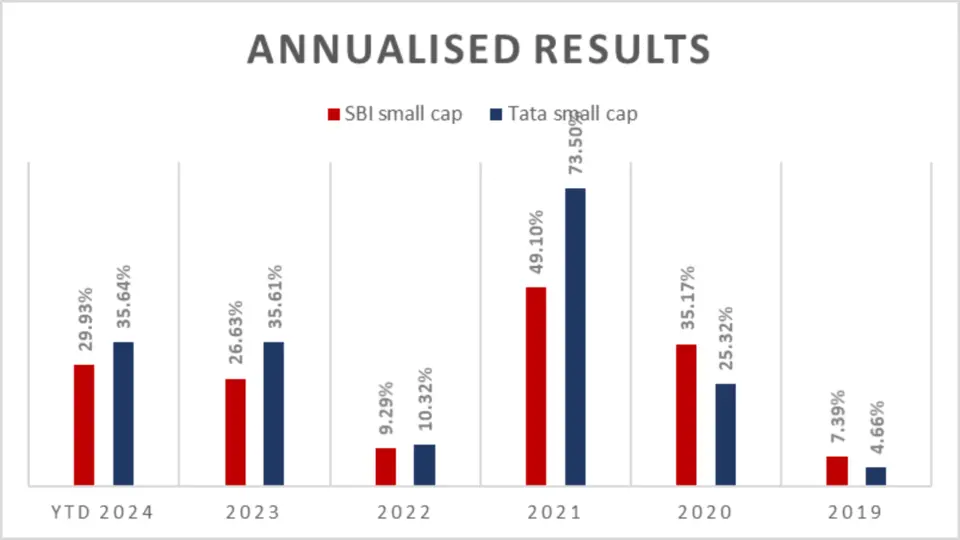
Annualized or calendar-year returns allow us to understand how these funds perform yearly. This gives you a snapshot of how the funds handle various market conditions.
| Period | SBI Small Cap Fund | Tata Small Cap Fund |
| YTD 2024 | 29.93% | 35.64% |
| 2023 | 26.63% | 35.61% |
| 2022 | 9.29% | 10.32% |
| 2021 | 49.10% | 73.50% |
| 2020 | 35.17% | 25.32% |
| 2019 | 7.39% | 4.66% |
Analysis
- 2024 YTD: Tata leads with 35.64%, compared to SBI’s 29.93%.
- 2023: Tata Small Cap Fund delivers better returns at 35.61%, compared to SBI at 26.63%.
- 2022: Both funds perform similarly, with Tata at 10.32% and SBI close at 9.29%.
- 2021: Tata once again blows SBI out of the water with 73.50% compared to SBI’s 49.10%.
- 2020: SBI Small Cap Fund actually performed better in 2020, with 35.17%, while Tata delivered 25.32%.
- 2019: SBI outperformed Tata in 2019, giving 7.39% against Tata’s 4.66%.
Key Takeaway:
While SBI Small Cap has had its moments of outperformance (2019 and 2020), Tata Small Cap Fund has generally delivered higher returns, especially in recent years like 2021 and 2023. If you’re chasing higher year-on-year growth, Tata is clearly the leader.
Quarterly Results
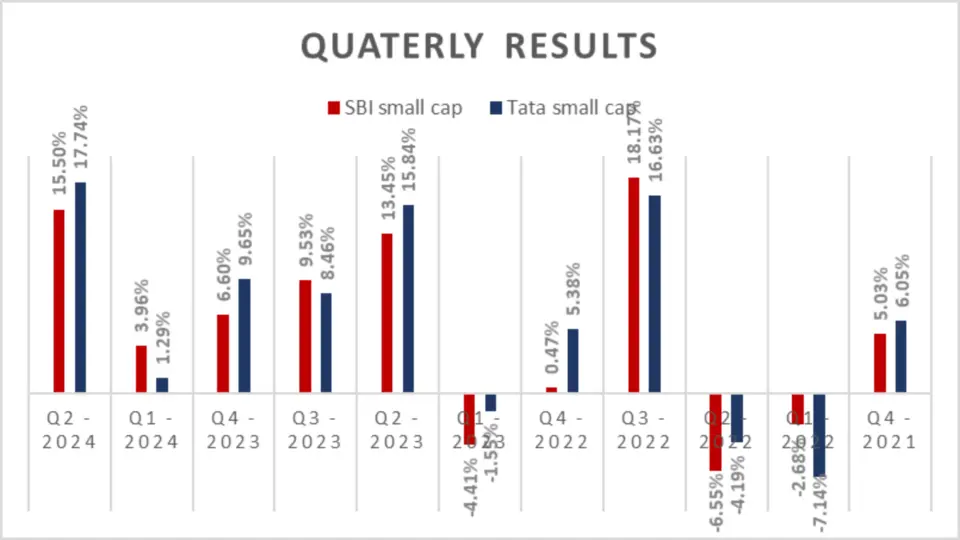
| Period | SBI Small Cap Fund | Tata Small Cap Fund |
| Q2 – 2024 | 15.50% | 17.74% |
| Q1 – 2024 | 3.96% | 1.29% |
| Q4 – 2023 | 6.60% | 9.65% |
| Q3 – 2023 | 9.53% | 8.46% |
| Q2 – 2023 | 13.45% | 15.84% |
| Q1 – 2023 | -4.41% | -1.55% |
| Q4 – 2022 | 0.47% | 5.38% |
| Q3 – 2022 | 18.17% | 16.63% |
| Q2 – 2022 | -6.55% | -4.19% |
| Q1 – 2022 | -2.68% | -7.14% |
| Q4 – 2021 | 5.03% | 6.05% |
| Q3 – 2021 | 8.92% | 10.21% |
| Q2 – 2021 | 14.11% | 23.15% |
| Q1 – 2021 | 10.78% | 17.39% |
| Q4 – 2020 | 21.88% | 17.40% |
| Q3 – 2020 | 20.26% | 16.40% |
| Q2 – 2020 | 20.66% | 23.78% |
| Q1 – 2020 | -23.47% | -26.25% |
| Q4 – 2019 | 3.87% | 5.01% |
| Q3 – 2019 | 1.53% | -2.54% |
| Q2 – 2019 | -1.70% | -1.33% |
| Q1 – 2019 | 3.43% | 3.46% |
Analysis
- Recent Quarters: Tata Small Cap Fund outperformed SBI in Q2 2024 with a return of 17.74%, compared to SBI’s 15.50%.
- 2023: Tata Small Cap delivered higher returns in Q4 and Q2, while SBI fared better in Q1 and Q3.
- 2021 and 2020: Tata Small Cap consistently showed more substantial results, especially in Q2 2021, with a whopping 23.15% return compared to SBI’s 14.11%.
Key Takeaway:
In recent years, Tata Small Cap Fund has consistently outperformed during favourable market conditions. However, the SBI Small Cap Fund holds its own in quarters with market downturns.
Total and Average Returns:
After reviewing quarter-by-quarter results, let’s zoom out and look at each fund’s total and average returns.
Total and Average Returns Table
| Metric | SBI Small Cap Fund | Tata Small Cap Fund |
| Total Return | 139.34% | 154.84% |
| Average Return | 6.33% | 7.04% |
Analysis
- Total Return: Tata Small Cap Fund has delivered a total return of 154.84%, while SBI Small Cap lags behind at 139.34%.
- Average Return: Tata also leads in average Return, with 7.04% against SBI’s 6.33%.
Outperformance Table
| Fund | No. of Out performances | First 11 Periods | Next 11 Periods |
| SBI Small Cap Fund | 8 | 4 | 4 |
| Tata Small Cap Fund | 14 | 7 | 7 |
Key Takeaway:
If you’re looking for long-term growth, Tata Small Cap Fund has provided higher total and average returns, making it a better option for wealth accumulation.
Risk Analysis Table
Maximum Drawdown:
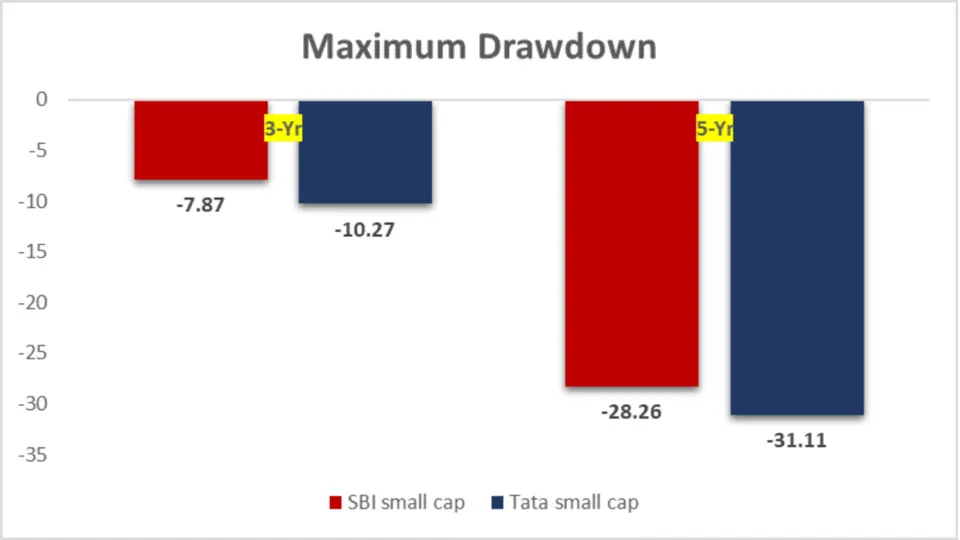
The maximum drawdown measures the most significant drop in a fund’s value from peak to trough over a specified period. For investors concerned about risk, this metric is critical.
| Period | SBI Small Cap (3-Yr) | SBI Small Cap (5-Yr) | Tata Small Cap (3-Yr) | Tata Small Cap (5-Yr) |
| Drawdown | -7.87% | -28.26% | -10.27% | -31.11% |
Analysis
- 3-Year Period: SBI Small Cap Fund had a drawdown of -7.87%, while Tata Small Cap dropped slightly more at -10.27%.
- 5-Year Period: The gap widens as Tata Small Cap Fund shows a drawdown of -31.11%, compared to SBI’s -28.26%.
Key Takeaway:
If risk mitigation is your top priority, SBI Small Cap had a lower drawdown over both 3-year and 5-year periods, making it a less risky option than Tata.
Mean return, Sortino (%) & Treynor’s Ratio (%)


| Metric | SBI Small Cap Fund | Tata Small Cap Fund |
| Mean Return (%) | 23.58 | 27.28 |
| Sortino (%) | 2.52 | 2.51 |
| Treynor’s Ratio (%) | 0.23 | 0.24 |
Analysis
- Mean Return: Tata Small Cap has a higher mean return of 27.28%, compared to SBI Small Cap’s 23.58%, making it a better performer in terms of overall returns.
- Sortino Ratio: SBI Small Cap slightly edges out Tata with a Sortino ratio of 2.52 versus Tata’s 2.51. This indicates that SBI performs marginally better in avoiding downside risk.
- Treynor’s Ratio: Tata Small Cap leads here with 0.24, indicating a slightly better market risk-reward per unit than SBI’s 0.23.
Key Takeaway:
Tata Small Cap is the winner if you’re seeking higher overall returns. However, SBI Small Cap Fund does a marginally better job of managing downside risk.
Standard Deviation:
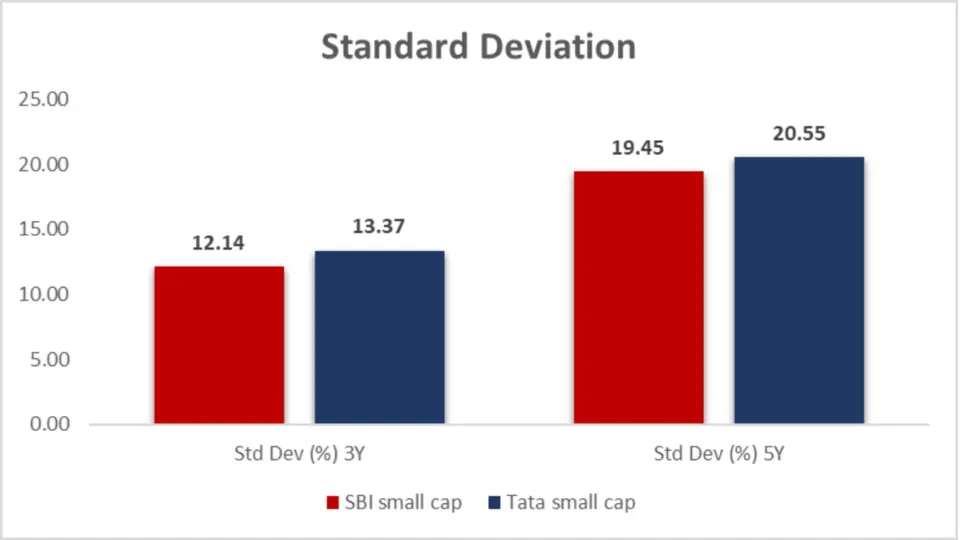
The standard deviation indicates a measure of risk, showing how much a fund’s returns deviate from its average returns. Higher values indicate higher volatility.
| Period | SBI Small Cap Fund | Tata Small Cap Fund |
| 3-Year (%) | 12.14 | 13.37 |
| 5-Year (%) | 19.45 | 20.55 |
Analysis
- 3-Year Standard Deviation: SBI Small Cap has a lower standard deviation of 12.14%, compared to Tata’s 13.37%, suggesting lower volatility over the last 3 years.
- 5-Year Standard Deviation: The trend continues for the 5 years, with SBI showing 19.45% volatility versus Tata’s 20.55%.
Key Takeaway:
Regarding volatility, SBI Small Cap Fund offers a more stable ride, with lower standard deviations over 3- and 5-year periods. It’s a better choice if you want to minimize the rollercoaster of market swings.
Sharpe Ratio:
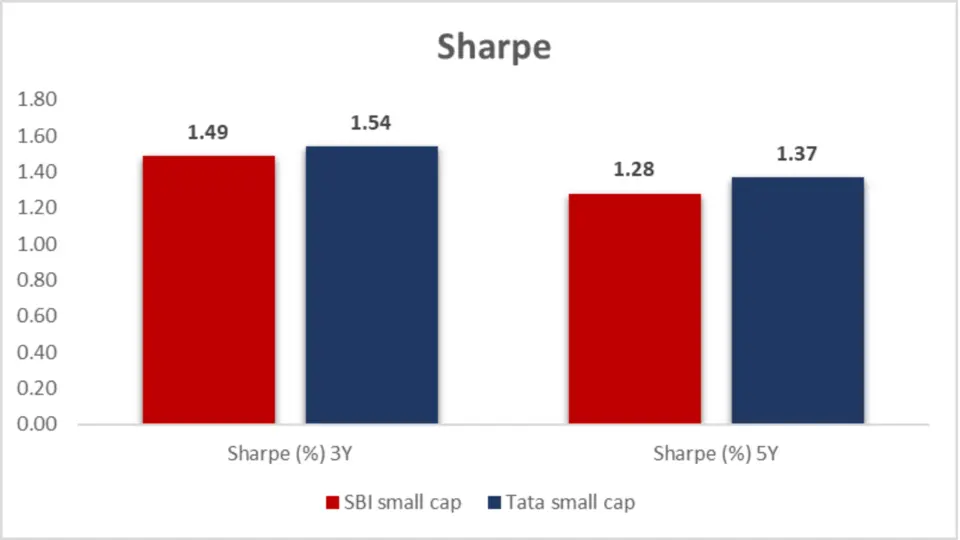
The Sharpe ratio measures the Return generated per unit of risk. A higher Sharpe ratio means better risk-adjusted performance.
| Period | SBI Small Cap Fund | Tata Small Cap Fund |
| 3-Year (%) | 1.49 | 1.54 |
| 5-Year (%) | 1.28 | 1.37 |
Analysis
- 3-Year Sharpe Ratio: Tata Small Cap Fund comes out slightly ahead with a Sharpe ratio of 1.54 versus SBI’s 1.49.
- 5-Year Sharpe Ratio: Tata leads again with 1.37 compared to SBI’s 1.28.
Key Takeaway:
For risk-adjusted returns, Tata Small Cap Fund consistently provides better returns for each unit of risk, making it the more robust choice if you prioritize maximizing returns relative to the risk.
Beta:
Beta measures a fund’s sensitivity to market movements. A Beta of less than one indicates that the fund is less impulsive than the market. At the same time, a Beta more significant than 1 indicates higher volatility.

| Period | SBI Small Cap Fund | Tata Small Cap Fund |
| 3-Year (%) | 0.64 | 0.70 |
| 5-Year (%) | 0.79 | 0.83 |
Analysis
- 3-Year Beta: The SBI Small Cap Fund has a Beta of 0.64, which indicates it is less sensitive to market fluctuations than Tata Small Cap Fund, which has a Beta of 0.70.
- 5-Year Beta: SBI Small Cap has a lower Beta of 0.79 over 5 years, compared to Tata’s 0.83.
Key Takeaway:
SBI Small Cap is the more conservative choice, with a lower Beta indicating less sensitivity to market volatility. It’s a better option if you want to hedge against extreme market movements.
Alpha:
Alpha measures a fund’s performance relative to a benchmark index, indicating how much value the fund manager adds.

| Period | SBI Small Cap Fund | Tata Small Cap Fund |
| 3-Year (%) | 4.5 | 5.66 |
| 5-Year (%) | 2.47 | 4.61 |
Analysis
- 3-Year Alpha: Tata Small Cap Fund takes the lead with an Alpha of 5.66%, compared to SBI’s 4.5%.
- 5-Year Alpha: Tata continues its dominance with a 5-year Alpha of 4.61%, versus SBI’s 2.47%.
Key Takeaway:
Regarding adding value beyond the market benchmark, Tata Small Cap Fund is the clear winner with higher Alpha in both 3-year and 5-year periods.
Ratings

| Ratings | SBI Small Cap Fund | Tata Small Cap Fund |
| CRISIL (as on 30th Jun 2024) | 3 | 3 |
| CRISIL (as on 31st Mar 2024) | 2 | 3 |
| CRISIL (as on 31st Dec 2023) | 1 | 3 |
| CRISIL (as on 30th Sep 2023) | 2 | 4 |
| CRISIL (as on 30th Jun 2023) | 2 | 4 |
| Value Research Ratings | 3 | 5 |
| Morningstar Ratings | 4 | 4 |
Analysis
- CRISIL Ratings: Over time, Tata Small Cap has shown consistent improvement in its CRISIL rankings, moving up to a rating of 4 by September 2023, while SBI Small Cap maintained a rating of 2.
- Value Research Ratings: Tata Small Cap shines here with a 5-star rating compared to SBI’s 3-star rating, signalling better performance and consistency in Tata’s management.
- Morningstar Ratings: Both funds hold steady at 4-star ratings from Morningstar.
Key Takeaway:
Tata Small Cap shows better rankings overall, with higher ratings from CRISIL (recent quarters) and Value Research, suggesting more robust performance and fund management.
Portfolio Analysis:
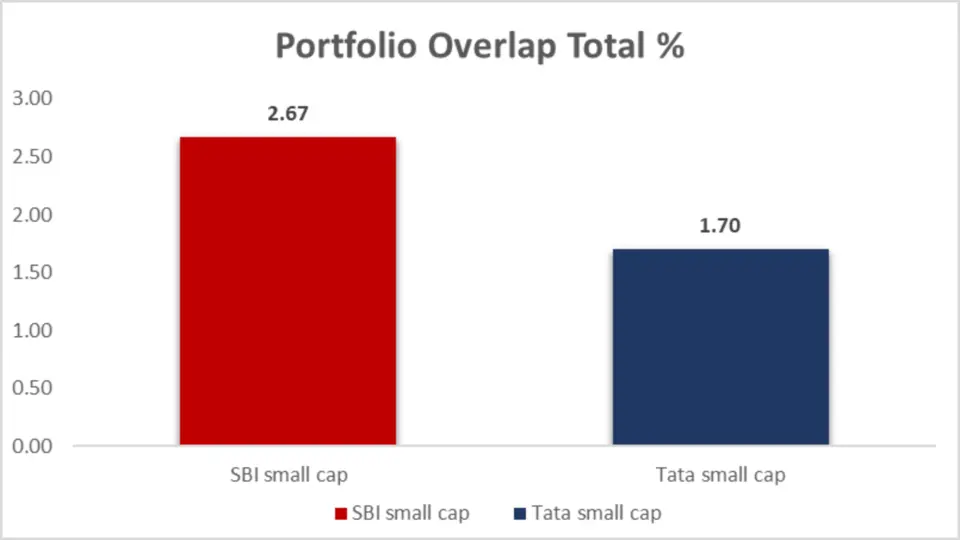
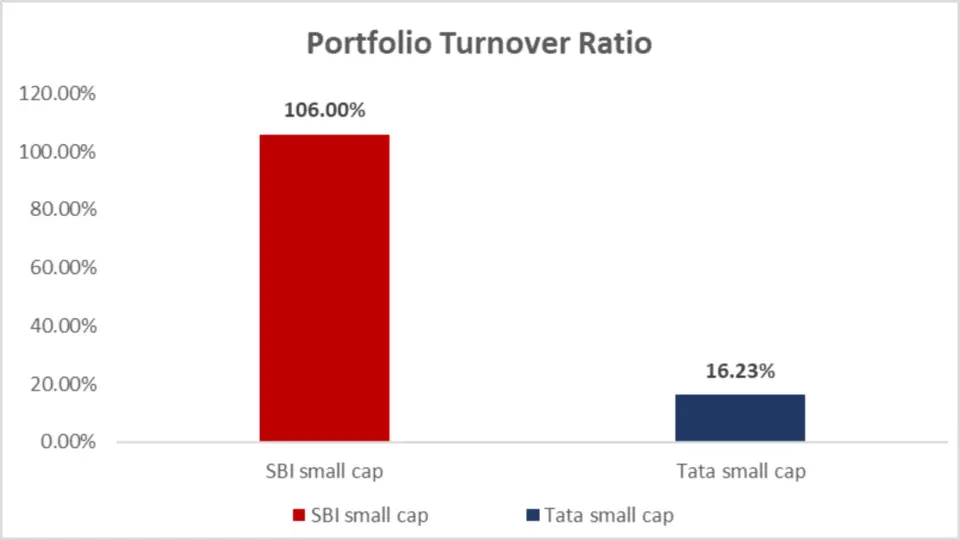
Portfolio turnover ratio and overlap are two essential aspects to consider when evaluating the stability and distinctiveness of a mutual fund. A high turnover ratio indicates frequent trading, leading to higher transaction costs and volatility. Conversely, portfolio overlap shows how much two funds have in common regarding stock holdings.
Portfolio Overlap and Turnover Ratio Table
| Metric | SBI Small Cap Fund | Tata Small Cap Fund |
| Portfolio Overlap Total (%) | 2.67 | 1.70 |
| Portfolio Turnover Ratio (%) | 106.00 | 16.23 |
Analysis
- Portfolio Overlap: Tata Small Cap Fund has a lower overlap of 1.70% compared to SBI’s 2.67%, indicating that Tata’s portfolio is more distinct from other small-cap funds.
- Turnover Ratio: The difference is staggering. SBI shows a much higher turnover ratio of 106%, meaning that the fund manager frequently trades the assets. In contrast, Tata Small Cap has a much lower turnover ratio of 16.23%, indicating a more stable and long-term investment strategy.
Key Takeaway:
If you prefer a more stable, low-turnover portfolio, Tata Small Cap is the winner. However, SBI Small Cap’s high turnover might offer opportunities for capturing short-term gains at the cost of increased trading activity.
Portfolio Comparison
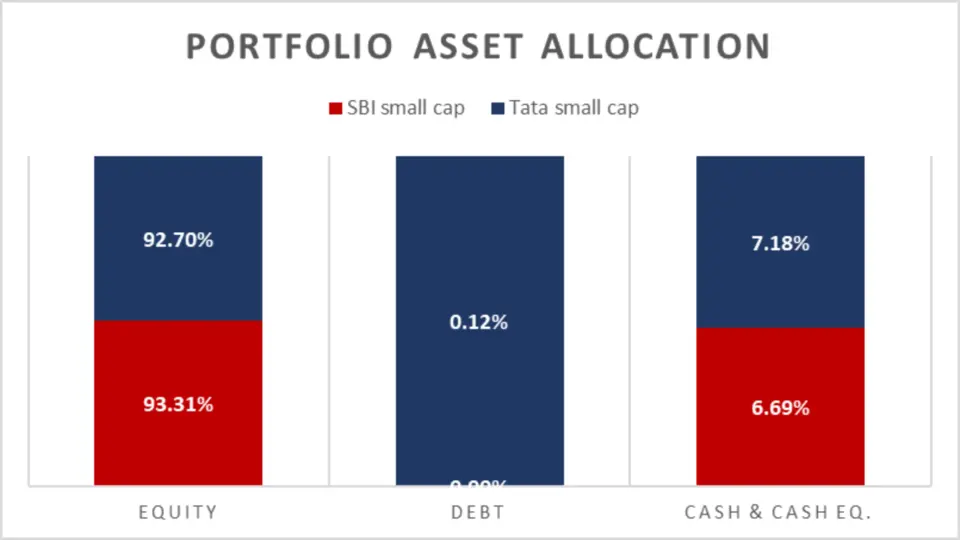
| Category | SBI Small Cap Fund | Tata Small Cap Fund |
| Equity (%) | 93.31% | 92.70% |
| Debt (%) | 0.00% | 0.12% |
| Cash & Cash Equivalents (%) | 6.69% | 7.18% |
Analysis
- Equity Allocation: Both funds are heavily focused on equities, with SBI Small Cap slightly higher at 93.31%, compared to Tata’s 92.70%.
- Debt Allocation: Tata Small Cap holds a small amount of debt at 0.12%, while SBI Small Cap has no debt exposure.
- Cash Allocation: Tata Small Cap holds a higher percentage of cash and cash equivalents at 7.18%, compared to SBI’s 6.69%.
Key Takeaway:
Both funds are equity-heavy, which is typical for small-cap funds. However, Tata Small Cap offers slightly more diversification with a small exposure to debt and higher cash reserves, which can be helpful during volatile market conditions.
Market Cap Allocation:
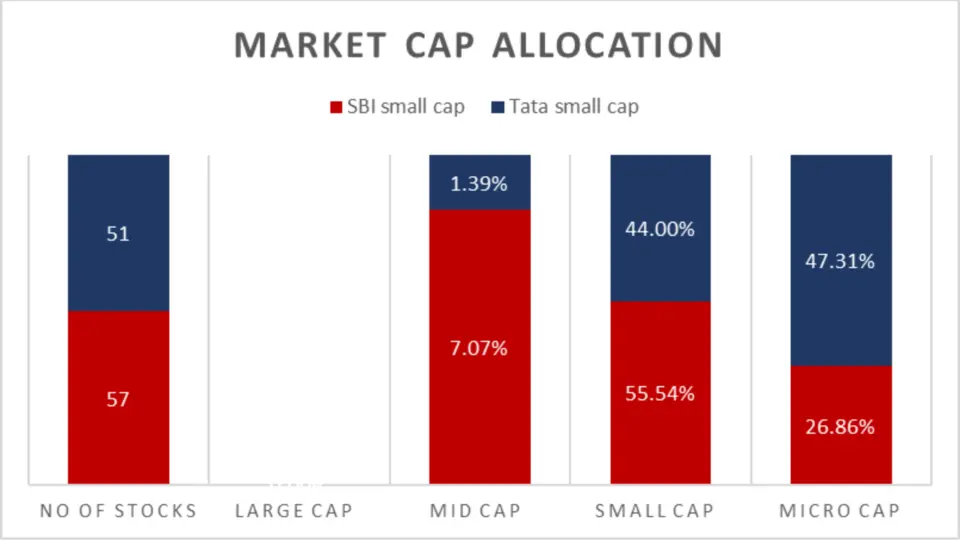
When investing in small-cap funds, it’s crucial to understand how the portfolio is divided across market capitalizations. Let’s break down the allocation for both funds’ large-cap, mid-cap, small-cap, and micro-cap stocks.
| Metric | SBI Small Cap Fund | Tata Small Cap Fund |
| No. of Stocks | 57 | 51 |
| Large Cap (%) | 0.00% | 0.00% |
| Mid Cap (%) | 7.07% | 1.39% |
| Small Cap (%) | 55.54% | 44.00% |
| Micro Cap (%) | 26.86% | 47.31% |
Analysis
- Number of Stocks: SBI Small Cap holds 57 stocks, compared to Tata’s 51 stocks. A more significant number of holdings can provide more diversification.
- Mid-Cap Allocation: SBI Small Cap allocates more to mid-cap stocks at 7.07%, while Tata only allocates 1.39% to mid-cap stocks.
- Small Cap Allocation: SBI Small Cap is more heavily weighted toward small-cap stocks, with 55.54% of its portfolio allocated here, compared to 44.00% for Tata.
- Micro Cap Allocation: Tata Small Cap takes a more aggressive approach by allocating 47.31% to micro-cap stocks, compared to SBI’s 26.86%.
Key Takeaway:
Suppose you prefer a higher allocation to micro-cap stocks (typically riskier but with higher growth potential). In that case, Tata Small Cap is the better option. However, suppose you’re looking for more balance between small-cap and mid-cap stocks. In that case, SBI Small Cap may provide the necessary diversification.
Sector Allocation
How a fund allocates its assets across different sectors can significantly influence its performance, especially in volatile market environments.

| Sector | SBI Small Cap Fund (%) | Tata Small Cap Fund (%) |
| Industrials | 34.05 | 22.84 |
| Consumer Discretionary | 19.75 | 11.61 |
| Financials | 14.16 | 8.57 |
| Materials | 12.43 | 21.38 |
| Consumer Staples | 5.32 | 4.47 |
| Real Estate | 1.70 | 4.65 |
| Healthcare | 1.62 | 8.70 |
| Energy & Utilities | 0.46 | NA |
| Technology | NA | 7.30 |
| Diversified | NA | 3.18 |
Analysis
- SBI Small Cap has a heavier concentration in the Industrials and Consumer Discretionary sectors, potentially offering robust growth opportunities in these areas.
- Tata Small Cap, meanwhile, shows significant investments in Materials and Healthcare, sectors known for their resilience during economic downturns.
- The presence of Technology and Diversified investments in Tata Small Cap could indicate a more balanced approach towards emerging and stable sectors.
Key Takeaway:
SBI Small Cap might appeal to investors seeking aggressive growth in industrial and consumer markets. At the same time, Tata Small Cap offers a broader diversification with a focus on materials and healthcare, potentially providing a cushion against market volatility.
Fund Management:
The expertise and stability of fund management are critical in navigating the complexities of small-cap investments.
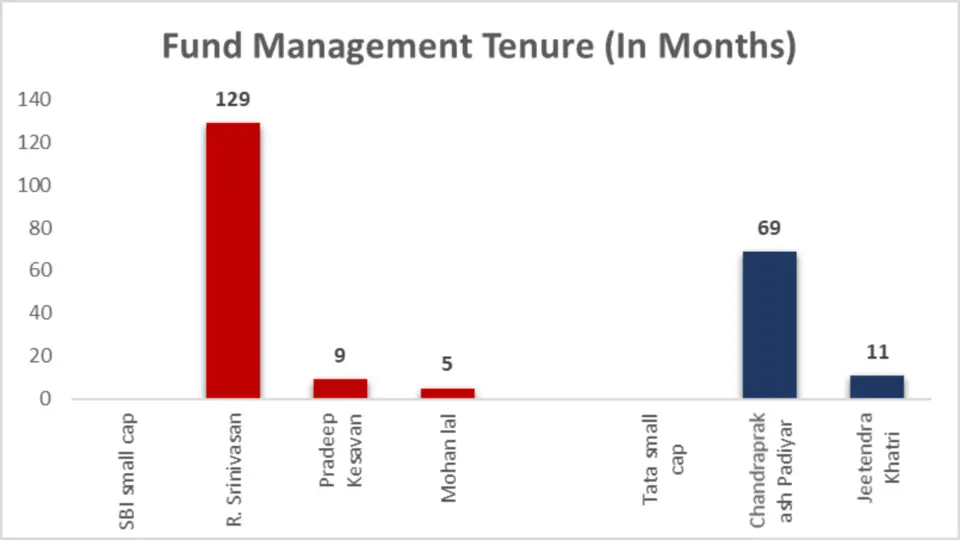
| Fund | Manager | Tenure (Months) |
| SBI Small Cap Fund | R. Srinivasan | 129 |
| Pradeep Kesavan | 9 | |
| Mohan lal | 5 | |
| Tata Small Cap Fund | Chandraprakash Padiya | 69 |
| Jeetendra Khatri | 11 |
Analysis
- R. Srinivasan of SBI Small Cap brings a wealth of experience with over a decade of fund management, suggesting deep insights and a proven track record in small-cap investing.
- Tata Small Cap features relatively newer managers. Chandraprakash Padiya shows a substantial tenure, indicating a fresh yet experienced approach to managing the fund.
Key Takeaway:
Investors might find the long tenure of SBI’s R. Srinivasan reassuring, pointing to stability and experience in fund management. However, the fresh perspectives from Tata’s fund managers could also attract those looking for new growth strategies.
General Details
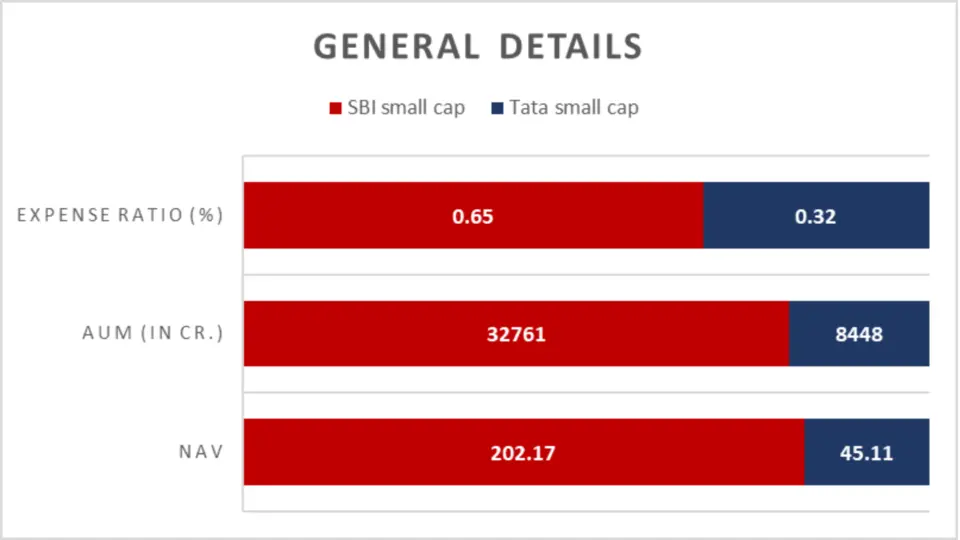
| Metric | SBI Small Cap Fund | Tata Small Cap Fund |
| NAV | ₹202.17 | ₹45.11 |
| AUM (in Cr.) | 32,761 | 8,448 |
| Expense Ratio (%) | 0.65 | 0.32 |
| Minimum SIP Investment | ₹500 | ₹100 |
Analysis
- SBI Small Cap Fund boasts a significantly larger AUM, indicating higher investor trust and a broader capital base.
- With its lower NAV and expense ratio, Tata Small Cap Fund offers an accessible and cost-effective entry point for new and cost-conscious investors.
Key Takeaway:
SBI Small Cap Fund is a giant in the small-cap space with substantial assets under management, suggesting strong investor confidence and stability. On the other hand, Tata Small Cap Fund is more reachable to a broader range of investors thanks to its lower initial investment requirement and cheaper expense ratio.
Conclusion
Both SBI Small Cap Fund and Tata Small Cap Fund have their strengths depending on the investor’s risk appetite and financial goals. Tata Small Cap Fund is better across most parameters, including higher returns, lower expense ratios, and a more diversified sector allocation. This makes it ideal for investors looking for aggressive growth and higher risk.
However, SBI Small Cap Fund shines in managing downside risk with lower volatility, a more experienced fund management team, and better performance in mitigating market drawdowns, making it a more stable option for risk-averse investors who prefer a conservative approach.
In summary, Tata Small Cap Fund is superior for those chasing high returns. At the same time, the SBI Small Cap Fund is better suited for investors prioritizing stability and long-term resilience.

FAQs: SBI Small Cap vs Tata Small Cap
Which small-cap fund has better returns, SBI Small Cap or Tata Small Cap?
Tata Small Cap consistently outperforms SBI Small Cap across different time horizons. As of September 6, 2024, Tata Small Cap has a higher return for 1-year (48.44%), 2-year (40.57%), and 5-year (37.20%) compared to SBI Small Cap’s respective returns of 38.30%, 28.58%, and 32.03%.
Is Tata Small Cap a better choice for SIP investments?
Yes, Tata Small Cap offers better SIP returns across all periods. Over 1 year, Tata Small Cap provided a return of 61.90%, whereas SBI Small Cap gave 46.59%. For a 5-year SIP, Tata’s Return was 40.36% compared to SBI’s 32.69%
What is the minimum SIP investment amount for SBI and Tata Small Cap?
SBI Small Cap requires a minimum SIP investment of ₹500, while Tata Small Cap has a lower entry point of ₹100.
Which fund has a lower expense ratio?
Tata Small Cap has a lower expense ratio of 0.32% compared to SBI Small Cap’s 0.65%, making Tata a more cost-effective option for long-term investors.
Which fund is less risky in terms of volatility?
SBI Small Cap is less volatile than Tata Small Cap. Over 5 years, SBI’s standard deviation is 19.45%, lower than Tata’s 20.55%, indicating that SBI Small Cap is a more stable investment during market fluctuations.
Does Tata Small Cap have better fund management?
Both funds have strong management teams, but SBI Small Cap’s fund manager, R. Srinivasan, brings over 10 years of experience (129 months), providing stability. Tata Small Cap, however, also has a solid management team, with Chandraprakash Padiyar leading for 69 months.
Which fund performs better in terms of risk-adjusted returns?
Tata Small Cap edges out SBI Small Cap in terms of risk-adjusted returns. Its 3-year Sharpe ratio is 1.54 compared to SBI’s 1.49, indicating better returns than the risk taken.
Is Tata Small Cap better for long-term wealth accumulation?
Yes, Tata Small Cap has shown better total and average returns. Over the long term, it delivered a total return of 154.84%, while SBI Small Cap provided 139.34%.
Which fund is more conservative for risk-averse investors?
SBI Small Cap is a more conservative option, with lower impulsiveness and a smaller maximum drawdown (-28.26% over 5 years) than Tata’s higher drawdown of -31.11%.
What is the portfolio overlap between SBI Small Cap and Tata Small Cap?
The portfolio overlap between these two funds is low, with SBI Small Cap having a 2.67% overlap and Tata Small Cap having just 1.70%. This indicates that both funds invest in unique small-cap stocks.
Disclaimer:
The information provided in this article is solely the author/advertisers’ opinion and not investment advice – it is provided for educational purposes only. Using this, you agree that the information does not constitute any investment or financial instructions by Ace Equity Research/Mutual Fund Focus/IPO First and the team. Anyone wishing to invest should seek their own independent financial or professional advice. Conduct your research with registered financial advisors before making any investment decisions. Ace Equity Research/ Mutual Fund Focus / IPO First and the team are not accountable for the investment views provided in the article.
Mutual Fund investments are subject to market risks. Read all scheme-related documents carefully.
Investments in the securities market are subject to market risks. Read all the related documents carefully before investing
